Sample Category Title
EUR/USD Could Nosedive Below 1.1780
Key Highlights
- EUR/USD is struggling to recover and it could decline further below 1.1780.
- A key bearish trend line is forming with resistance near 1.1820 on the 4-hours chart.
- GBP/USD failed to surpass 1.3900 and started a fresh decline.
- Crude oil price is correcting gains and it could even decline below $70.00.
EUR/USD Technical Analysis
The Euro remained in a bearish zone below the 1.1850 resistance zone against the US Dollar. EUR/USD is struggling to stay above 1.1800 and it could even dive below 1.1780.
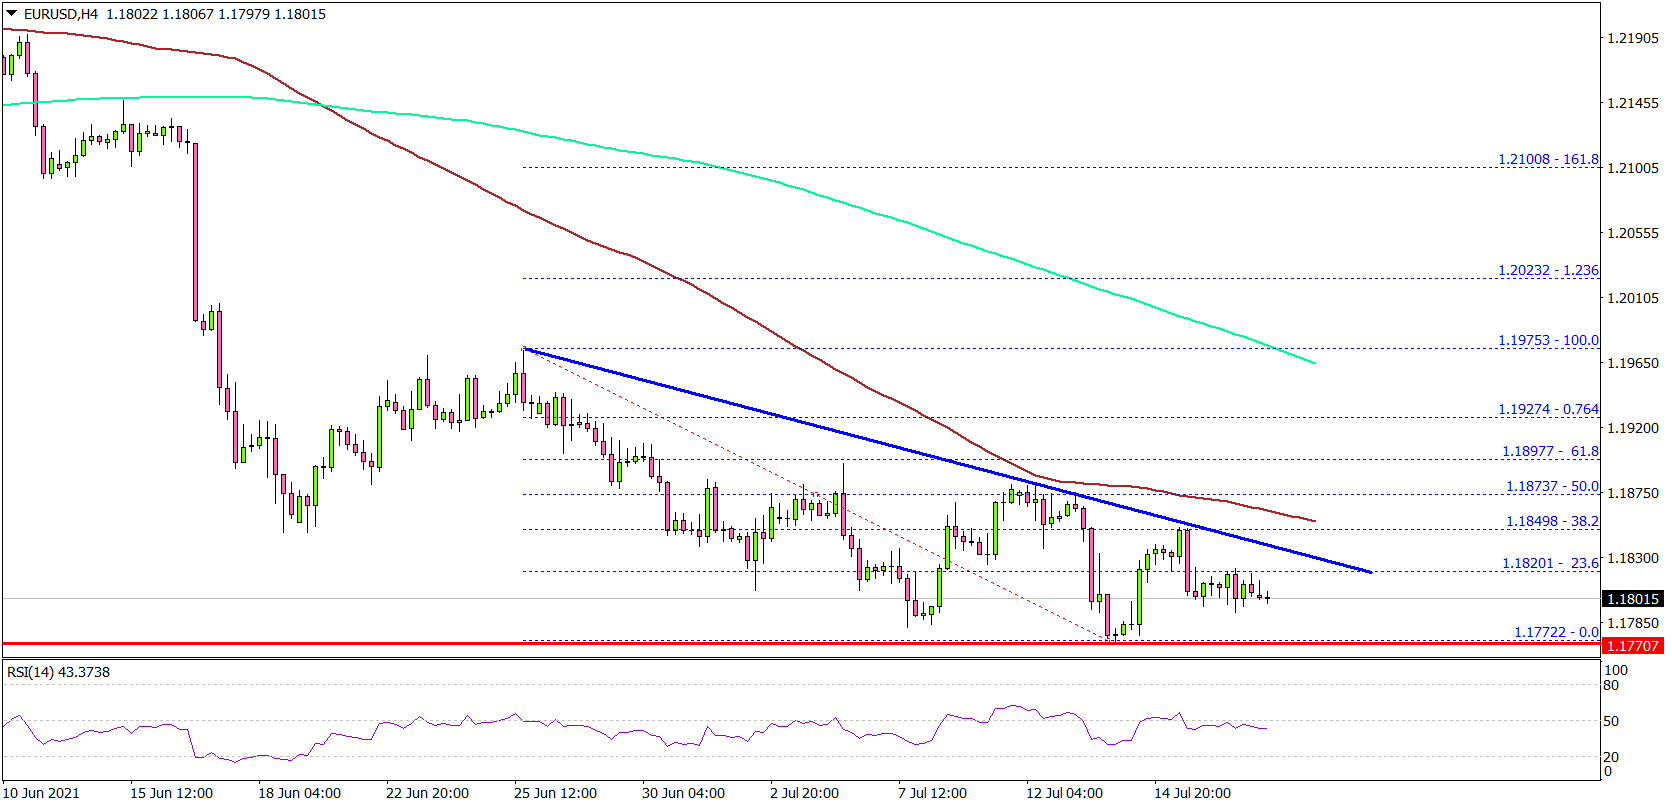
Looking at the 4-hours chart, the pair seems to be following a bearish path from the 1.1975 swing high. The pair has settled below the 1.1850 level, the 100 simple moving average (red, 4-hours), and the 200 simple moving average (green, 4-hours).
The pair is now struggling to stay above the 1.1800 and 1.1780 support levels. If there is a close below 1.1780, there is a risk of a sharp decline.
In the stated case, the pair could test 1.1750. Any more losses might lead the pair towards the 1.1720 support. On the upside, there is a key bearish trend line forming with resistance near 1.1820 on the same chart.
A successful close above the trend line could lead the pair towards 1.1850 and the 100 SMA. If the pair settled above 1.1850, it could even recover above 1.1900.
Looking at GBP/USD, the pair failed to clear the 1.3900 resistance level and it is could continue to slide below 1.3720.
Economic Releases
- BoE's Haskel speech.
Market Morning Briefing: EURJPY Has Scope To Fall To 129 In The Near Term
STOCKS
Asians are trading in red following the sharp fall in the Dow on Friday. Dow will have to sustain above 34400 to see the rise to 36000 from here itself. Else a fall to 34000-33500 can be seen first before the expected rise happens. DAX has been coming down with its 15300-15800 range. Nikkei has room to test 27200-27000 from where it can bounce again. Shanghai looks vulnerable to break its 3500-3625 range on the downside and fall to 3450-3400 first before resuming its broader uptrend. Sensex and Nifty can fall back into their 52000-53000 and 15600-15900 range respectively again following the weakness in the other markets. This could delay the rally to 54000 (Sensex) and 16000-16200 (Nifty).
Dow (34687.85, −299.17, -0.86%) has come-off sharply on Friday. 34500-34400 will be a key support to watch which if broken can drag the Dow down to 34000-33500 in the coming weeks. Such a break will also delay the expected break above 35100 and the rise to 36000. From the big picture the broader trend is up while above 33500.
DAX (15540.31, −89.35, -0.57%) has declined further on Friday and can test the lower end of its 15300-15800 range. 15200 is an important support while above which the broader view remains bullish to see a break above 15800 and a rise to 16000-16200.
Nikkei (27584.99, −418.09, -1.49%) has tumbled towards 27500 as expected and can extend the fall to 27200-27000. As mentioned on Friday, 27000 is a crucial support while above which a consolidation between 27000 and 29500 is possible for some time within the overall uptrend. In case of a break below 27000, Nikkei can see a deeper fall to 26000 and then see a fresh rise.
Shanghai (3509.61, −29.69, -0.84%) is trading at the lower end of its 3500-3625 range. A break below 3500 can drag it to 3450-3400. Thereafter a fresh rally can be seen. While above 3400 the long-term trend is up to target 3700-3800 on the upside.
Sensex (53140.06, −18.79, -0.04%) can fall back into its 52000-53000 range again taking cues from the weakness in the other markets. This will delay our expected rise to 54000 and higher levels. 52000 and 51000 are strong supports while above which the broader outlook is bullish.
Similarly, Nifty (15923.40, −0.80, -0.005%) can fall back into the 15600-15900 range and will delay the expected rise to 16000-16200. The overall trend is up with strong support in the 15600-15500 region.
COMMODITIES
Commodities trade lower today. Crude prices have fallen as expected and could soon see a bounce from $70/68 levels, failure of which will indicate bearishness for the medium term. The fall has been triggered by the result of the OPEC+ meeting yesterday that decided to increase production by 400,000 barrels a day by Sep'22 as demand seems to be increasing. Coordinated increases in production will start in Aug'21. Watch price action over the next few sessions. Gold and Silver still have scope for a rise while above 1800 and 25 respectively. Copper may test 4.20 and rise from there, failure of which will make it vulnerable to a sharp fall in the medium term. Watch price action near 4.20 for now.
Brent (72.48) and WTI (70.48) have come down significantly in line with our expectations of seeing a fall towards $70 and $68 respectively, mentioned last week. A strong bounce from here, if seen, can take the prices higher towards $73/75 but overall near term view is bearish. A break below $70/68 would confirm that and indicate a trend reversal if any.
Gold (1812.40) has come down sharply today. While above 1800,the chances of Seeing a test of 1820 and eventually 1840/1860 is still possible.
Silver (25.53) has come down sharply too. The bias is bullish while above 25 for a scope to rise above 25.50-26.00 again.
Copper (4.2805) has come down but is still trading within the range of 4.40-4.20.A bounce from the levels of 4.20 towards 4.40 looks possible from here.
FOREX
Dollar Index has risen sharply and could be headed towards 92.80-93 while Euro can re-test 1.1780/70-1.1750 on the downside. Aussie and Pound looks bearish and have fallen well. EURJPY looks weak towards 129 while USDJPY can be ranged within 109.50-110.50/80. USDCNY can rise towards 6.48/50 while above 6.46. USDINR can rise to 74.70/80 but need to see if it declines from there.
Dollar Index (92.73) has risen well and a break above 92.80 can take it higher towards 93. A break above 93, if seen and sustained would be strongly bullish for the index in the medium term, opening up chances of a rise to 94.0-94.50 before declining from there. For now, watch price action at 93.
Euro (1.1802) has bounced and trades above 1.18 but unless a rise above 1.1835-1.1850 is seen over the next few sessions, it would be difficult to turn bullish on Euro as scope for a fall to 1.1780/70-1.1750 still remains intact. Watch price action within 1.1750/80-1.1835/50 for the near term.
EURJPY (129.73) has scope to fall to 129 in the near term. A range of 129-130.50 looks possible for the coming sessions.
Dollar-Yen (109.90) continues trade within 109.50-110.50/80 region and could remain so for a few more sessions before breaking on either side of the range. Immediate view is bearish.
Aussie (0.7376) has fallen, breaking below the support at 0.74. Near term view is bearish towards 0.73.
Pound (1.3750) has dropped lower and looks bearish for the near to medium term towards 1.3720-1.3700. If there will be some reversal from 1.37 is to be seen.
USDCNY (6.4785) has risen and could rise towards 6.48/50 in the near term. Thereafter, if it breaks above 6.50 or not is to be seen.
USDINR (74.5150) was mostly stable in the previous week but held well above support at 74.40. While Dollar Index trades strong and Chinese Yuan and Euro show weakness against the Dollar, we may expect USDINR also to move up towards 74.70/80 on the upside before a dip from there is seen. The broad range of 74.20/40-74.80 is holding. We need to see if the pair manages to break on the upside or continue within the mentioned range in the near term.
INTEREST RATES
Both the US Treasury and the German yields are coming closer to their crucial supports within their broad downtrend and have little room to test it. We expect these supports to hold and trigger corrective bounce in the coming weeks before a fresh fall is seen. The 10Yr GoI is holding well above 6.18% and can see a rise to 6.3%-6.32% before resuming the broader downtrend. The 5Yr GoI can trade in the range of 5.64%-5.7% in the near-term with a bearish bias to break the range on the downside eventually.
The US 2Yr (0.23%), 5Yr (0.76%), 10Yr (1.28%) and 30Yr (1.90%) have come down towards their key supports. The 30Yr is at a crucial support level of 1.9% and the 10Yr has it at 1.25%-1.2%. We expect these supports to hold and see a corrective bounce towards 2.1%-2.2% (30Yr) and 1.45%-1.5% (10Yr) in the coming weeks. Thereafter a fresh fall is possible thereby keeping the long-term downtrend intact.
The German 2Yr (-0.69%) and 5Yr (-0.64%) yields remain stable while the 10Yr (-0.36%) and 30Yr (0.12%) have dipped further. The 30Yr has come closer to the key support zone of 0.10%-0.08% while the 10Yr has slightly more room to test -0.45%/-0.50% on the downside. We expect the yields to bounce from these supports to test 0.25% (30Yr) and -0.25% (10Yr) going forward. The broader trend is down which is likely to resume after the above mentioned corrective bounce.
The 10Yr GoI (6.2119%) is holding well above the support at 6.18%. As mentioned last week, while above 6.18%, the 10Yr can rise to 6.3%-6.32% first and then resume the broader downtrend. Similarly, the 5Yr is holding above 5.64% and can trade in the range of 5.64%-5.7% for some time before moving down to 5.6%.
Eco Data 7/19/21
[php_everywhere instance="1"]
EUR/USD Weekly Outlook
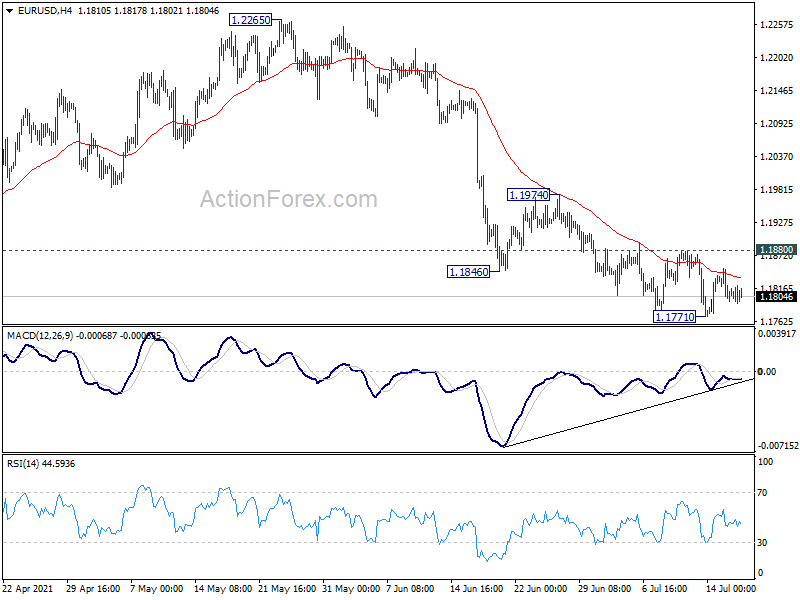
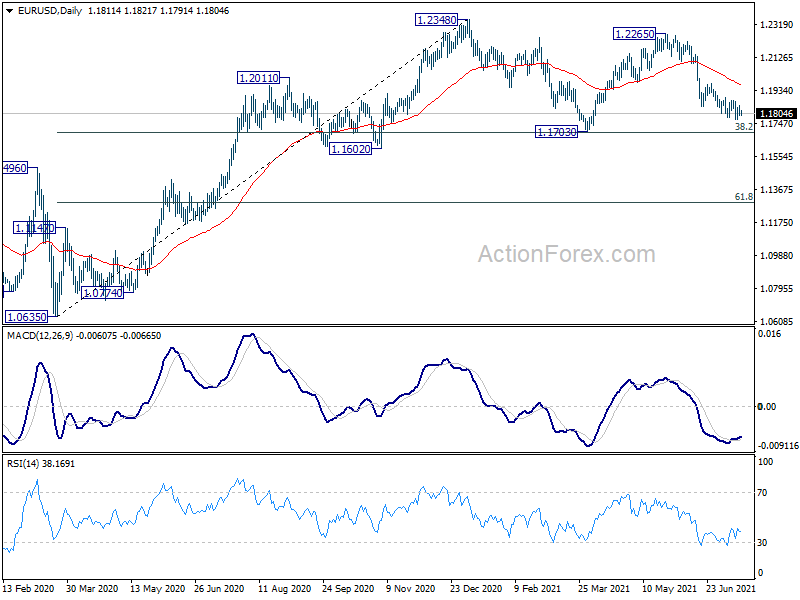
EUR/USD edged lower to 1.1771 but lost momentum since then. Initial bias stays neutral this week first. on the downside, break of 1.1771 will resume the fall from 1.2265, as the third leg of correction from 1.2348, to 1.1703 support. On the upside, though, break of 1.1880 will indicate short term bottoming and turn bias back to the upside for stronger rebound to 1.1974 resistance first.
In the bigger picture, rise from 1.0635 is seen as the third leg of the pattern from 1.0339 (2017 low). Further rally could be seen to cluster resistance at 1.2555 next, (38.2% retracement of 1.6039 to 1.0339 at 1.2516). This will remain the favored case as long as 1.1602 support holds. Reaction from 1.2555 should reveal underlying long term momentum in the pair. However sustained break of 1.1602 will argue that the rise from 1.0635 is over, and turn medium term outlook bearish again.
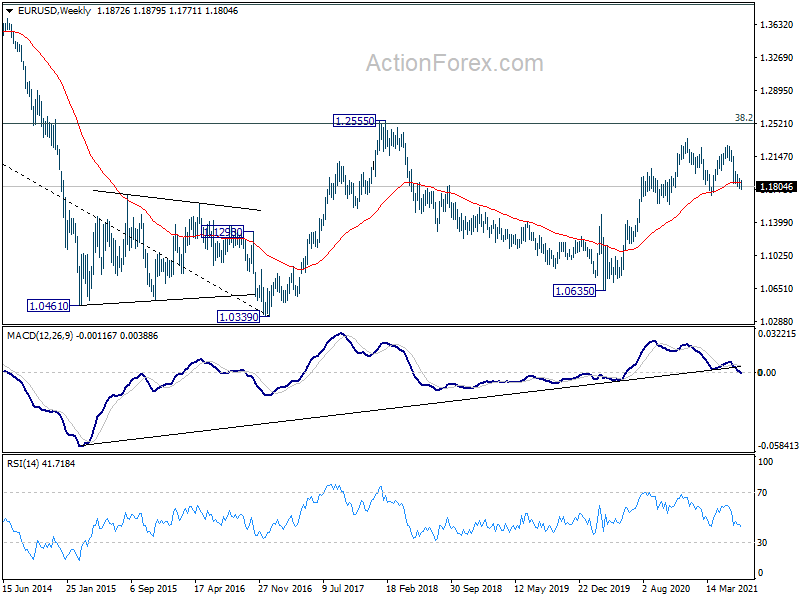
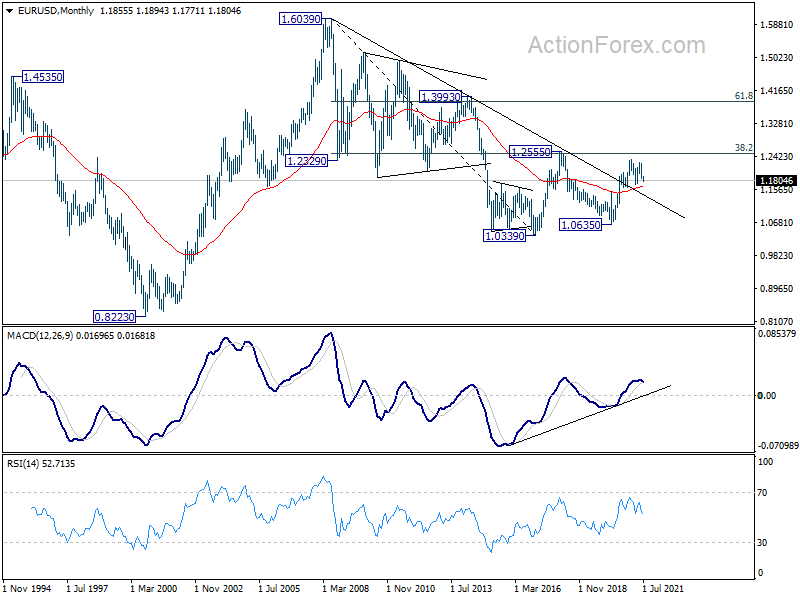
In the long term picture, focus remains on 1.2555 cluster resistance (38.2% retracement of 1.6039 to 1.0339 at 1.2516). Sustained break there should confirm long term bullish reversal and target 61.8% retracement at 1.3862 and above. However, rejection by 1.2555 will keep medium term outlook neutral first, and raise the prospect of down trend resumption at a later stage.
USD/JPY Weekly Outlook
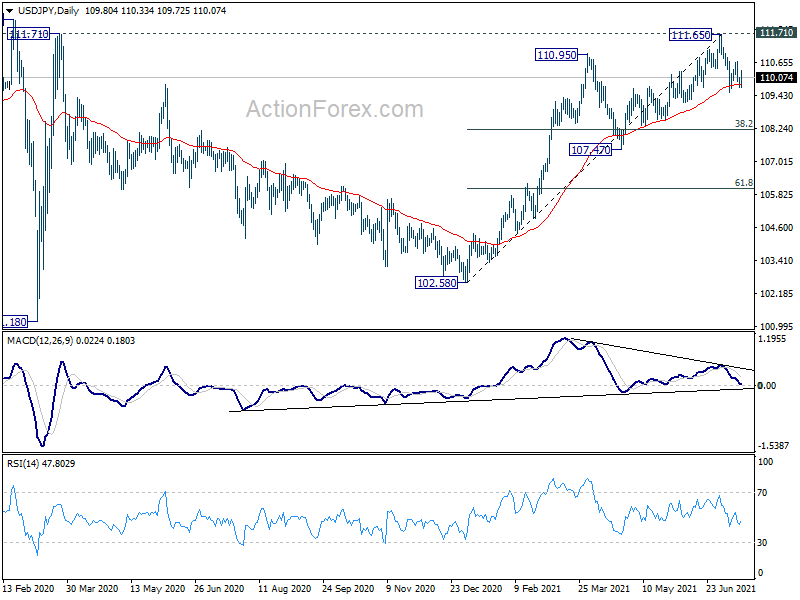
USD/JPY stayed in range above 109.52 last week and initial bias stays neutral this week first. On the downside, sustained trading below 55 day EMA (now at 109.84) will suggest that it's at least correcting the rise from 102..58. Deeper fall would be seen to 38.2% retracement of 102.58 to 111.65 at 108.18. For now, risk will stay on the downside as long as 111.65 resistance holds, in case of recovery.
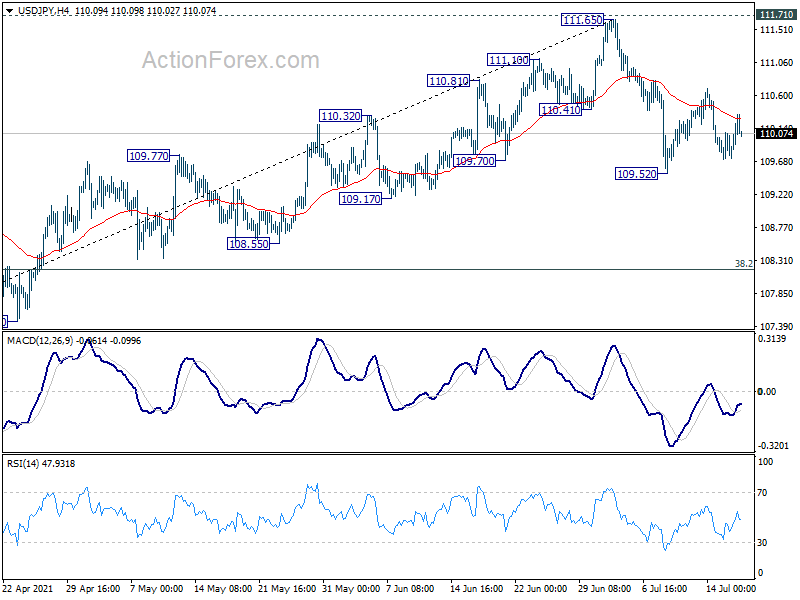
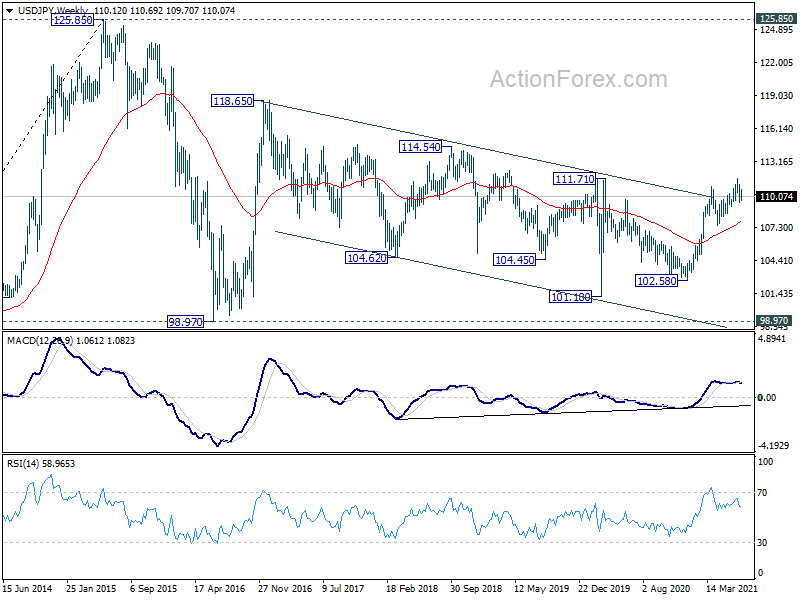
In the bigger picture, medium term outlook is staying neutral with 111.71 resistance intact. Though, as notable support was seen from 55 day EMA, rise from 102.58 is mildly in favor to extend higher. Decisive break of 111.71/112.22 resistance will suggest long term bullish reversal. Rise from 101.18 could then target 118.65 resistance (Dec 2016) and above. However, sustained break of 55 day EMA would revive some medium term bearishness, and open up deep fall back towards 102.58 support.
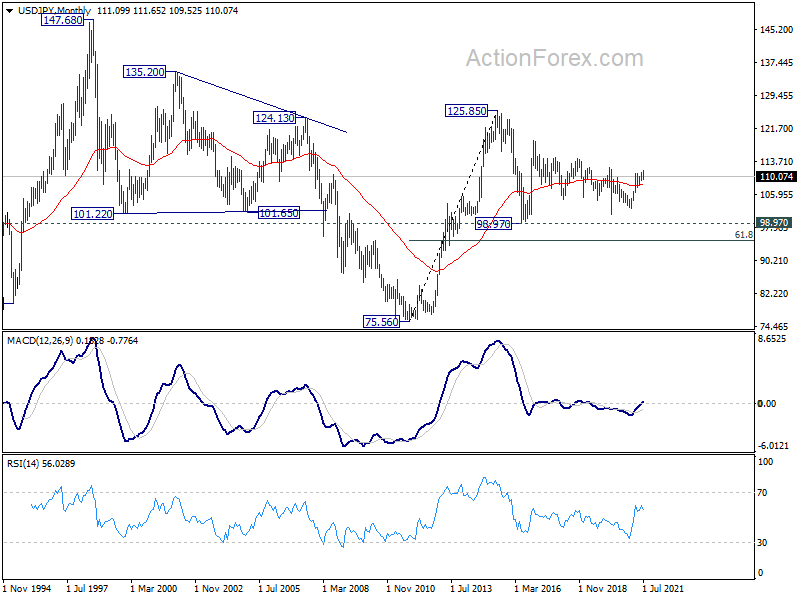
In the long term picture, the rise from 75.56 (2011 low) long term bottom to 125.85 (2015 high) is viewed as an impulsive move, no change in this view. Price actions from 125.85 are seen as a corrective pattern which could still extend. In case of deeper fall, downside should be contained by 61.8% retracement of 75.56 to 125.85 at 94.77. Up trend from 75.56 is expected to resume at a later stage for above 135.20/147.68 resistance zone.
GBP/USD Weekly Outlook
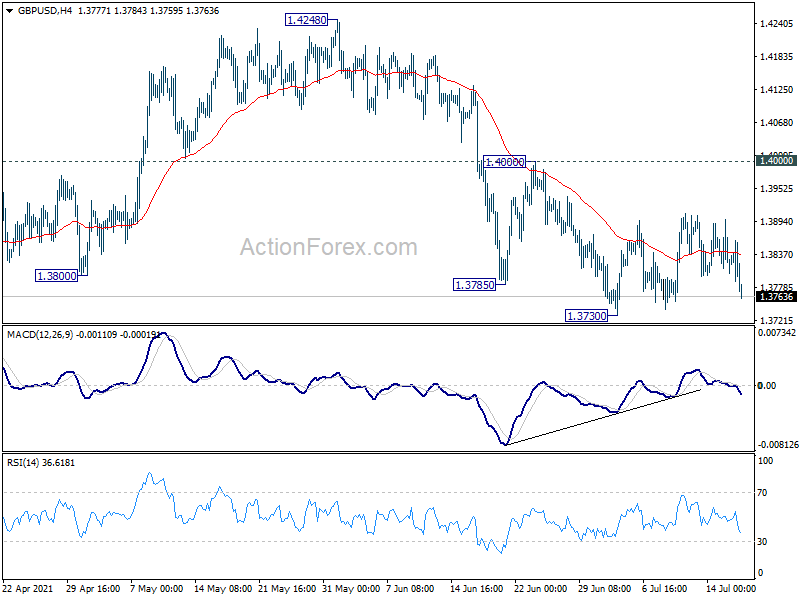
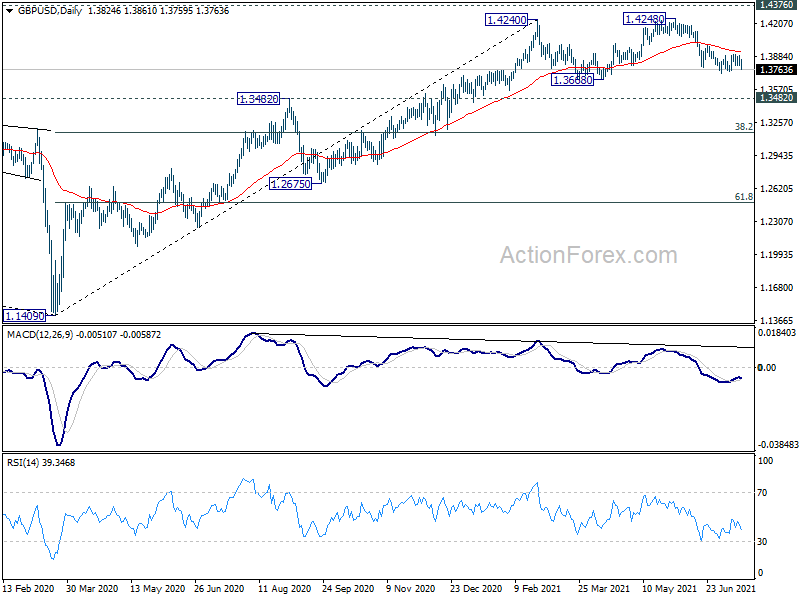
GBP/USD stayed in range above 1.3730 last week and initial bias stays neutral this week first. On the downside, break of 1.3730 will resume the fall from 1.4248, as the third leg of the consolidation pattern from 1.4240, to 1.3668 support and possibly below. On the upside, break of 1.4000 will turn bias back to the upside for retesting 1.4240/8 resistance zone instead.
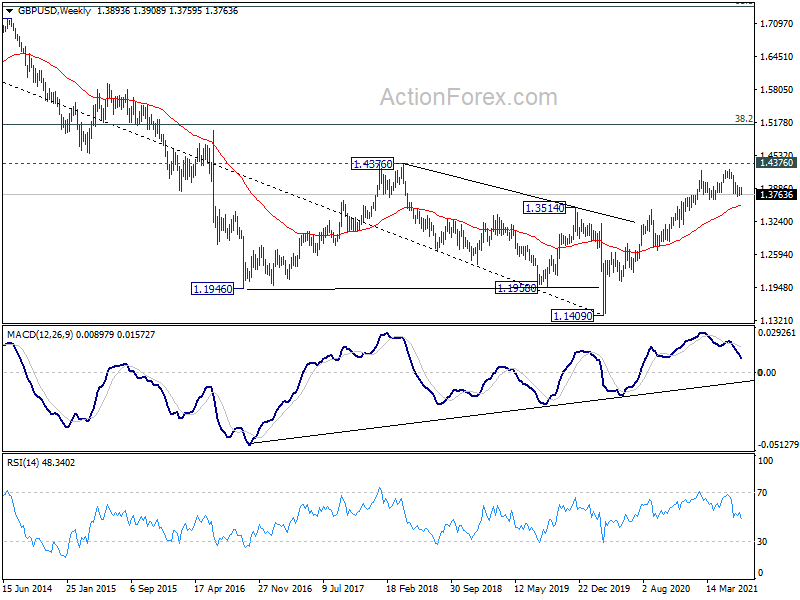
In the bigger picture, as long as 1.3482 resistance turned support holds, up trend from 1.1409 should still continue. Decisive break of 1.4376 resistance will carry larger bullish implications and target 38.2% retracement of 2.1161 (2007 high) to 1.1409 (2020 low) at 1.5134. However, firm break of 1.3482 support will argue that the rise from 1.1409 has completed and bring deeper fall to 1.2675 support and below.
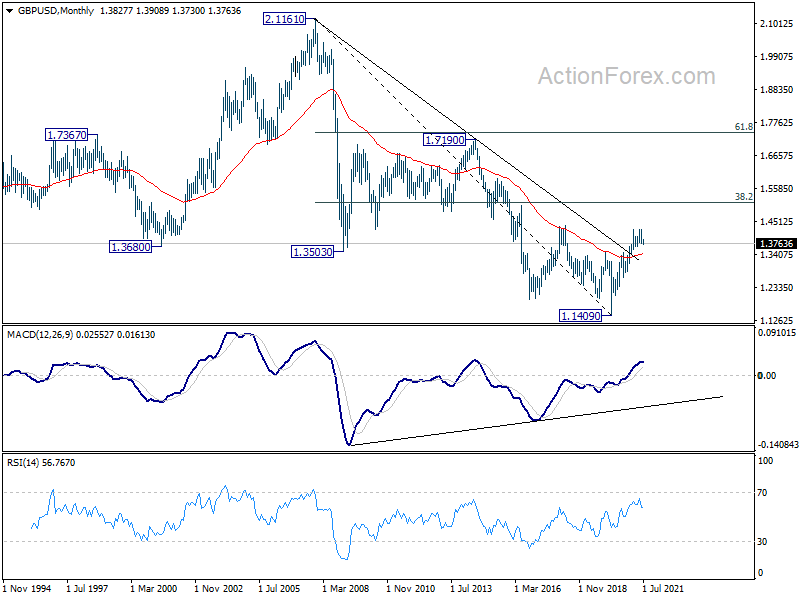
In the longer term picture, a long term bottom should be in place at 1.1409, on bullish convergence condition in monthly MACD. Rise from there would target 38.2% retracement of 2.1161 to 1.1409 at 1.5134. Reaction from there would reveal whether rise from 1.1409 is just a correction, or developing into a long term up trend.
USD/CHF Weekly Outlook
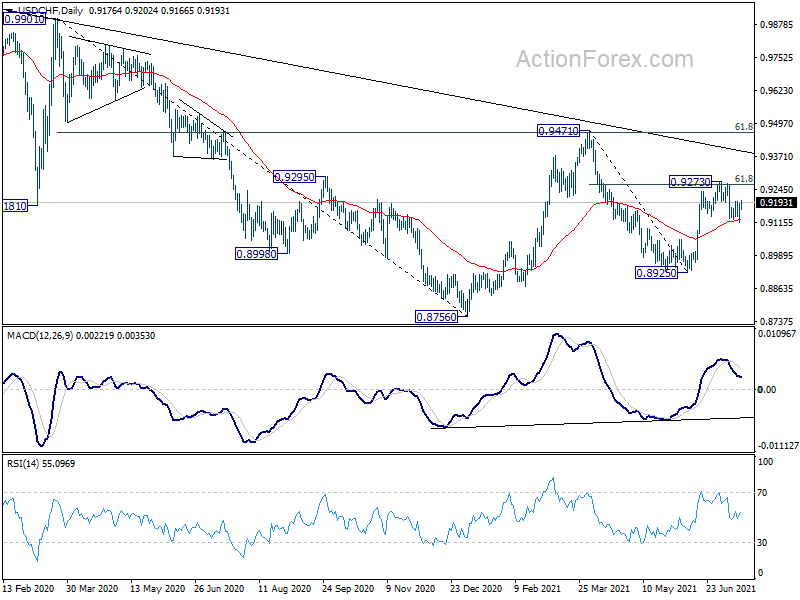
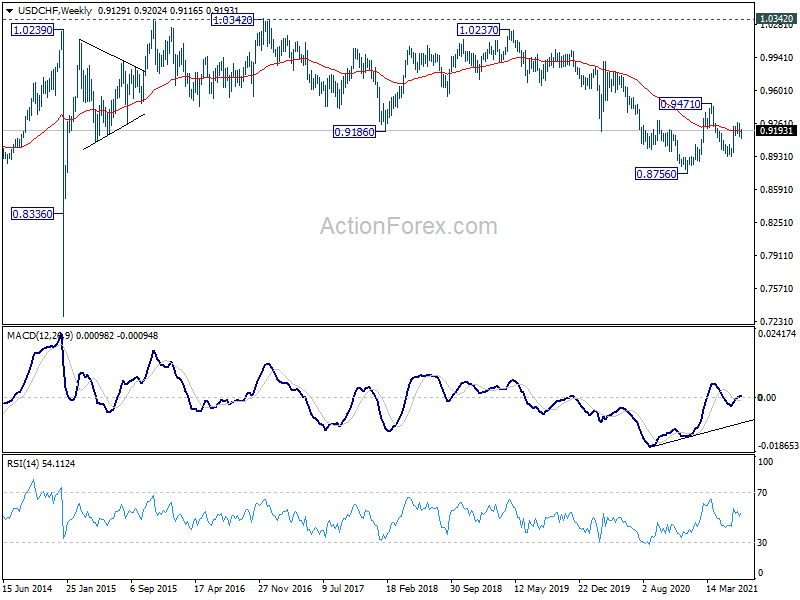
USD/CHF edged lower to 0.9116 last week but drew support from 55 day EMA (now at 0.9129) and recovered. Initial bias remains neutral this week first. On the downside, sustained break of the 55 day EMA will affirm the case that rebound from 0.8925 has completed at 0.9273. Deeper fall would then be seen back to retest 0.8925 low. On the upside, however, break of 0.9273 and sustained trading above 61.8% retracement of 0.9471 to 0.8925 at 0.9262 will target 0.9471 resistance next.
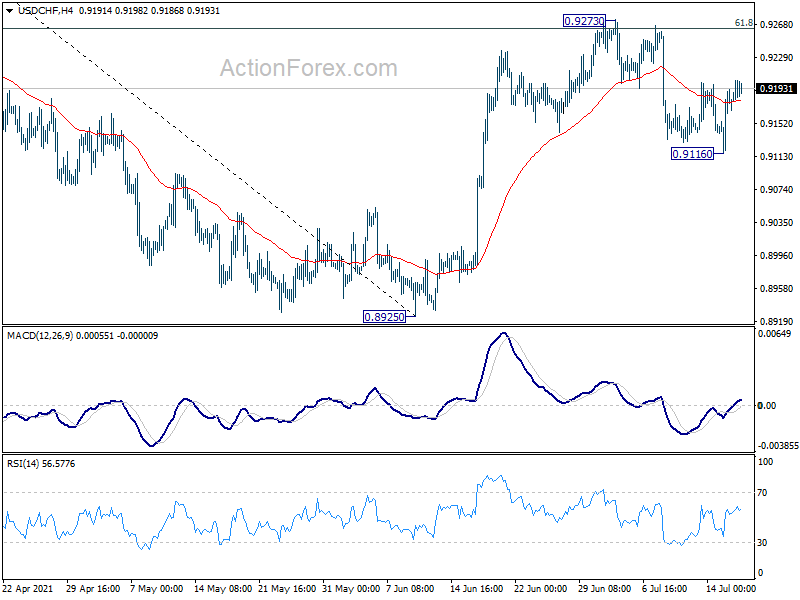
In the bigger picture, medium term outlook is currently neutral with focus on 0.9471 resistance. Sustained break there will indicate completion of whole decline from 1.0342 (2016 high). Medium term outlook will be turned bullish for a test on 1.0342 high. But, rejection by 0.9471 again will revive bearishness for another fall through 0.8756 low.
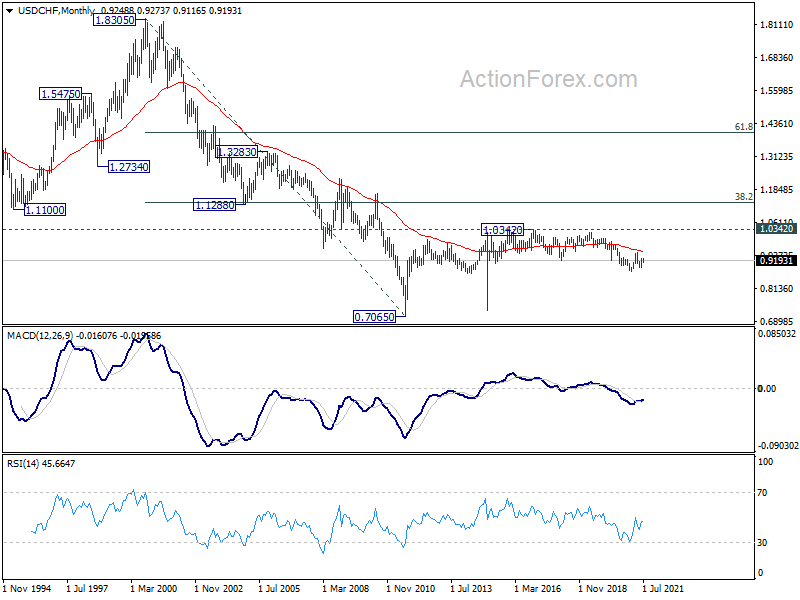
In the long term picture, price actions from 0.7065 (2011 low) are currently seen as developing into a long term corrective pattern, at least until a firm break of 1.0342 resistance.
AUD/USD Weekly Outlook
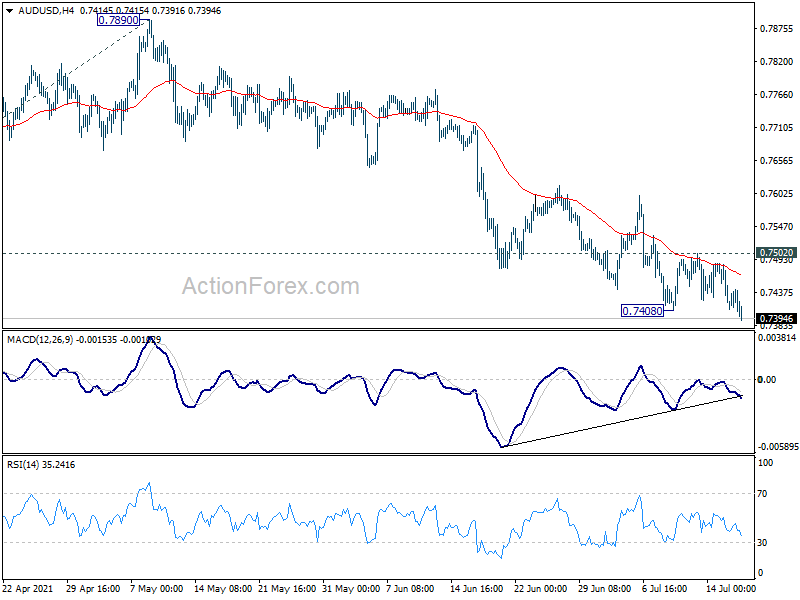
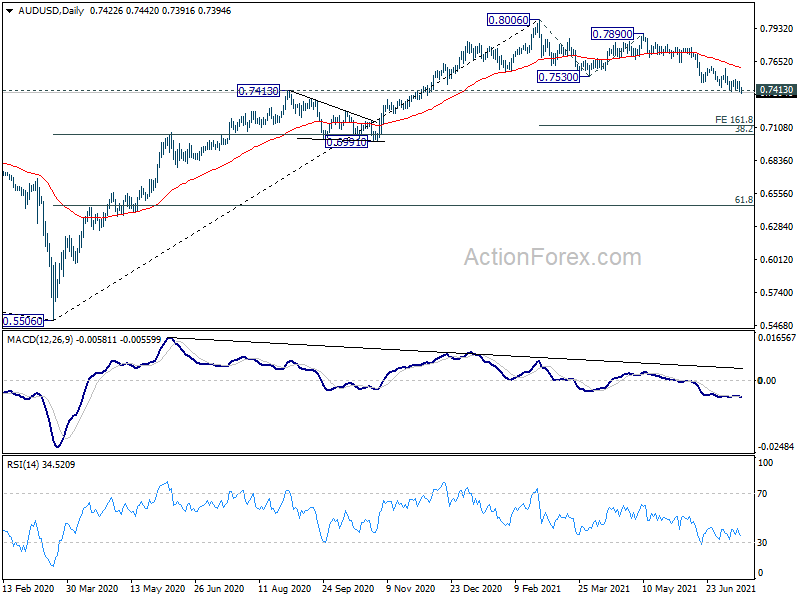
AUD/USD's decline from 0.7890 resumed by takin gout 0.7408 last week. Initial bias stays on the downside this week first. Such fall is now probably correcting whole up trend from 0.5506. Next target is 161.8% projection of 0.8006 to 0.7530 from 0.7890 at 0.7120 next. On the upside, break of 0.7502 resistance will turn intraday bias neutral and bring consolidations first.
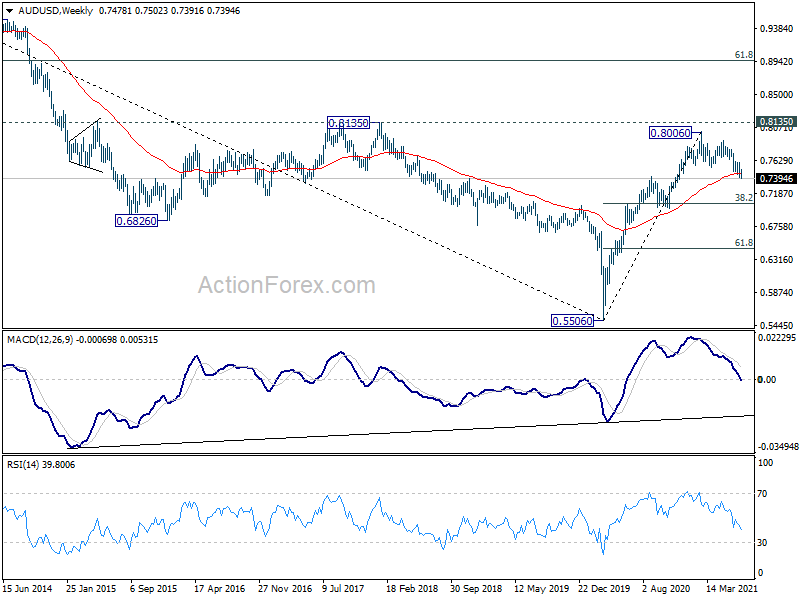
In the bigger picture, rise from 0.5506 medium term bottom could have completed at 0.8006, after failing 0.8135 key resistance. Correction from there could target 0.6991 cluster support (38.2% retracement of 0.5506 to 0.8006 at 0.7051). We'd look for strong support from there to bring rebound. However, sustained break of this level would argue that the whole medium term has indeed reversed.
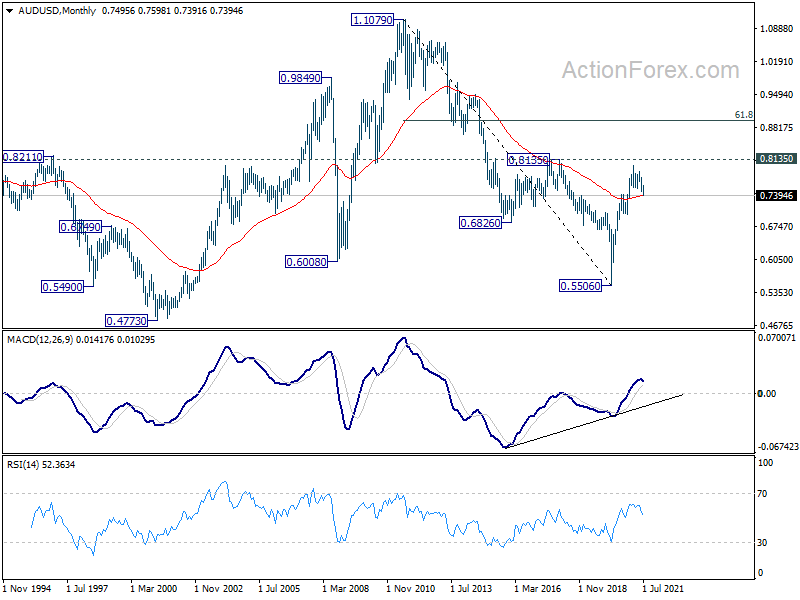
In the longer term picture, rise from 0.5506 could have completed at 0.8006. But subsequent fall is now seen as a correction only. As long as 0.6991 structural support holds, we'd expect another rise through 0.8006 at a later stage. However, sustained break of 0.6991 would argue that the trend has reversed and put 0.5506 low back into radar.
USD/CAD Weekly Outlook
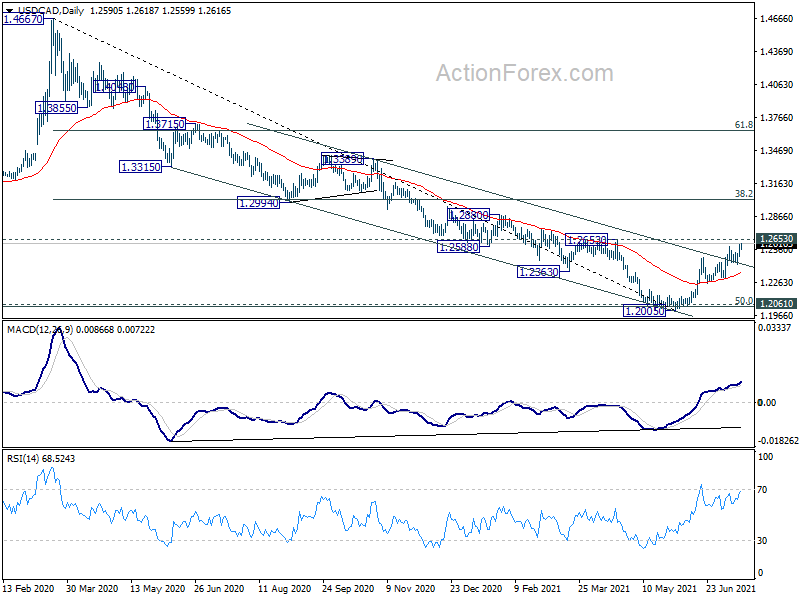
USD/CAD's rise from 1.2005 resumed last week and closed strongly at 1.2616. Initial bias stays on the upside this week for 1.2653 structure resistance. Sustained break there will confirm near term reversal. Stronger rise would then be seen to 1.3022 medium term fibonacci level next. On the downside, break of 1.2423 support is needed to indicate short term topping. Otherwise, outlook will remain bullish in case of retreat.
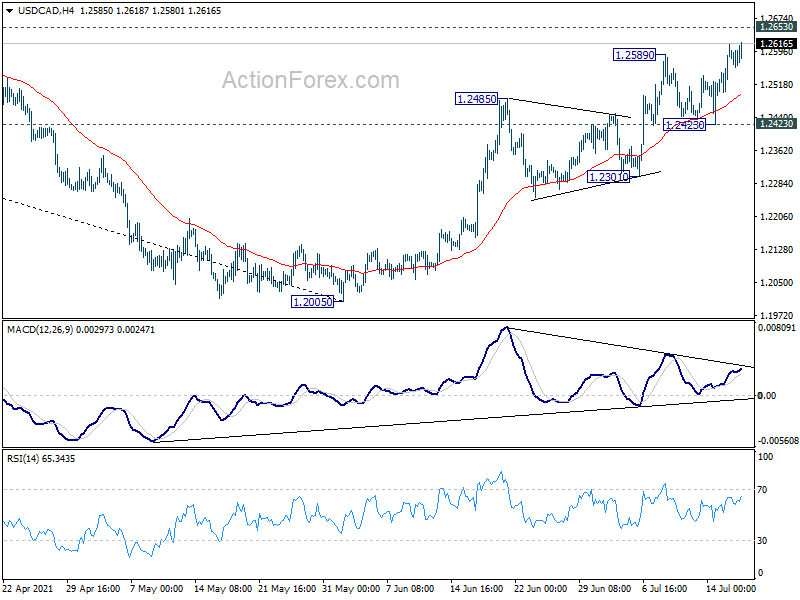
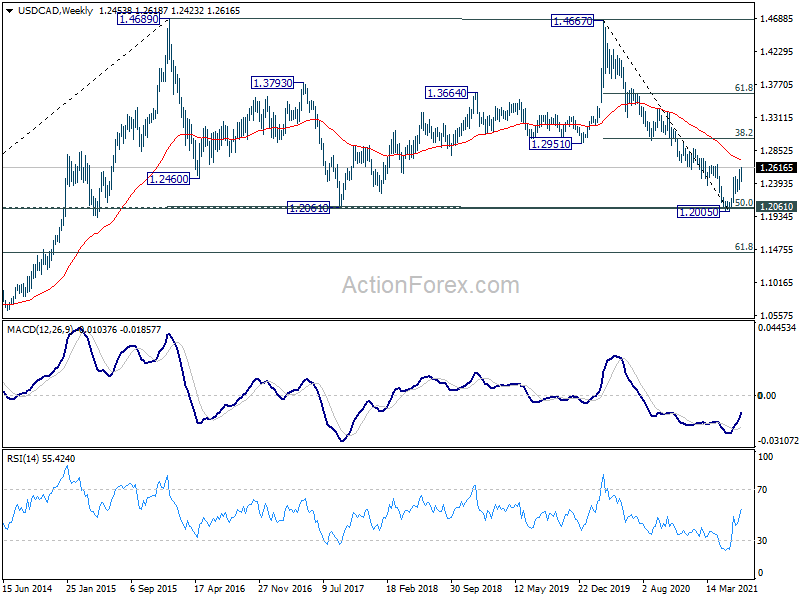
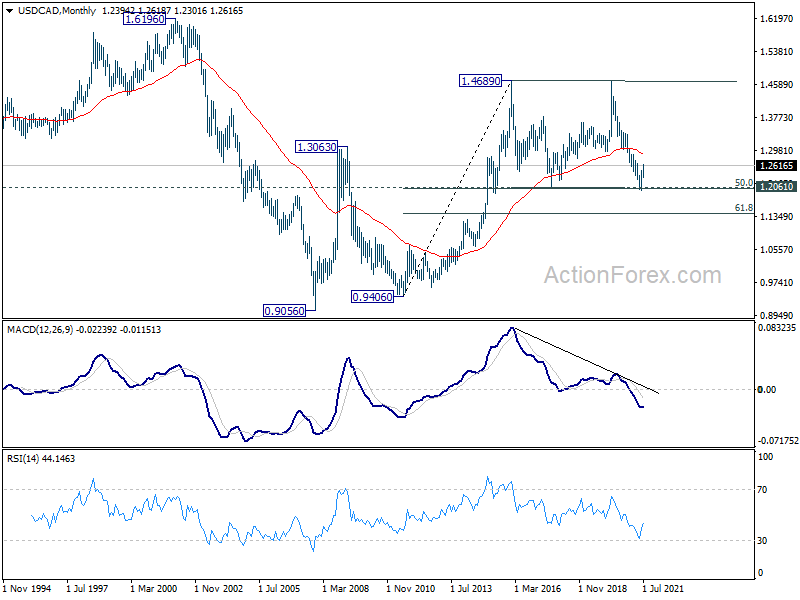
In the bigger picture, fall from 1.4667 is seen as the third leg of the corrective pattern from 1.4689 (2016 high). It might have completed after hitting 1.2061 (2017 low) and 50% retracement of 0.9406 to 1.4689 at 1.2048. Sustained break of 38.2% retracement of 1.4667 to 1.2005 at 1.3022 will pave the way to 61.8% retracement at 1.3650. Overall, medium term outlook remains neutral at worst with 1.2048/61 support zone intact.
In the longer term picture, we're viewing price actions from 1.4689 as a consolidation pattern. Thus, up trend from 0.9506 (2007 low) is still expected to resume at a later stage. This will remain the favored case as long as 1.2061 support holds, which is close to 50% retracement of 0.9406 to 1.4689 at 1.2048. However, sustained break of 1.2061 will be a sign of long term bearishness. Deeper fall would be seen to 61.8% retracement at 1.1424 and below.
GBP/JPY Weekly Outlook
GBP/JPY stayed in range above 150.64 last week and initial bias remains neutral this week first. Correction from 156.05 could extend through 150.64. But downside should be contained by 38.2% retracement of 136.96 to 156.05 at 148.75 to bring rebound. On the upside, break of 153.46 will turn bias back to the upside for 155.13/156.05 resistance zone.
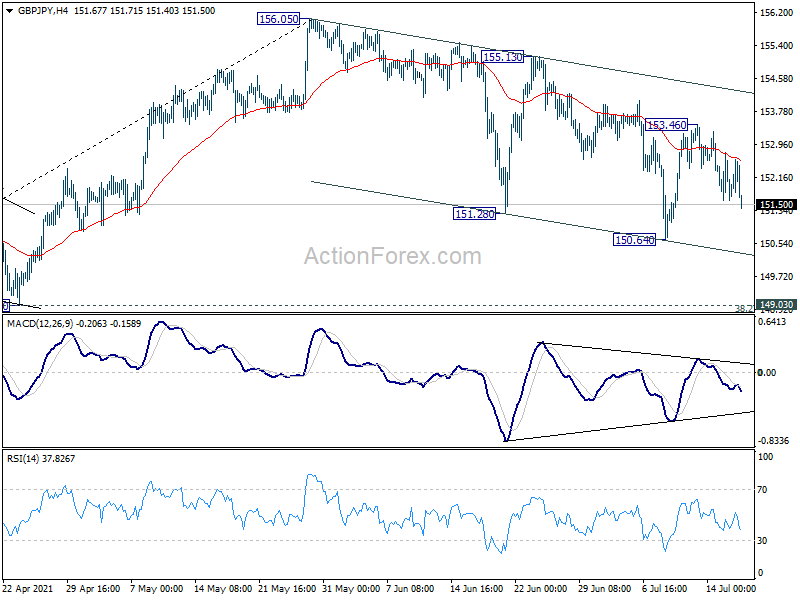
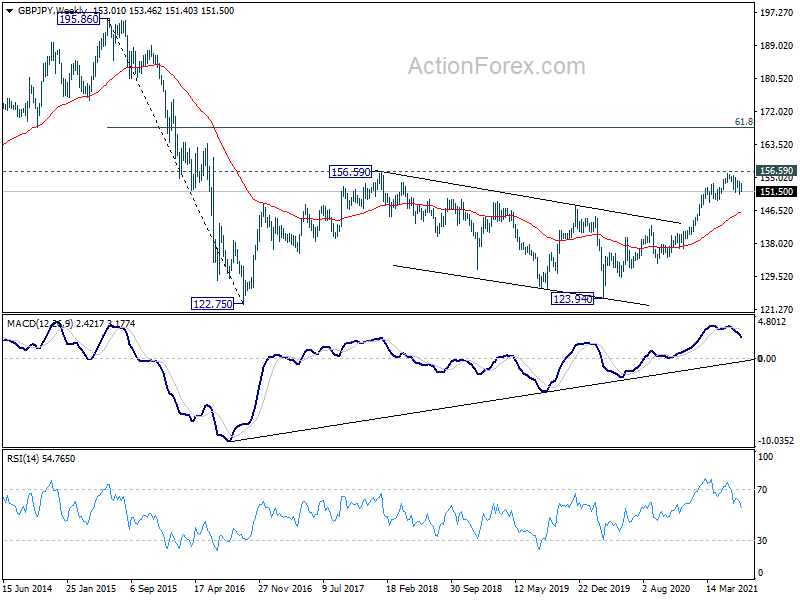
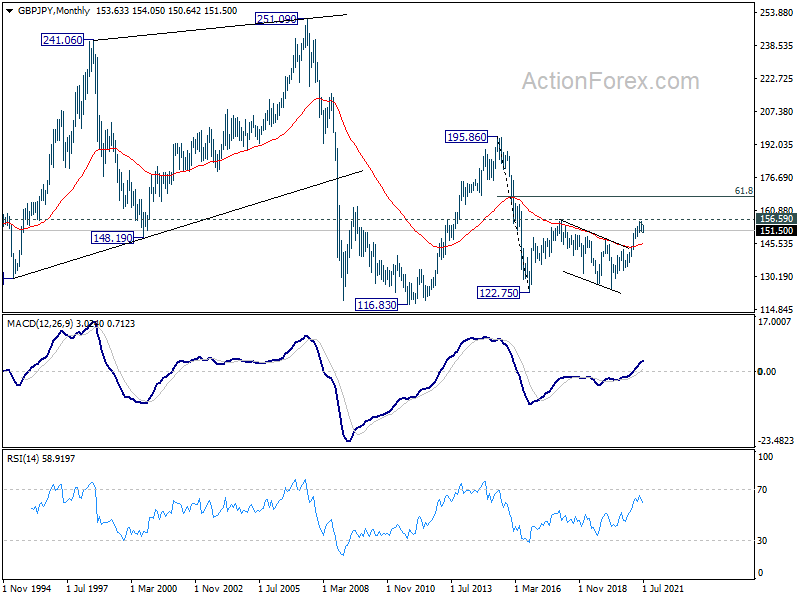
In the bigger picture, rise from 123.94 is seen as the third leg of the pattern from 122.75 (2016 low). Focus remains on 156.59 resistance (2018 high). Sustained break there should confirm long term bullish trend reversal. Next target is 61.8% retracement of 195.86 (2015 high) to 122.75 at 167.93. On the downside, break of 149.03 support is needed to be the first sign of completion of the rise from 123.94. Otherwise, outlook will remain bullish even in case of deep pull back.
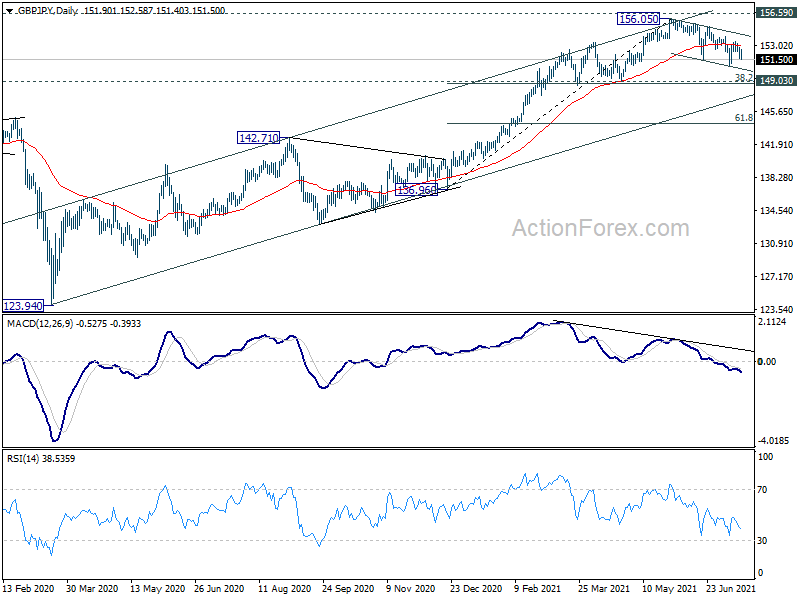
In the longer term picture, the strong break of 55 months EMA was an early sign of long term bullish reversal. Firm break of 156.69 resistance should now confirm the start of an up trend for 195.86 (2015 high).