Sample Category Title
Yen Jumps as Risk Appetite Slides
The Japanese yen has posted considerable gains in Monday trade. In the North American session, USD/JPY is trading at 109.50, down 0.47% on the day. Earlier in the day, the pair dropped as low as 109.05, its lowest level since May.
Yen shines as Covid fears spook markets
With the Delta Covid variant spreading ominously across the globe, investors are responding by fleeing to safety. The Japanese yen is a traditional safe-haven asset, and investors have been dumping risky assets such as the Australian dollar and snapping up yen. There are concerns that the Delta variant will have a sharp negative impact on global growth. This could accelerate the move away from risk and towards safe havens such as the yen.
In addition to the worsening Covid picture, tensions between the US and China have ratcheted higher, with telecom and cybersecurity issues being added to Hong Kong and human rights. If the rhetoric between the two giant economies gets harsher, risk appetite is likely to weaken even further.
The yen was slightly lower on Friday after the Bank of Japan revised lower its growth forecast for the current fiscal year to March. The BoJ quarterly report stated that the economy would grow 3.8%, down from the previous estimate of 4.0%. The bank attributed the downgrade to the “impact of Covid-19”. At the same time, the BoJ revised upwards its inflation forecast for the current fiscal year to March to 0.6%, up from 0.1%, due to rising energy prices.
The BoJ also announced details of a climate change fund (green fund), taking a page from the ECB and Bank of England, which have already made climate change part of their monetary policy strategy.
USD/JPY Technical
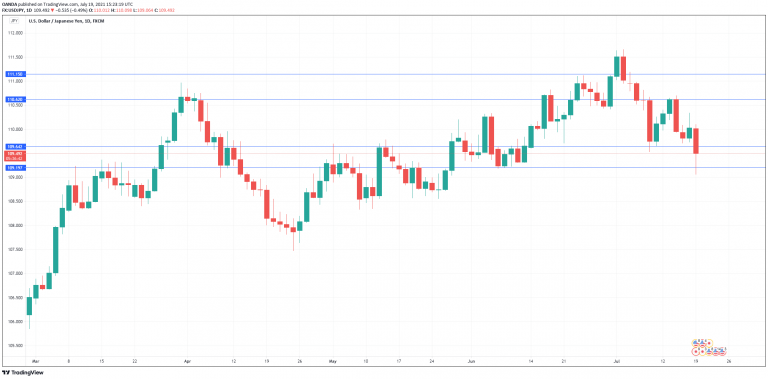
- USD/JPY faces resistance at 110.62 and 111.15
- On the downside, there is support at 109.64. Below, we find support at 109.19
WTI Oil Outlook: Oil Price Slumps after OPEC+ Agreed to Increase Production
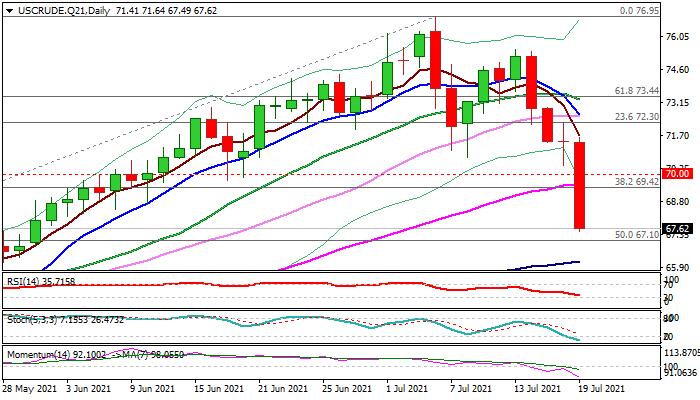
WTI oil price collapsed on Monday after OPEC+ group eventually reached an agreement to boost output from August and cool oil prices that rose to the highest levels in nearly seven years.
Strong bearish acceleration (the contract is on track for the biggest daily drop since Mar 23) sidelines bulls and opens way for deeper correction of larger uptrend from 2020 low at $6.52.
Analysts think that post-pandemic bull-cycle is at the end and suggest stronger drop in oil prices, as situation with coronavirus is worsening globally and boosting concerns about demand that prompted investors to collect profits. Fresh weakness generated bearish signal on surge through psychological $70 level and pivotal Fibo support at $69.42 (38.2% of $57.25/$76.95).
Bears cracked the top od ascending daily cloud ($68.20) which underpinned the action in past two months, with break through cloud (spanned between $68.20 and $64.67) to further fuel fresh downtrend.
Daily studies turned bearish and support the action, but oversold stochastic warns of headwinds bears may face.
Indicators on daily and 4-hr charts are still heading south and so far lacking any signal of correction, although some price positioning should be anticipated in coming sessions.
Broken supports at $69.42//$70.00 reverted to strong resistances which are expected to cap corrective upticks and keep fresh bears intact.
Res: 68.45; 69.42; 70.00; 70.75.
Sup: 67.49; 67.10; 66.15; 65.45.
Has the Canadian Dollar Already Reached its Peak for the Year?
The Insights
- In our view, yes. Recent developments suggest the six-year high of 83 US cents the loonie hit in early June was a high-water mark for 2021.
- The Bank of Canada was looking more hawkish than other central banks earlier this year. With the Federal Reserve now signaling it may raise rates sooner than previously expected, sentiment has shifted in favour of the US dollar and away from the loonie.
- The lift that the Canadian dollar got from rising prices from oil and other commodities may be running out of steam along with investor appetite for riskier assets.
The Stakes:
A spike in the loonie undercuts the competitiveness of Canada’s exports and encourages consumption of imports over domestic production. But households and businesses benefit from cheaper imports of consumer and capital goods. Overall, we believe strengthening global growth, particularly in the US, will support Canada’s export sector. Other economic headwinds—including labour shortages and supply-chain bottlenecks—are bigger concerns for exporters right now than the value of the Canadian dollar.
The Context
After tumbling early in the pandemic, the Canadian dollar went on its strongest run in more than a decade, rising to a six-year high of 83 US cents in early June. The run-up made it the best-performing advanced-economy currency through the first five months of 2021.
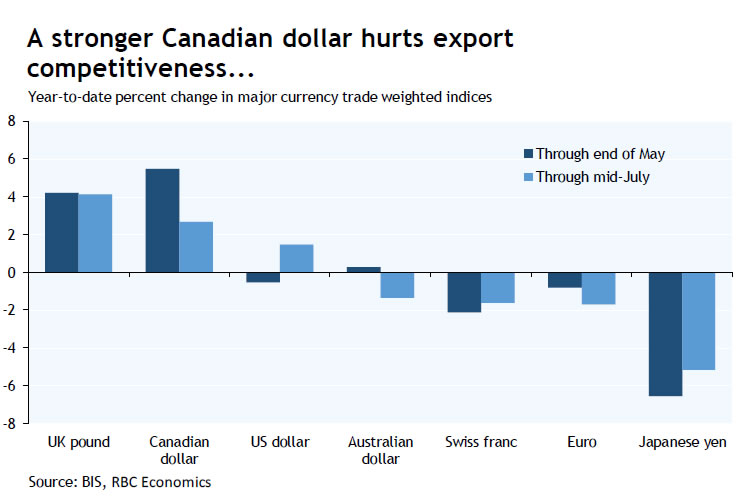
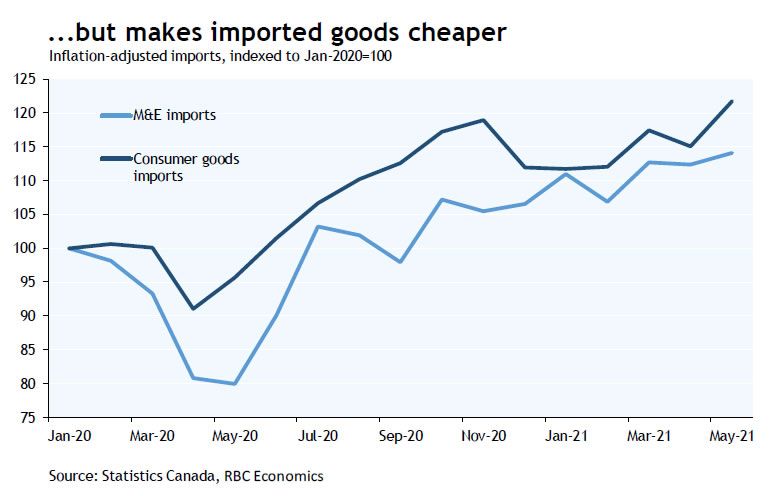
A stronger Canadian dollar helps business looking to invest by making imported machinery and equipment cheaper. Canada’s industrial M&E imports were 12% above pre-pandemic levels in May when adjusted for inflation. A stronger dollar also makes imports cheaper and has blunted the inflationary impact of rising input costs and higher goods prices. Prices of imported consumer goods (excluding autos) were down 3% year-over-year in May versus a 1% increase in the US. A stronger Canadian dollar is bad news for exporters, particularly those in manufacturing and services sectors that aren’t benefiting (and may be suffering) from higher commodity prices that have boosted the currency.
Over the past six weeks the Canadian dollar has reversed some of its earlier gains, falling below 80 US cents.
 Our Analysis
Some of the factors behind the loonie’s impressive run are now, conversely, contributing to its softening. A key one: commodity prices. WTI oil has risen from around US$40 per barrel in the second half of last year to more than US$70. Non-energy commodity prices were up 25% year-to-date in May. We expect oil prices to remain in their recent range into 2022, acting as neither a tailwind nor a headwind for the Canadian dollar. Meanwhile, some non-energy commodity prices have started to turn lower (lumber being one example), and could fall further as supply responds, and reopening-driven growth expectations top out.
Canada’s central bank still stands out as relatively hawkish (more likely to raise interest rates) but some of its peers are starting to catch up. The prospect of higher rates attracted investors to the Canadian dollar, but a change in tone from the Fed in June (it’s also evaluating a reduction in QE and indicated rates could rise in 2023, if not sooner) has supported the US dollar at the Canadian dollar’s expense. This process likely hasn’t fully played out—we think the market is overpricing rate hikes in Canada next year, and underestimating the odds of a move by the Fed. But more convergence will be Canadian dollar-negative.
Investor appetite for riskier assets—from equities to currencies like the Canadian dollar—remains robust. But concerns that this cycle’s best growth rates (for both GDP and corporate earnings) will soon be behind us could make further stock-market gains harder to come by. RBC’s US equity strategist sees the S&P 500 ending this year close to its current level. Waning risk appetite could put downward pressure on the Canadian dollar.
The Road Ahead
The Canadian dollar’s highs are likely in the rearview mirror. We see it remaining within range of the 80 US cent level over the second half of this year and weakening slightly in 2022. Upside (higher oil prices, a persistently dovish Fed) and downside risks (less investor risk appetite) remain, so a relatively flat forecast doesn’t exclude some volatility along the way.
At its current level Canadian exporters might think the Canadian dollar is still too high, but it’s within the range of estimates of fair value—and a long way from above-parity levels that a decade ago sparked fears of Dutch disease (collateral damage to manufacturing or other domestic industries from a high currency tied to a strong resources sector). Even with steady currency appreciation over much of the past year, Canada’s exports and imports were roughly balanced through the first five months of 2021.
We think strong foreign demand, particularly in the US, will more than offset any headwind from a higher Canadian dollar. Export Development Canada’s Trade Confidence Index hit a 20-year high in the second quarter on improving export sales and better global economic conditions. If anything, labour and input shortages are likely bigger headaches for Canadian exporters.
Canadian consumers are likely already taking advantage of a relative decline in US consumer goods prices through online shopping. International travel (Canadians normally spend more abroad than foreign visitors do in Canada) will also be a bit more attractive than it was pre-pandemic.
DOW breaks 55 day EMA, heading back to 33271 support
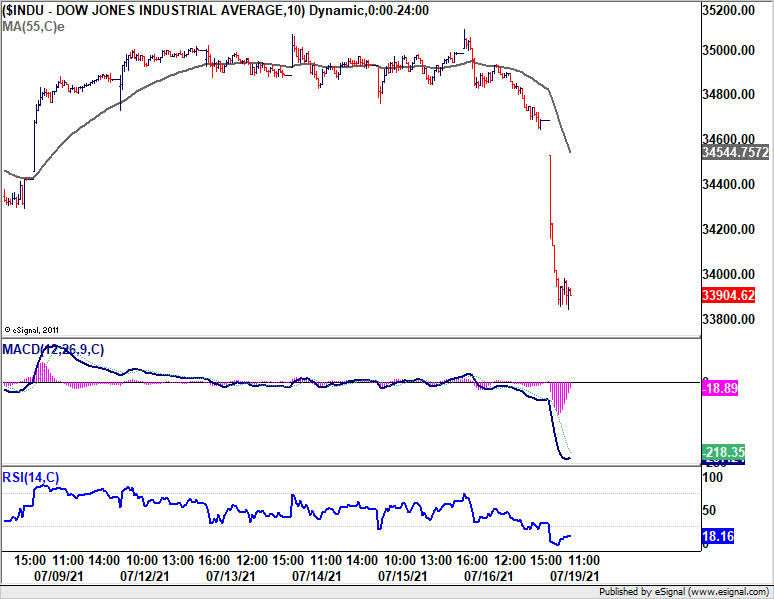
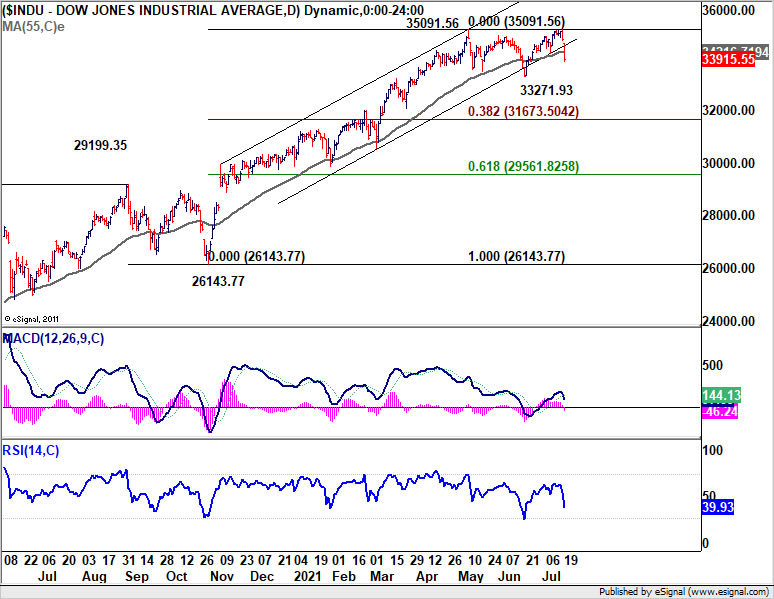
DOW's sharp fall in early trading pushed through 55 day EMA, as well as medium term channel support. The development firstly confirms rejection by 35091.56 high. Secondly, it suggests that corrective pattern from 35091 has started the third leg. Deeper decline would now be seen back to 33271.93 support. Reaction from there would be crucial in determining the medium term outlook.
Sustained break of 33271.93 would complete a double top reversal pattern. DOW would then be corrective the up trend from 26143.77 at least. Deeper fall would then be seen to 38.2% retracement of 26143.77 to 35091.56 at 31673.50. We'll see how DOW respond to 33271.93 support next.
Risk Appetite Disappears as Wall Street Passes Peak Everything
Covid jitters weighing on equity markets
Risk aversion is firmly in place as the Delta Covid variant spread is triggering a flight to safety as global economic concerns intensify. Global investors are growing anxious and selling stocks, commodities, and even cryptocurrencies to buy US Treasuries. With coronavirus surging across both advanced and developing nations, the bond market is delivering a one-way trade, lower global bond yields. Equities were ripe for a pullback given Wall Street was in agreement that this is ‘as good as it gets’ for peak earnings, economic growth, monetary stimulus, and shortly fiscal support. It is hard to hold risky assets over the short term now that we have past-peak everything.
US stocks pushed even lower after reports that the US and allies are blaming individuals tied to the Chinese government over the Microsoft Exchange hack. The laundry list of issues between the world’s two largest economies continues to grow and likely suggests we won’t see calm waters anytime soon. US-China tensions saw telecom and cybersecurity issues jumped ahead of both trade tariffs and living up to the phase-one trade deal. Human rights issues, China’s tech crackdown, and handling of Hong Kong are also contributing to US-China tensions. Panic selling of risky assets could happen if a back-and-forth of harsh tones becomes a recurring theme between the US and China.
Bitcoin
Bitcoin tumbled as Wall Street grows nervous, as the Delta variant impact to global growth for the rest of the year could lead to a massive stock market correction. Bitcoin is the ultimate risky asset right now and it could see intense selling pressure if Wall Street enters into panic selling mode.
Bitcoin’s fundamentals still remain intact for much higher prices later this year, but the short-term outlook looks dicey. If bitcoin falls below the USD 30,000 level, momentum selling could look for an easy test of the USD 28,900 level. That could be the line in the sand for defending a deeper plunge toward the USD 25,000 which at that point would lead to many sellers eyeing the psychological USD 30,000 level.
Oil
Crude prices declined after OPEC+ delivered a very much expected deal. The oil market wasn’t sure on exactly when OPEC+ would deliver a deal, but they weren’t too worried that they would let this market run excessively tight. Energy traders were unfazed by the OPEC+ decision to allow UAE and others have higher production quotas from May 2022. Despite more barrels coming to the market next month, nothing really can derail the short-term belief that prices are heading higher. The OPEC deal will allow for 400,000 bpd in increased output, a drop in the bucket given the robust demand that occurs despite the delta variant surge. The commodity rally isn’t over just yet, but it will probably take a big break here. WTI crude’s fundamentals still support another massive move higher, it will just take another month or so to shake off the growing risk aversion theme.
Travel and hotel stocks are getting crushed today as concerns grow that crude demand outlook might have overly priced in a normal summer abroad. Jet fuel demand will struggle as international travel is not happening anytime soon, especially given how several Americans are struggling to get their passports renewed even with expedited services. Even domestic travel to Hawaii is losing appeal given the limited availability for car rentals, lack of hospitality workers, and extreme price hikes for lodging and dining.
The oil market is still very tight even despite all the short-term Delta variant drivers and modest easing of oil output cuts, so WTI crude’s tumble will eventually attract buyers, possibly around the USD 65 region.
Gold has room to rise
Normally plummeting Treasury yields is great news for gold, but a broad selloff on Wall Street has some investors scrambling for cash. If the selloff accelerates on Wall Street, gold should eventually attract safe-haven flows. The bullish case for gold includes rising US deficits, an intensifying inflation debate, and economic uncertainty for many developing nations.
Gold caught a bid before the open after the EU real yields fell to a fresh record low. Global bond yields falling deeper into negative territory will lead to a fresh wave of flows into gold. Gold has massive resistance at the USD 1,835 level, but if that can be breached early this week, technical buying could easily support a rally towards USD 1,850 and potentially the USD 1,880 level.
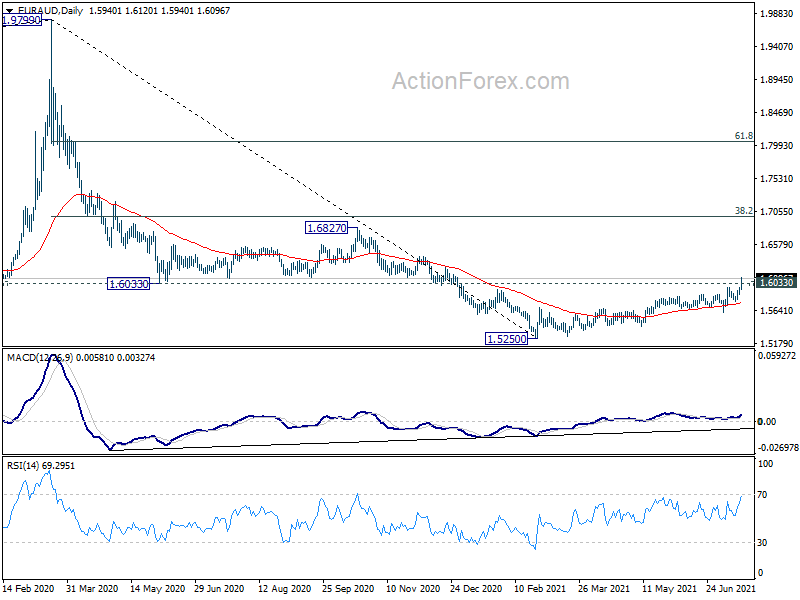
EUR/AUD Mid-Day Outlook
Daily Pivots: (S1) 1.5901; (P) 1.5935; (R1) 1.5997; More...
Intraday bias in EUR/AUD remains on the upside at this point. The strong break of 1.6003 resistance argues that rise from 1.5250 is at least correcting the whole fall from 1.9799. Further rise would be seen to 1.6827 resistance and then 1.6988 fibonacci level. On the downside, break of 1.5773 support is needed to indicate short term topping. Otherwise, outlook will remain bullish in case of retreat.
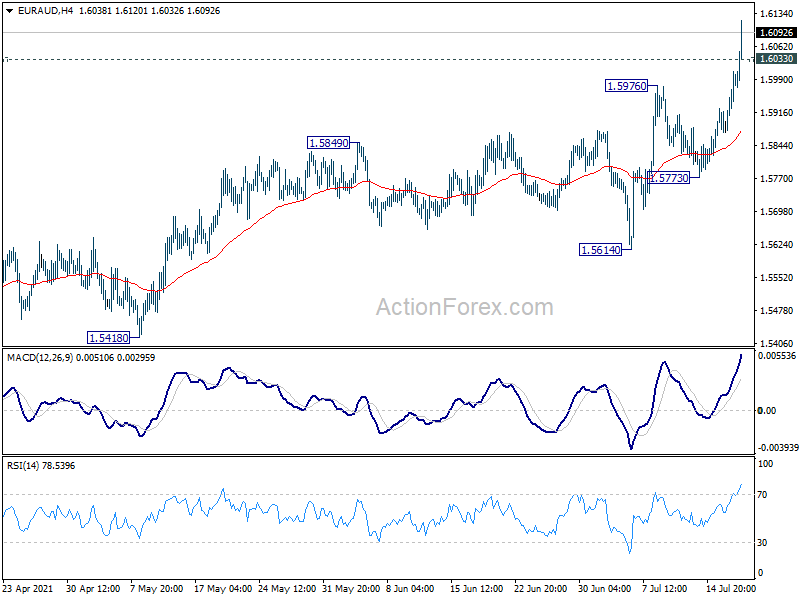
In the bigger picture, break of 1.6033 support turned resistance suggest that fall from 1.9799 has completed at 1.5250 already, on bullish convergence condition in daily MACD. Rise form 1.5250 could either be correcting or reversing the prior fall form 1.9799. In both case, further rally is now expected to 38.2% retracement of 1.9799 to 1.5250 at 1.6988. Reactions from there would reveal more about the underlying momentum.
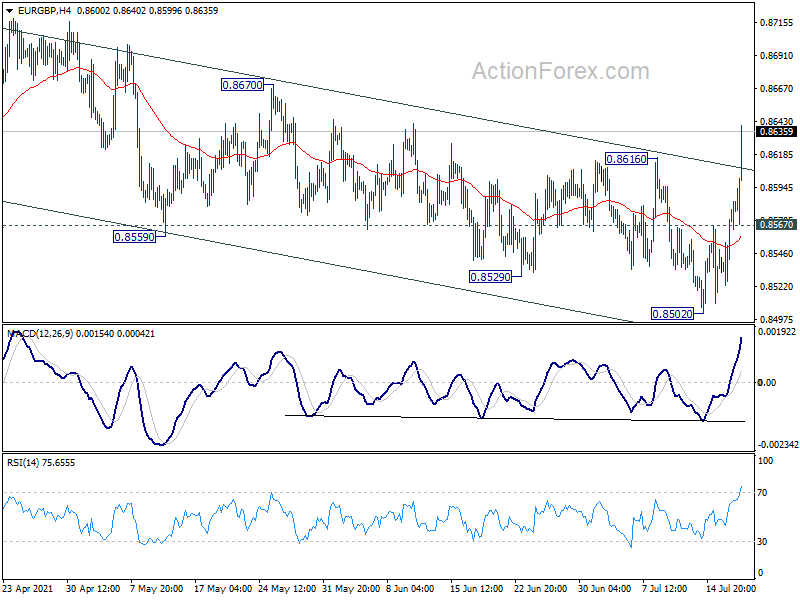
EUR/GBP Mid-Day Outlook
Daily Pivots: (S1) 0.8541; (P) 0.8560; (R1) 0.8597; More...
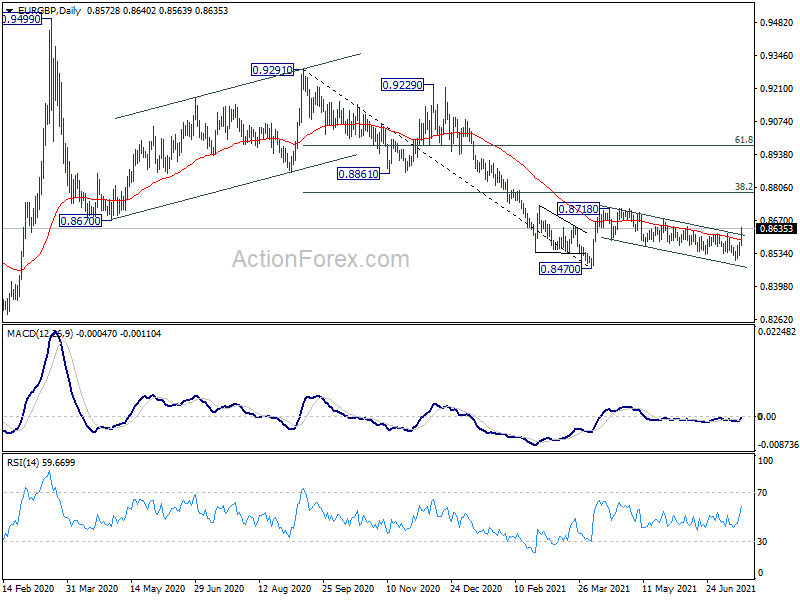
EUR/GBP's strong rise and break of 0.8616 resistance suggests that corrective fall from 0.8718 has completed at 0.8502 already. Intraday bias is back on the upside for 0.8670 resistance first. Break there will affirm the case that whole rebound from 0.8470 is resuming through 0.8718 resistance. On the downside, though, break of 0.8567 minor support will turn intraday bias neutral again first.
In the bigger picture, price actions from 0.9499 are still seen as developing into a corrective pattern. That is, up trend from 0.6935 (2015 low) would resume at a later stage. This will remain the favored case as long as 0.8276 support holds. However, firm break of 0.8276 support will suggest that rise from 0.6935 has completed and turn medium term outlook bearish.
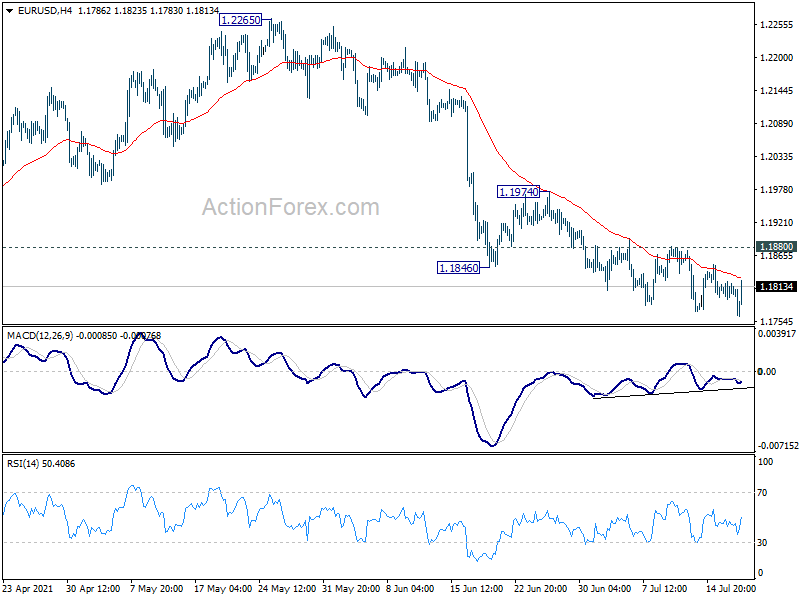
EUR/USD Mid-Day Outlook
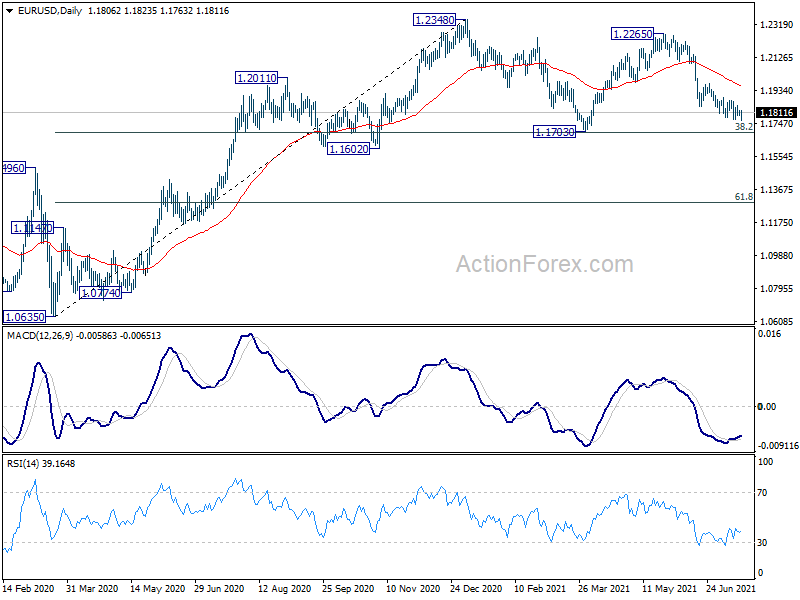
Daily Pivots: (S1) 1.1788; (P) 1.1820; (R1) 1.1843; More...
EUR/USD's fall resumes and intraday bias is mildly on the downside. Decline from 1.2265, as the third leg of correction from 1.2348, would target 1.1703 support. On the upside, though, break of 1.1880 will indicate short term bottoming and turn bias back to the upside for stronger rebound to 1.1974 resistance first.
In the bigger picture, rise from 1.0635 is seen as the third leg of the pattern from 1.0339 (2017 low). Further rally could be seen to cluster resistance at 1.2555 next, (38.2% retracement of 1.6039 to 1.0339 at 1.2516). This will remain the favored case as long as 1.1602 support holds. Reaction from 1.2555 should reveal underlying long term momentum in the pair. However sustained break of 1.1602 will argue that the rise from 1.0635 is over, and turn medium term outlook bearish again.
GBP/USD Mid-Day Outlook
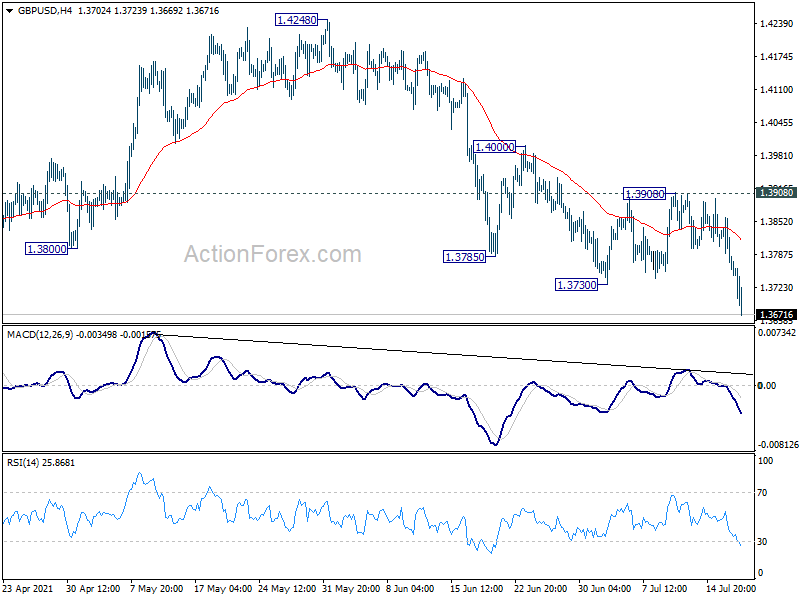
Daily Pivots: (S1) 1.3730; (P) 1.3796; (R1) 1.3831; More....
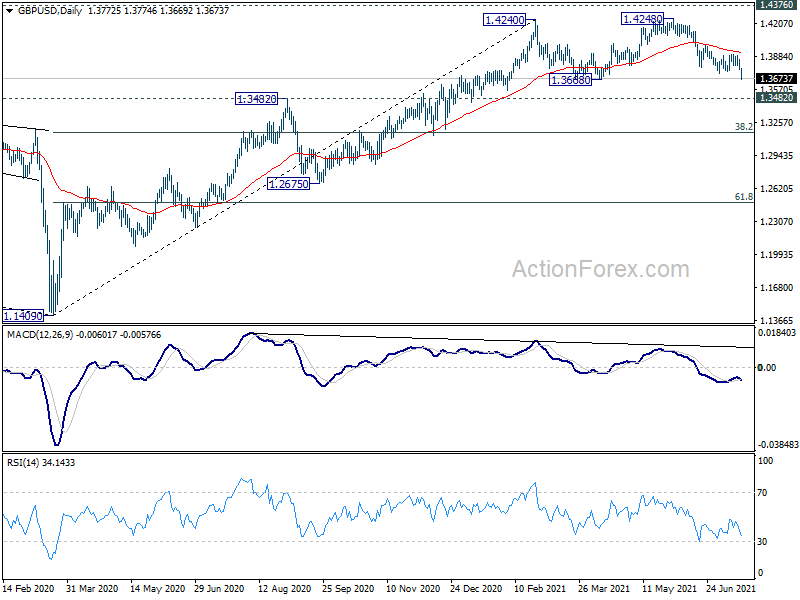
Intraday bias in GBP/USD remains on the downside at this point. Fall from 1.4248, as the third leg of the consolidation pattern from 1.4240, would target 1.3482 key support on break of 1.3668. On the upside, break of 1.3908 resistance is needed to indicate short term bottoming. Otherwise, risk will stay on the downside even in case of recovery.
In the bigger picture, as long as 1.3482 resistance turned support holds, up trend from 1.1409 should still continue. Decisive break of 1.4376 resistance will carry larger bullish implications and target 38.2% retracement of 2.1161 (2007 high) to 1.1409 (2020 low) at 1.5134. However, firm break of 1.3482 support will argue that the rise from 1.1409 has completed and bring deeper fall to 1.2675 support and below.
USD/CHF Mid-Day Outlook
Daily Pivots: (S1) 0.9177; (P) 0.9190; (R1) 0.9209; More....
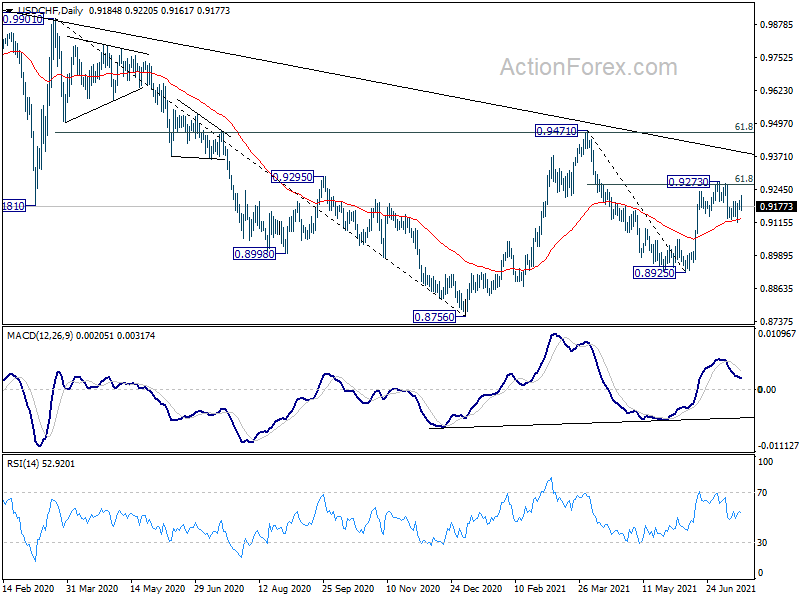
USD/CHF is still staying in established range of 0.9116/9273 and intraday bias remains neutral first. On the downside, sustained break of the 55 day EMA (now at 0.9131)will affirm the case that rebound from 0.8925 has completed at 0.9273. Deeper fall would then be seen back to retest 0.8925 low. On the upside, however, break of 0.9273 and sustained trading above 61.8% retracement of 0.9471 to 0.8925 at 0.9262 will target 0.9471 resistance next.
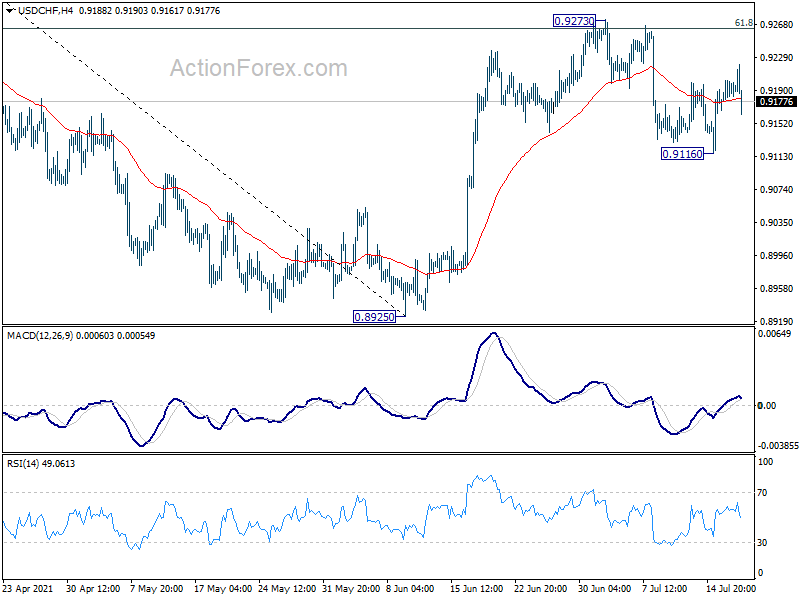
In the bigger picture, medium term outlook is currently neutral with focus on 0.9471 resistance. Sustained break there will indicate completion of whole decline from 1.0342 (2016 high). Medium term outlook will be turned bullish for a test on 1.0342 high. But, rejection by 0.9471 again will revive bearishness for another fall through 0.8756 low.