Sample Category Title
Daily Tecnical Analysis
EUR/USD
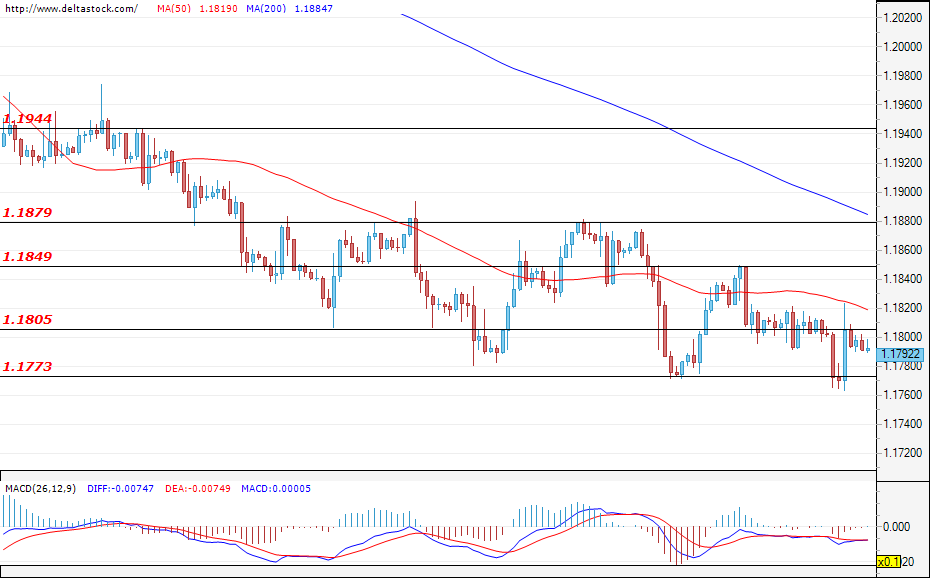
Current level - 1.1792
Yesterday’s decline was limited to the support zone at 1.1773 and, at the time of writing, the EUR/USD is still holding above the mentioned level. The pair is trading just under the resistance at 1.1805 and, if the bulls gain enough momentum and breach it, a correction towards the next target at 1.1849 might develop.. The current sentiment and expectations remain negative and, if the bears remain in control and manage to successfully violate the support at 1.1773, we will most likely witness new losses for the euro against the dollar and a deeper sell-off targeting the levels at 1.1717.
| Resistance | Support | ||
| intraday | intraweek | intraday | intraweek |
| 1.1805 | 1.1879 | 1.1770 | 1.1690 |
| 1.1849 | 1.1944 | 1.1717 | 1.1600 |
USD/JPY
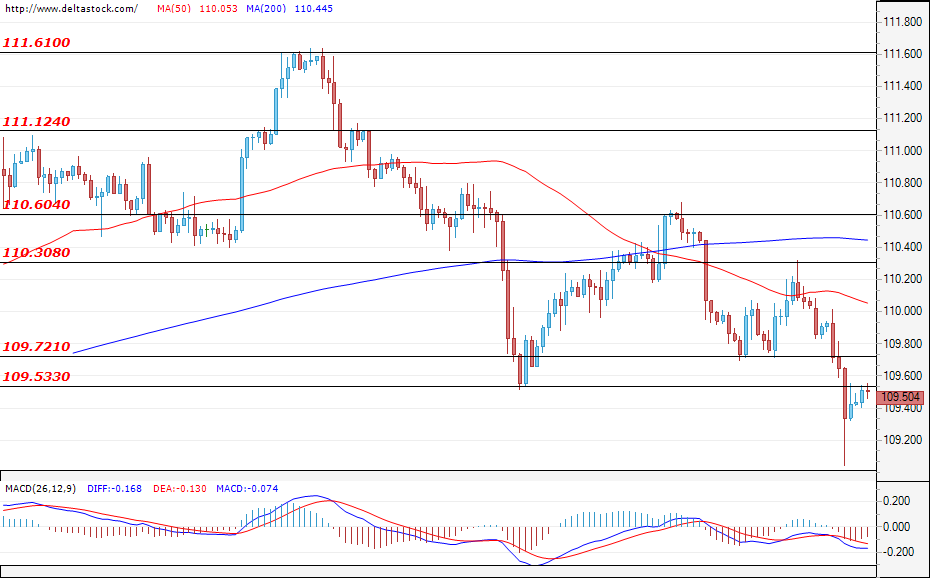
Current level - 109.50
The U.S. dollar continued to lose ground against the yen during yesterday’s session and the pair violated the support at 109.53. At the time of writing, the Ninja is confirming the mentioned breach and, if it is successful, the sell-off should continue forward with full steam, thus strengthening the negative expectations for the future path of the USD/JPY. The first target for the bulls can be found at the level of 109.72, but only a successful breach of the resistance at 110.60 could lead to а change in the current sentiment and help the greenback recover against the yen.
| Resistance | Support | ||
| intraday | intraweek | intraday | intraweek |
| 109.72 | 110.60 | 109.20 | 108.55 |
| 110.30 | 111.12 | 108.55 | 108.10 |
GBP/USD
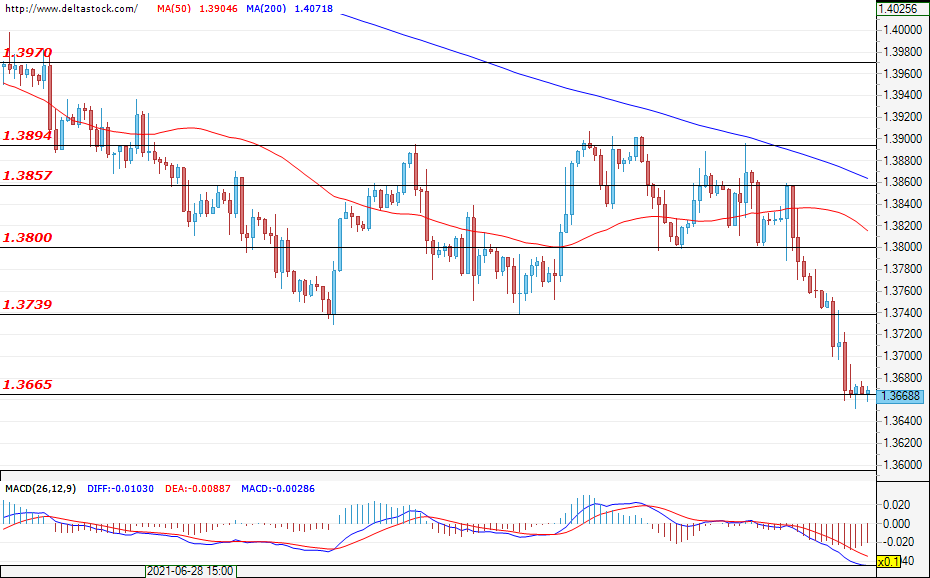
Current level - 1.3668
The test of the support level at 1.3739 was successful and the sterling lost quite a bit of ground against the dollar. During the early hours of today`s trading, the Cable is holding positions above the lower support zone at 1.3665 and, if the bearish attack continues, we will most likely see the mentioned support breached.. This would easily deepen the sell-off and push the Cable towards the February lows of 1.3600. The first target for the buyers is the level of 1.3739, which is now acting as a resistance, followed by the zone at 1.3800.
| Resistance | Support | ||
| intraday | intraweek | intraday | intraweek |
| 1.3739 | 1.3857 | 1.3670 | 1.3560 |
| 1.3800 | 1.3894 | 1.3610 | 1.3450 |
Will Brent Stand Or Sink To $60?
On Monday, Brent fell more than 7% to $67.4 per barrel. The selloff took place on higher volumes and showed a frightening amplitude during the NY session. On Tuesday morning, the price consolidates near $68.3, showing no apparent signs of a rebound.
Right now, Brent is balancing at the 76.5% retracement line of the November-to-July rally, finding support at the first Fibonacci level. If the pressure on these levels does not ease in the coming hours, the way for a rapid decline to $60-61 will open. This area consolidates several technical levels, including the 200-day moving average, the March support and the 61.8% retracement.
During the latter stages of the recent uptrend, it was getting more challenging for Brent to reach new highs. In July, we saw a "sell the high" pattern. All that despite a favourable macroeconomic backdrop that kept the sellers in check. A combination of two significant factors triggered a severe selloff at the start of the week.
OPEC+ sparked increased volatility with their agreement of 400K BPD monthly increase in quotas and higher base production levels for five countries. Due to such a case the chances of oil shortages in the coming quarters have fallen sharply.
The cartel's decisions are quite clear. For a long time, its members could afford not to rush to increase production, quietly watching the price rise and inventories shrink, as supply in the USA remained relatively stable. This has changed in recent weeks, and we have seen its systematic increase, putting the battle for market share back on the agenda.
Another factor that has intensified the strain on oil is the corrective sentiment in global stocks. These are caused, among other things, by concerns about the economic impact of rising contagion, even in countries with a high proportion of vaccinated people.
Technically, the bulls' capitulation has been fuelled by a fall below the 50-day moving average, below which oil has not traded since November 2020, i.e. the entire period of the previous rally.
The depth of the correction depends on many factors. In short term is worth paying attention to the dynamics of assets near the following essential levels. Brent's move under $67 would open the way to a drop to $60-61 soon. If there is sufficient demand at current levels, we can expect a quick recovery of interest and consolidation.
Global Inflections Due To The More Aggressive Delta COVID-19 Variant
Markets
A summer Monday. No important data and few central speakers (Fed members are in the blackout period ahead of next week’s FOMC meeting). Normally one would expect this to translate into an uninspiring start, with investors marking time going into Thursday’s ECB meeting. Yesterday’s market logic turned out different. The absence of news only encouraged investors to further adapt positing to growing growth concerns. A rebound in global inflections due to the more aggressive Delta Covid variant worked as the catalyst for resurgent doubts on growth. In a secondary order, investors also turn more uncertain whether the recent uptick in inflation still can be seen as a harbinger of current (and future) growth whether, via different channels, could become an obstacle. This mix of uncertainties only accelerated an ever more disorderly unwinding of the reflation trade. Bond markets again took the lead. The US yield curve again aggressively flattened with yields declining between -0. 6 bp (-2y) and 10 bp (10 and 30-y) yields). The US 10-y yield dropped below 1.20%. The 30-y came close to the 1.80% mark. Interestingly, the decline this time was mainly driven by inflation expectations. The decline in 10-y real yields is more modest (-2.75bp, to -1.08%). The similar narrative for the German yield curve with yields easing between 0.7bp (2-y) and 4.4bp(30-y yield). The risk-off sentiment outweighed the decline in core yields as a driver for intra-EMU spreads. 10-y spreads versus Germany widened up to 4 bp (Italy and Greece). The ‘reversal’ in the inflation narrative was illustrated by a free fall in the oil price in the wake of the OPEC+ agreement reached this weekend. Brent oil tumbled dropped from $73+ p/b to $68.62 p/b. Industrial commodities like copper also met strong headwinds even as the picture remains more benign compared to oil. Easing inflation expectations and ‘strange’ intraday gyrations of the dollar prevented gold to profit from this risk-off. European equities lost between 2.50% and 3.3%. US equities also with losses between 1.06% (Nasdaq) and 2.09% (Dow, cyclical), but off the intraday lows. On FX markets, the yen fully played its safe-haven role with USD/JPY closed at 109.45 (start near 110). The order between the dollar and the euro was less clear. EUR/USD dropped near 1.1765 but faced a remarkable (temporary?) short squeeze leaving EUR/USD little changed at 1.18 at the close. Smaller currencies, in general, were under heavy pressure, with commodity-related currencies hit hard (CAD, NOK). Uncertainty on consequences of the UK corona strategy (broad-based reopening) also hurt sterling with EUR/GBP close north of 0.86.
Today’s calendar is again almost empty. Avoiding catching a falling knife remains a key rule in markets. Still, the risk-off in Asia this morning seems a bit less aggressive than was the case yesterday in Europe or the US. Looking out for some calm to return we keep a closer eye on the development of the real yield. A bottoming, combined with inflation expectations that have become less aggressive too, might lay the groundwork for some less forceful repositioning. On the (technical) charts, we look out whether the levels of 1.20% (10-y US) and -0.43% (10-y Bund) might provide some support. A (still hypothetic) easing of global tensions, in theory, might also cap USD gains (ex USD/JPY). Even so, this morning’s trading pattern in EUR/USD still shows a fragile picture with intermediate support (1.1764) ahead of the key 1.1704 still nearby.
News headlines
The delta variant tightens its grip on Australia. The state of South Australia will enter a week-long lockdown today to halt an outbreak of the virus. It joins Victoria, which extended its 5-day snap lockdown with another 7 days to July 27, and Australia’s most populous state New South Wales that’s been closed for five weeks now. Australia and its economy remain vulnerable to any resurgence of the virus because it is lagging peers dramatically in terms of vaccination progress. The RBA announced it would taper bond-buying in early September because of the faster-than-expected recovery. However, in its meeting minutes, the central bank sounded more balanced, saying it could raise or lower weekly bond purchases. Markets in any case are starting to doubt the planned step towards normalization. The Aussie dollar dipped below AUD/USD 0.74 yesterday and is extending losses today. The 10y yield has declined more than 10 bps in the past two days.
EUR/USD Daily Outlook
Daily Pivots: (S1) 1.1768; (P) 1.1796; (R1) 1.1828; More...
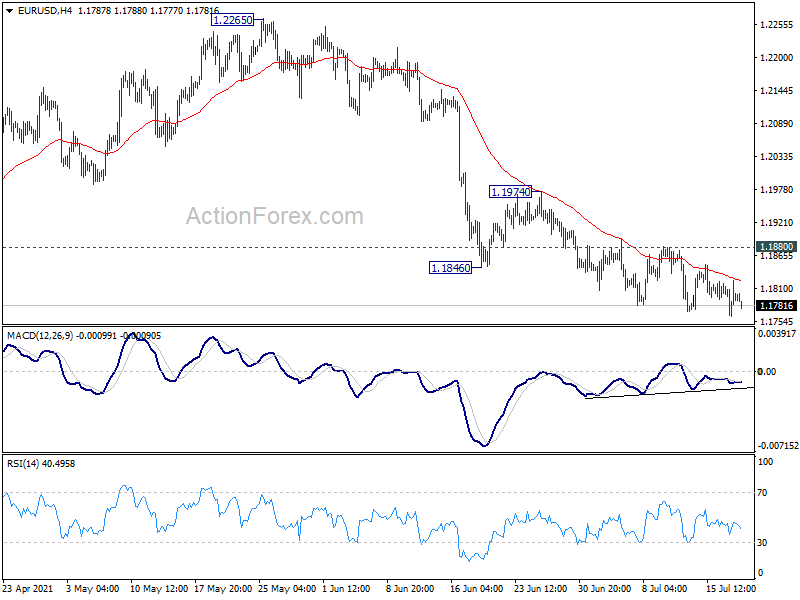
Intraday bias in EUR/USD stays mildly on the downside at this point. Decline from 1.2265, as the third leg of correction from 1.2348, would target 1.1703 support. On the upside, though, break of 1.1880 will indicate short term bottoming and turn bias back to the upside for stronger rebound to 1.1974 resistance first.
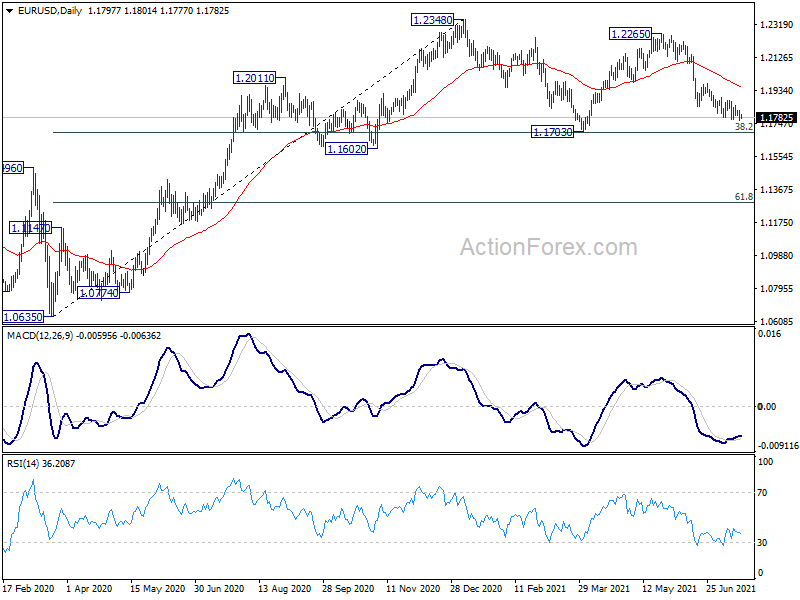
In the bigger picture, rise from 1.0635 is seen as the third leg of the pattern from 1.0339 (2017 low). Further rally could be seen to cluster resistance at 1.2555 next, (38.2% retracement of 1.6039 to 1.0339 at 1.2516). This will remain the favored case as long as 1.1602 support holds. Reaction from 1.2555 should reveal underlying long term momentum in the pair. However sustained break of 1.1602 will argue that the rise from 1.0635 is over, and turn medium term outlook bearish again.
GBP/USD Daily Outlook
Daily Pivots: (S1) 1.3628; (P) 1.3703; (R1) 1.3752; More....
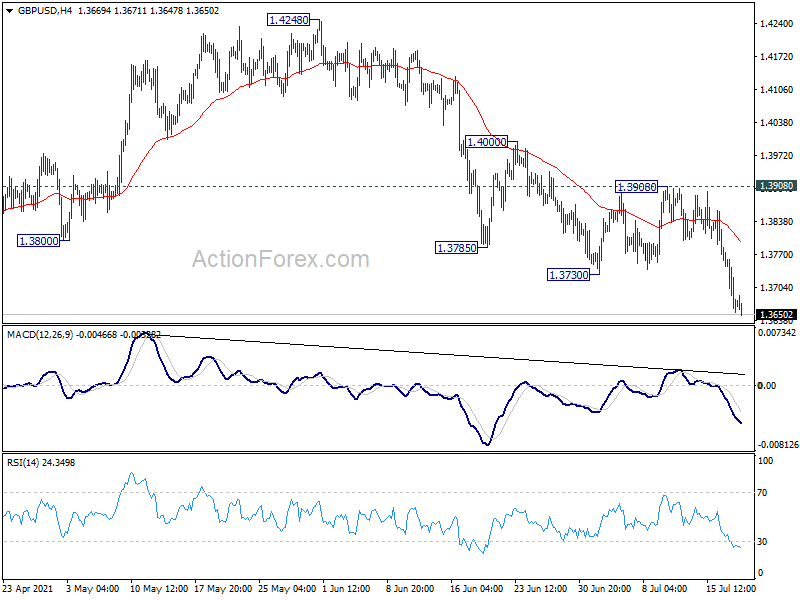
Outlook in GBP/USD remains unchanged as intraday bias stays on the downside. Fall from 1.4248, as the third leg of the consolidation pattern from 1.4240, would target 1.3482 key support. On the upside, break of 1.3908 resistance is needed to indicate short term bottoming. Otherwise, risk will stay on the downside even in case of recovery.
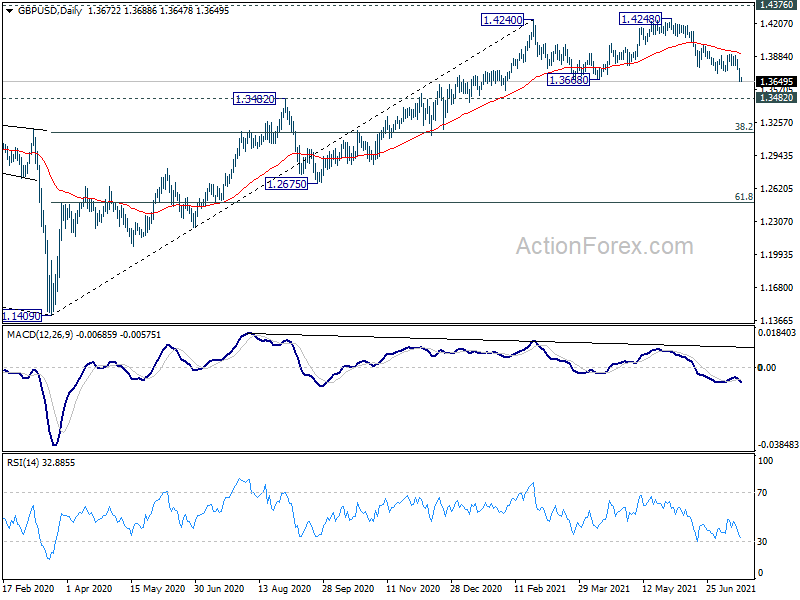
In the bigger picture, as long as 1.3482 resistance turned support holds, up trend from 1.1409 should still continue. Decisive break of 1.4376 resistance will carry larger bullish implications and target 38.2% retracement of 2.1161 (2007 high) to 1.1409 (2020 low) at 1.5134. However, firm break of 1.3482 support will argue that the rise from 1.1409 has completed and bring deeper fall to 1.2675 support and below.
USD/CHF Daily Outlook
Daily Pivots: (S1) 0.9177; (P) 0.9190; (R1) 0.9209; More....
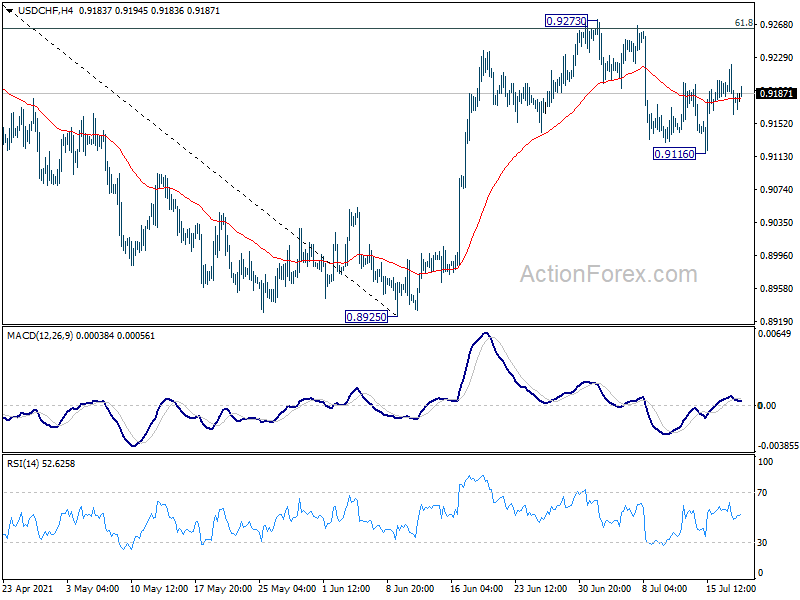
Intraday bias in USD/CHF remains neutral as range trading continues. On the downside, sustained break of the 55 day EMA (now at 0.9131)will affirm the case that rebound from 0.8925 has completed at 0.9273. Deeper fall would then be seen back to retest 0.8925 low. On the upside, however, break of 0.9273 and sustained trading above 61.8% retracement of 0.9471 to 0.8925 at 0.9262 will target 0.9471 resistance next.
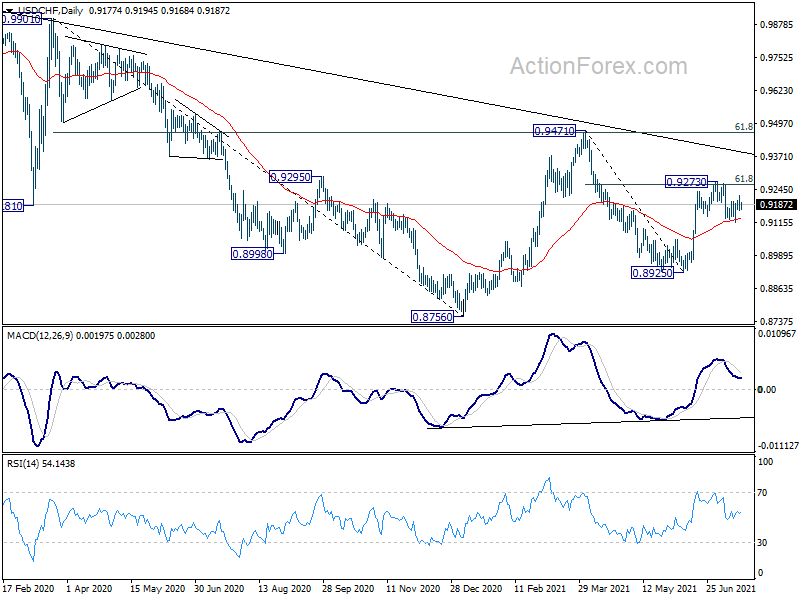
In the bigger picture, medium term outlook is currently neutral with focus on 0.9471 resistance. Sustained break there will indicate completion of whole decline from 1.0342 (2016 high). Medium term outlook will be turned bullish for a test on 1.0342 high. But, rejection by 0.9471 again will revive bearishness for another fall through 0.8756 low.
USD/JPY Daily Outlook
Daily Pivots: (S1) 108.99; (P) 109.54; (R1) 110.02; More...
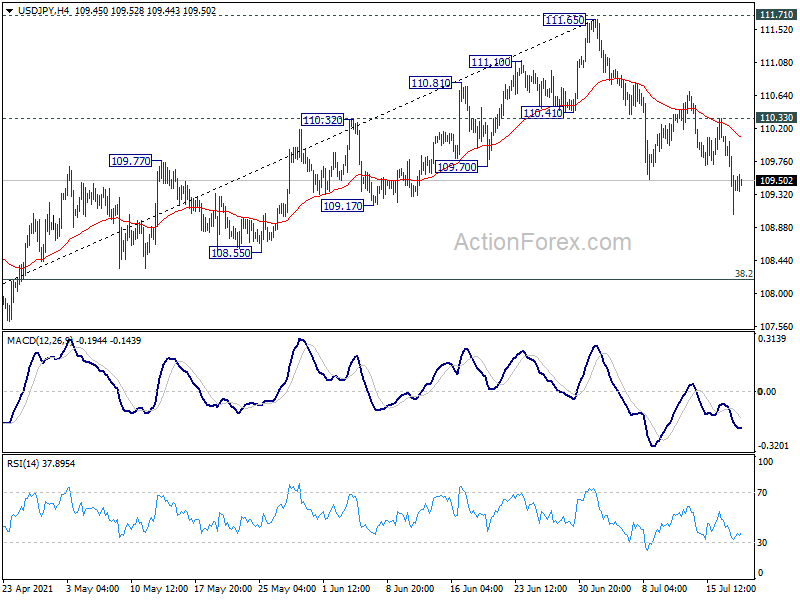
Intraday bias in USD/JPY remains on the downside at this point. Fall from 111.65 is at least correcting the whole rise from 102.58. Deeper decline should be seen to 38.2% retracement of 102.58 to 111.65 at 108.18 next. On the upside, break of 110.33 resistance is needed to indicate short term topping. Otherwise, outlook will stay bearish.
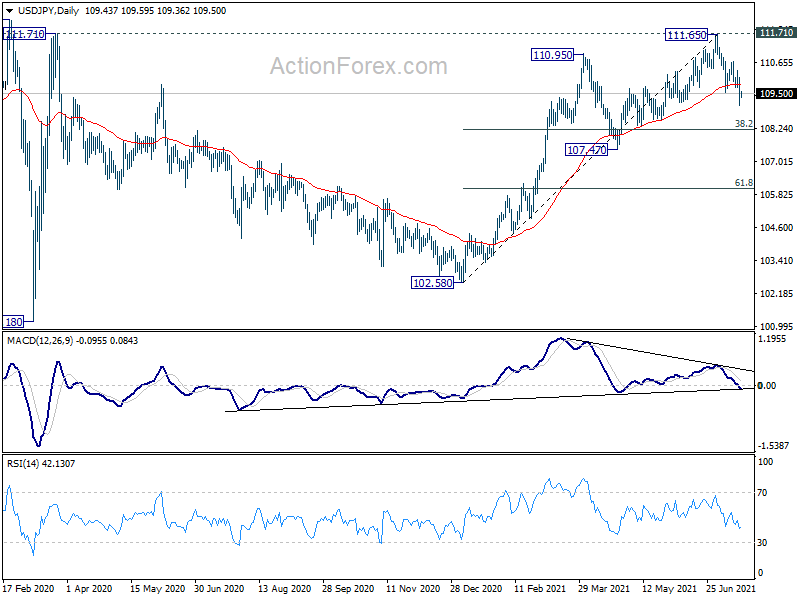
In the bigger picture, medium term outlook is staying neutral with 111.71 resistance intact. Sustained trading below 55 day EMA would argue that the pattern from 101.18 is starting another falling leg, that could head back to 102.58 support and below. For now, outlook won't turn bullish as long as 111.71 resistance holds, even in case of strong rebound.
Asian Markets See Modest Losses After Declines On Wall Street
General trend
- Asian gov’t bond yields generally track Monday’s decline in UST yields.
- Commodity currencies (AUD, NZD) extend declines.
- US equity FUTs have remained higher in Asia, currently off of the best levels; Apple said to delay office return.
- Asian equity markets opened modestly lower, in general.
- Nikkei 225 has remained lower [Topix Banks index drops after declines in US financials; Canon rises on guidance].
- Shanghai Composite ended morning trading lower by 0.5% [Decliners include Bank, Property and Consumer Discretionary indices].
- Hang Seng has extended declines [Property names trade generally weaker amid focus on Evergrande; Financials also decline].
- S&P ASX 200 has pared decline after dropping over 1% [Resources index has pared decline amid production update from BHP; Financials have also trimmed losses].
- Companies due to report during the NY morning include Ally Financial, Halliburton, HCA, Manpower, Omnicom, Synovus Financial, Travelers.
Headlines/Economic data
Australia/New Zealand
- ASX 200 opened 0.0%.
- OSH.AU Recently received a confidential non-binding and indicative change of control proposal and rejected it.
- BHP.AU Reports Q4 Waio Iron Ore Production: 72.8Mt v 75.6Mt y/y, Attributable Iron Ore Production: 65.2Mt v 66.7Mt y/y.
- JBH.AU Reports Prelim FY21 (A$) EBIT 743.2M v 483.2M y/y, Rev 8.9B v 7.9B y/y.
- OSH.AU Santos confirms all share merger proposal of A$4.25/shr.
- (AU) Reserve Bank of Australia (RBA): Excess cash at exchange settlement (ES) accounts at A$337.4B v A$335.7B prior (record high).
- (AU) South Australia to go into lockdown from today 18:00 for the next 7 days - local press.
- (AU) RESERVE BANK OF AUSTRALIA (RBA) JULY MEETING MINUTES: Reiterates central scenario remained one where wages growth and underlying inflation were expected to increase only gradually over the subsequent 2 years, need to have flexibility to adjust weekly bond purchases.
Japan
- Nikkei 225 opened -1.1%.
- (JP) JAPAN JUN NATIONAL CPI Y/Y: 0.2% V 0.2%E; CPI EX-FRESH FOOD (CORE) Y/Y: 0.2% V 0.2%E; CPI Ex-fresh food/energy (Core-Core) Y/Y: -0.2% v -0.2%e.
- (JP) Japan PM Suga: Will implement thorough COVID measures for safe and secure games.
- (CN) Japan private school pension fund might purchase bonds from China - US financial press.
- (JP) Japan government: On Aug 6th to release CPI data for Jan 2020 to Jun 2021 calculated under the new base year.
- (JP) Japan Chief Cabinet Sec Kato: Japanese companies were targeted by cyberhacking group, Apt40, which is highly connected to China Govt.
- (JP) Japan Jr Coalition Partner Komeito's leader Yamaguchi: Want the Govt to offer quick aid to restaurants under lockdown and prevent any hospital bed shortage.
- 7751.JP Raises FY21 guidance Net to ¥201B; Op ¥283B; Rev ¥3.6T (Prior ¥140B; Op ¥198B; Rev ¥3.5T) (yesterday after the close).
Korea
- Kospi opened -0.6%.
- (KR) Unit of South Korea sailors recently sent to address pirating in Africa had 247 sailors of the 301 sent get infected with COVID.
- (KR) South Korea Vice Foreign Min Choi: recent remarks by a senior Japan diplomats disparaging President Moon's efforts to improve ties with Tokyo acted as a "significant obstacle" to Moon's potential trip to Tokyo - Yonhap.
China/Hong Kong
- Hang Seng opened -0.3%; Shanghai Composite opened -0.7%.
- (CN) CHINA PBOC MONTHLY LOAN PRIME RATE (LPR) SETTING: LEAVES BOTH 1-YEAR AND 5-YEAR RATES UNCHANGED (15TH CONSECUTIVE MONTH OF STEADY RATES).
- (CN) China may start relending policy for sectors related to carbon-reduction, other policies could include a 'favorable' reserve ratio (RRR) - Chinese press.
- (CN) China PBOC sets Yuan reference rate: 6.4855 v 6.4700 prior.
- (CN) China PBOC Open Market Operation (OMO): Injects CNY10B in 7-day reverse repos v CNY10B in 7-day reverse repos prior; Net CNY0B v Net CNY0B prior.
- JIA Said to have halted plans for US IPO due to increased China Govt requirements for overseas IPOs – press.
- (CN) China Agriculture Ministry: End-Jun pig herd at 99.4% of levels at end of 2017; sow herd at 102% of end of 2017 levels.
North America
- AAPL To postpone return to office until earliest October, due to COVID, will give 1 month notice before return - press.
- (CN) US and a coalition of allies said to accuse China's Ministry of State Security of a global cyber hacking campaign – press (US session).
- (US) Sen Maj Leader Schumer: To have procedural vote on Wednesday on bipartisan $1.2T infrastructure bill, do not have to have every detail of bill worked out by Wednesday.
- CMCSA CEO said to have met with ViacomCBS Chairwoman in late Jun in relation to international streaming partnership - US financial press.
Europe
- (UK) PM Johnson to announce increase to national insurance premiums - UK press.
- UBSG.CH Reports Q2 Net $2.0B v $1.2B y/y, Adj PBT $2.6B v $1.6B y/y, Rev $8.98B v $7.4B y/y, to buyback $600M in shares in Q3 (under existing buyback program).
- (UK) BOE's Mann: UK recovery is more fragile than it appears; Do not see inflation becoming a spiral, we should not be premature on tightening (US session).
Levels as of 01:15ET
- Hang Seng -0.9%; Shanghai Composite -0.4%; Kospi -0.6%; Nikkei225 -0.8%; ASX 200 -0.6%.
- Equity Futures: S&P500 +0.3%; Nasdaq100 +0.5%, Dax +0.2%; FTSE100 +0.1%.
- EUR 1.1803-1.1787; JPY 109.61-109.38 ;AUD 0.7358-0.7317; NZD 0.6955-0.6902.
- Commodity Futures: Gold +0.5% at $1,818/oz; Crude Oil +0.4% at $66.61/brl; Copper +0.6% at $4.22/lb.
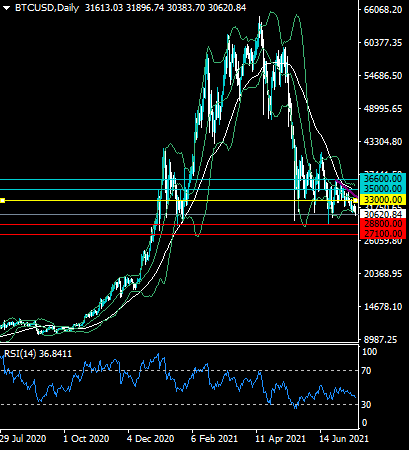
BTCUSD Still Bearish
Technical analysis
The RSI is under line 50, indicating that selling pressure and the overall downtrend is still in play.
The BTCUSD pair is testing its lower Bollinger Band on the daily time frame. Sustained weakness under the lower Bollinger Band will generate a sell signal.
What the possible outcomes are
In our most likely scenario, BTCUSD starts to hold below the lower Bollinger Band on the daily time frame on a sustained basis and then delcines towards the $28,880 level, or possibly the $27,100 level.
Alternatively, the BTCUSD pair may hold above the lower Bollinger Band on the daily time frame, and then start to attract buying interest. BTCUSD may then rebound towards the $33,000 resistance lower.
Key levels
Support $28,800 $27,100
Resistance $33,000 $35,000
GBPUSD Bearish Under 1.3690
Technical analysis
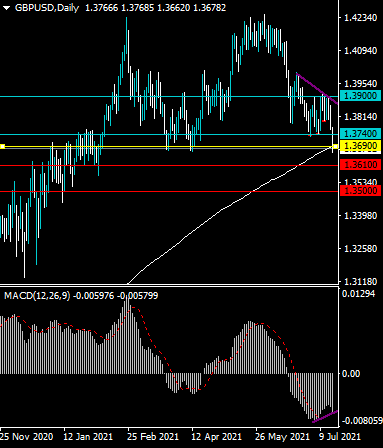
The GBPUSD pair broke below its 200-day moving average for the first-time since December 2020 yesterday.
Bullish MACD price divergence makes selling the GBPUSD pair risky from current trading levels.
What the possible outcomes are
In our most likely scenario, the GBPUSD pair starts to recover above its trend defining 200-day moving average and head back towards the 1.3900 resistance level due to the presence of bullish MACD price divergence.
Alternatively, the GBPUSD pair may continue to weaken below its 200-day moving average on a multi-day basis, and then start to test towards the 1.2500 support level over the coming session.
Key levels
Support 1.2630 1.2500
Resistance 1.3740 1.3900