Sample Category Title
USDCAD Now Bullish
Technical analysis
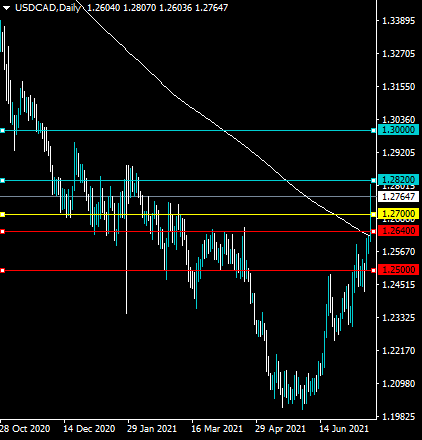
The USDCAD pair has broken above its 200-day moving average, so the overall trading trend is now bullish.
When the trend turns bullish on the daily time frame then buying dips is usually the best strategy.
What the possible outcomes are
In our most likely scenario, USDCAD may experience a technical correction towards the first support level of 1.2700 and then rally towards the 1.3000 level. If the pair falls below the first support level, we can expect at least another test towards the second support level at 1.2640, which is the pairs 200-day moving average.
Alternatively, the USDCAD pair can just continue to trade higher and start to advance towards the 1.3000 resistance level, which is a likely mid-term target for bulls.
Key levels
Support 1.2700 1.2640
Resistance 1.2880 1.3000
AUD/USD Daily Report
Daily Pivots: (S1) 0.7306; (P) 0.7361; (R1) 0.7399; More...
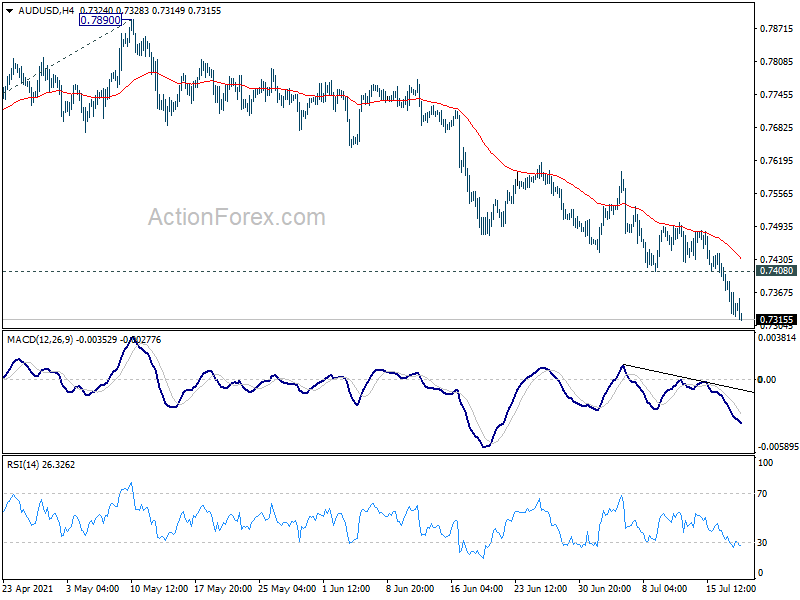
Intraday bias in AUD/USD remains on the downside for the moment. Fall from 0.8006 is correcting the whole up trend from 0.5506. Next target is 161.8% projection of 0.8006 to 0.7530 from 0.7890 at 0.7120. On the upside, break of 0.7408 minor resistance will turn intraday bias neutral and bring consolidations first, before staging another decline.
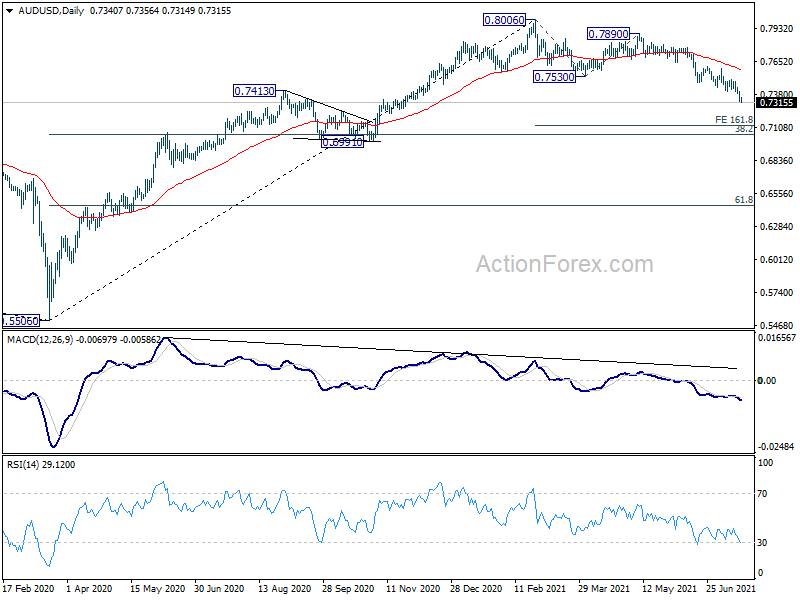
In the bigger picture, rise from 0.5506 medium term bottom could have completed at 0.8006, after failing 0.8135 key resistance. Correction from there could target 0.6991 cluster support (38.2% retracement of 0.5506 to 0.8006 at 0.7051). We'd look for strong support from there to bring rebound. However, sustained break of this level would argue that the whole medium term has indeed reversed.
Global Stocks Stage A Comeback Rally
Global stocks tanked on Monday as fears of the Delta virus spread globally. In the United States, the Dow Jones shed more than 800 points while the S&P 500 and Nasdaq 100 indices declined by more than 1%. Similarly, in Europe, the DAX, FTSE 100, and Stoxx 50 indices declined by more than 1%. Things turned around in the futures market, where the leading American indices rose by more than 0.50%. The weakness came as more countries like Thailand, UK, the US, and Australia reported more Covid cases and lockdown measures.
US futures rose after the relatively strong quarterly results from some of the biggest companies. On Monday, AutoNation said that its sales of new and used vehicles rose by 42% and 37% in the second quarter. The average cost of a car rose to $38,088 as supply shortages spread. Its revenue rose to more than $6.98 billion while net income rose to a record $4.83. Meanwhile, IBM reported revenue of $18.75 billion driven by its cloud and software business. Its cloud business rose by 13%, which is a slower rate than other comparable companies like Microsoft and Amazon. Its cloud revenue rose to $7 billion. The earning season will continue today when key companies like Halliburton, KeyCorp, and Philip Morris are expected to publish.
The Japanese yen declined against the US dollar after weak Japan inflation data. According to the country’s statistics agency, headline inflation rose by 0.3% MoM in June. This led to an annualised increase of 0.2%. The core CPI, which is BOJ’s favourite metric, rose by 0.2%. These numbers show that the Japanese economy is still struggling with low inflation. In other countries like the US and UK consumer prices rose by 5.4% and 2.5% in June. Later today, the key numbers to watch will be the Eurozone current account, US housing starts, and Russian retail sales numbers.
EURUSD
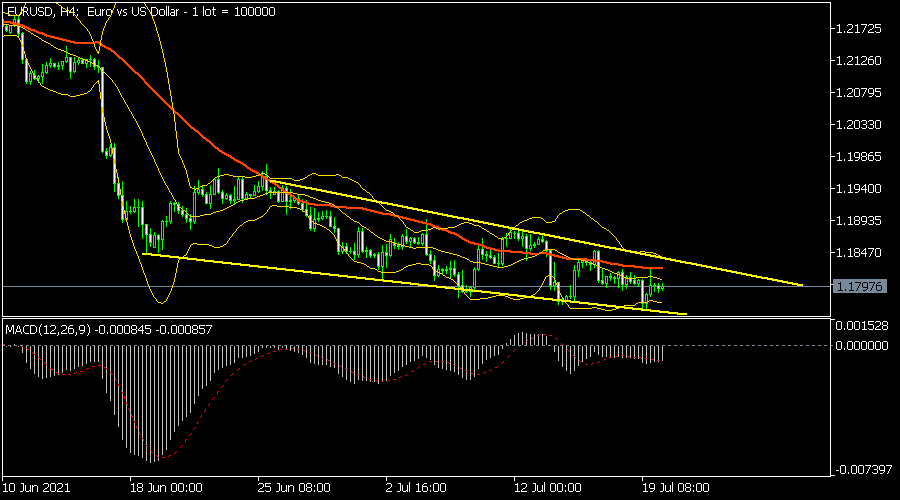
The EURUSD pair remained in a tight range as global markets retreated. The pair is trading at 1.1797, where it has been in the past few days. The four-hour chart has formed a falling wedge pattern and is slightly below the 25-day moving average. It is also along the middle line of the Bollinger Bands. Therefore, the pair will likely remain in this range today.
NDX100
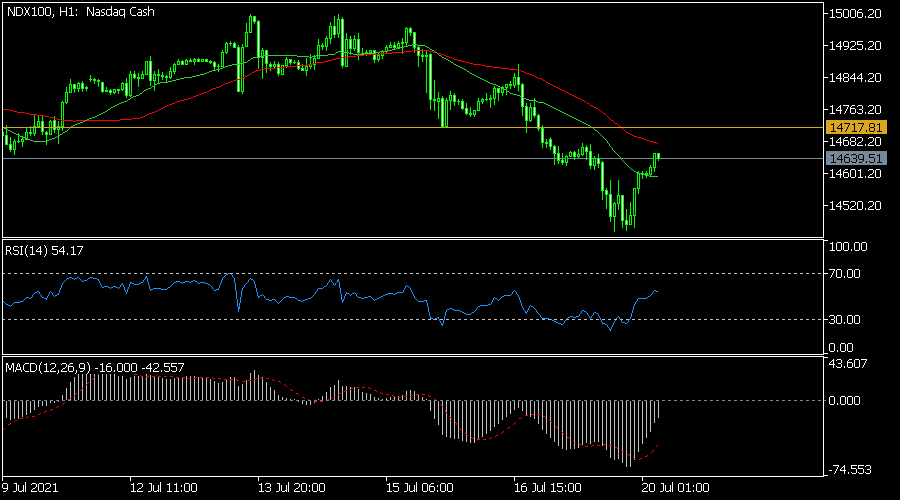
The Nasdaq 100 index declined sharply on Monday. It moved to a low of $14,450, which was the lowest level since July 1. It then rebounded to the current level at $14,647. On the hourly chart, the index has moved above the 25-day moving average while oscillators have risen. It is also approaching the next key resistance at $14,717. Therefore, the pair will likely keep rising as bulls target this resistance level. However, there is also a possibility that it will retreat since this bounce could be a part of a dead cat bounce.
JPN225
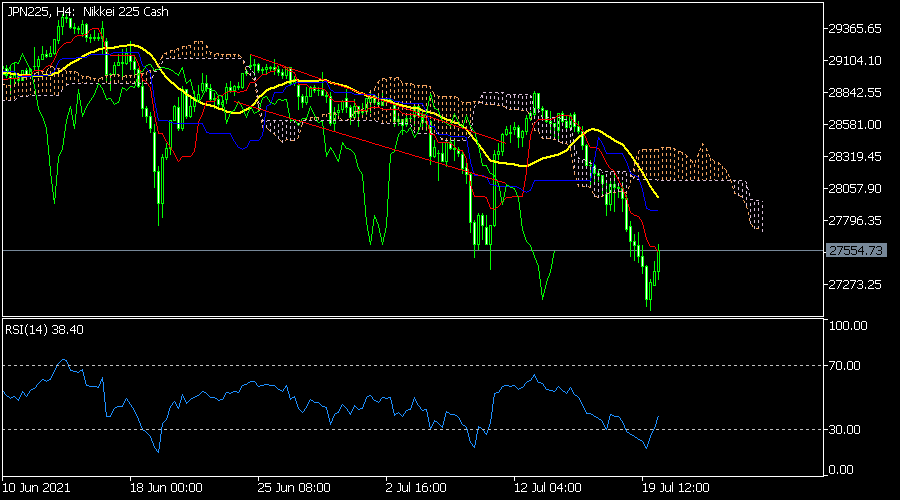
The Nikkei 225 index declined sharply yesterday. It fell to a multi-month low of ¥27,060 and then rebounded to the current ¥27,587. The pair’s Relative Strength Index also moved from the oversold level of 25 to 40. It is still below the Ichimoku cloud while the MACD has also risen. The index will likely keep rising as bulls target the next key resistance at ¥27,800.
USD/CAD Daily Outlook
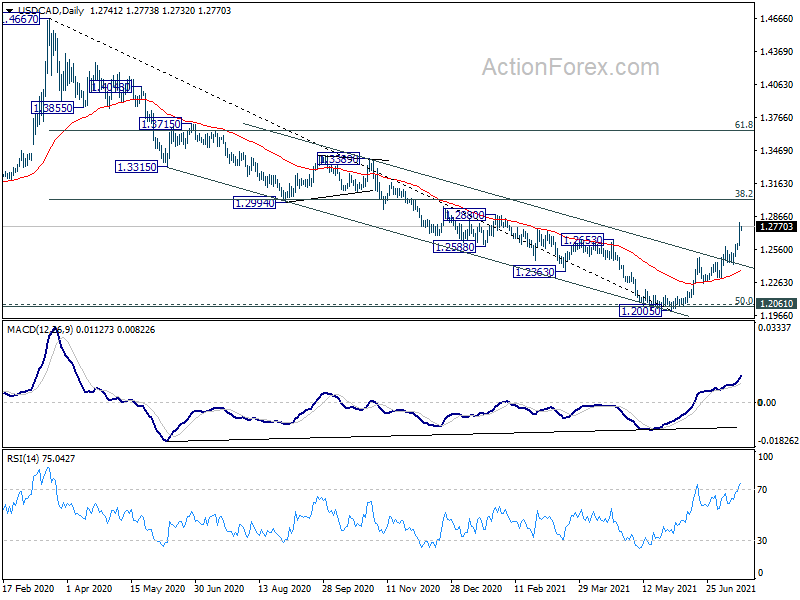
Daily Pivots: (S1) 1.2634; (P) 1.2721; (R1) 1.2833; More...
Intraday bias in USD/CAD remains on the upside at this point. Whole fall from 1.4667 should have completed at 1.2005. Further rally would be seen to 1.3022 medium term fibonacci level next. On the downside, break of 1.2640 minor support will turn intraday bias neutral first. But outlook will now stay bullish as long as 1.2423 support holds, in case of retreat.
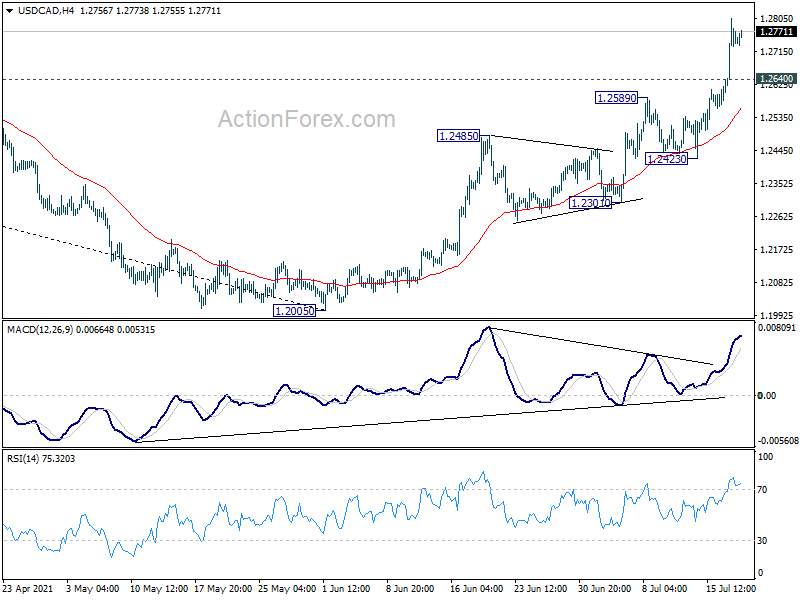
In the bigger picture, fall from 1.4667 is seen as the third leg of the corrective pattern from 1.4689 (2016 high). It should have completed after hitting 1.2061 (2017 low) and 50% retracement of 0.9406 to 1.4689 at 1.2048. Sustained break of 38.2% retracement of 1.4667 to 1.2005 at 1.3022 will pave the way to 61.8% retracement at 1.3650 and above. Overall, medium term outlook remains neutral at worst with 1.2048/61 support zone intact.
EUR/GBP Daily Outlook
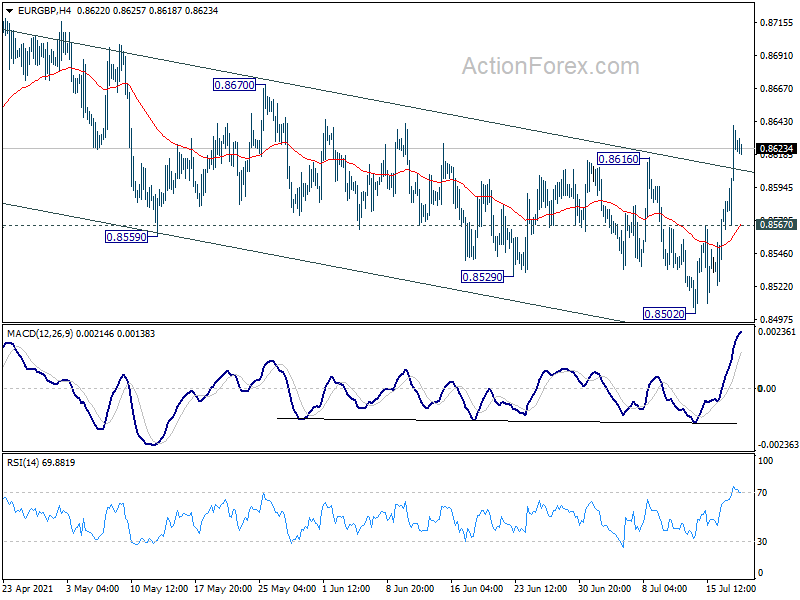
Daily Pivots: (S1) 0.8541; (P) 0.8560; (R1) 0.8597; More...
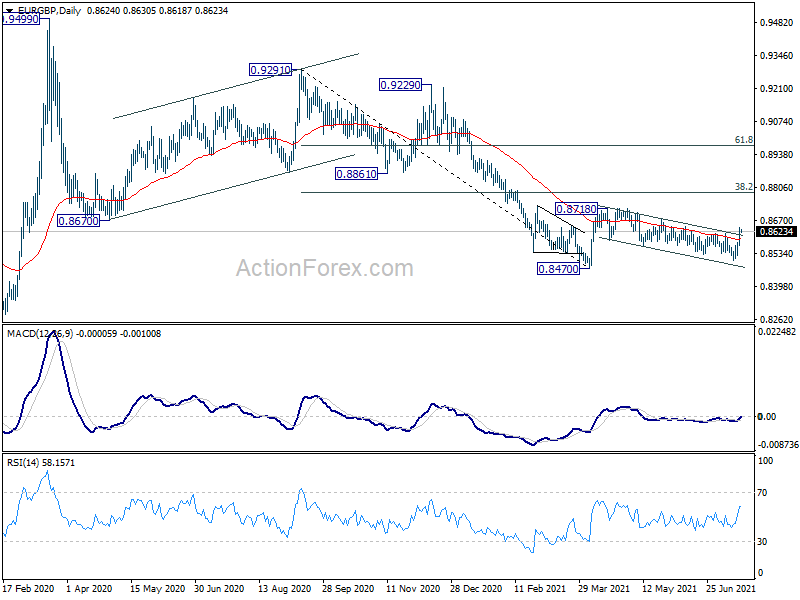
Intraday bias in EUR/GBP remains on the upside for 0.8670 resistance first. Break there will affirm the case that whole rebound from 0.8470 is resuming through 0.8718 resistance. On the downside, though, break of 0.8567 minor support will turn intraday bias neutral again first.
In the bigger picture, price actions from 0.9499 are still seen as developing into a corrective pattern. That is, up trend from 0.6935 (2015 low) would resume at a later stage. This will remain the favored case as long as 0.8276 support holds. However, firm break of 0.8276 support will suggest that rise from 0.6935 has completed and turn medium term outlook bearish.
EUR/AUD Daily Outlook
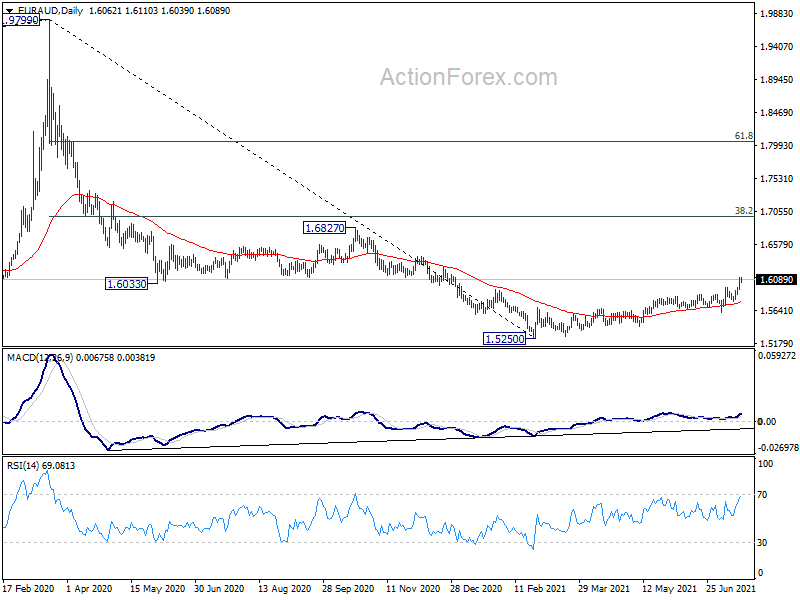
Daily Pivots: (S1) 1.5958; (P) 1.6040; (R1) 1.6147; More...
Intraday bias in EUR/AUD remains on the upside at this point. Rise from 1.5250 is at least correcting the whole fall from 1.9799. Further rise should be seen to 1.6827 resistance next. On the downside, below 1.5976 minor support will turn intraday bias neutral first. But further rise is expected as long as 1.5773 support holds, in case of retreat.
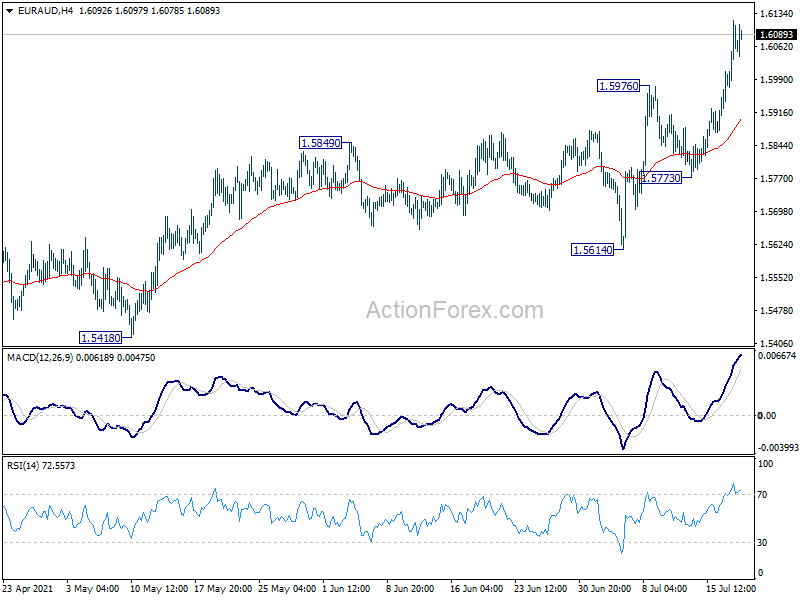
In the bigger picture, outlook stays bearish with 1.6033 support turned resistance intact for now. Fall from 1.9799, as a correction to to long term up trend from 1.1602 (2012 low) is still in favor to resume through 1.5250 later. However, firm break of 1.6033 will argue that such decline has completed. Stronger rebound would then be seen 38.2% retracement of 1.9799 to 1.5250 at 1.6988.
EUR/CHF Daily Outlook
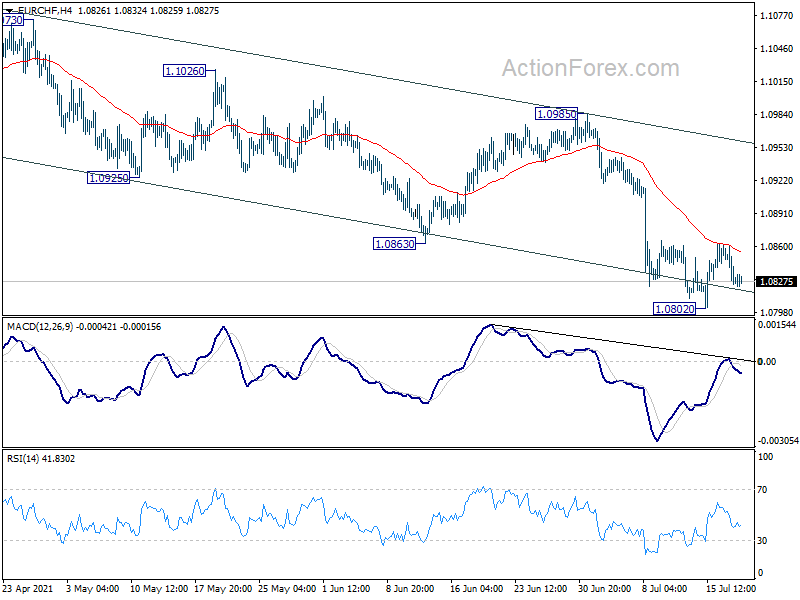
Daily Pivots: (S1) 1.0818; (P) 1.0840; (R1) 1.0855; More....
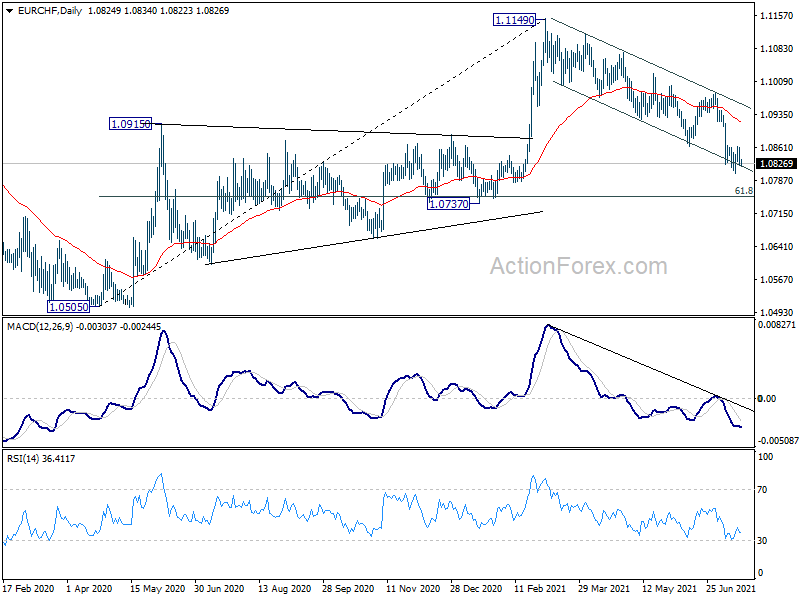
EUR/CHF is staying in consolidation from 1.0802 and intraday bias remains neutral. Outlook remains bearish as long as 1.0985 resistance intact. On the downside, break of 1.0802 will resume the decline from 1.1149, to 1.0737 cluster support next.
In the bigger picture, current development argues that rebound from 1.0505 (2020 low) might be completed with three waves up to 1.1149 already. Sustained trading below 55 week EMA (now at 1.0882) will affirm this bearish case. Further break of 1.0737 cluster support (61.8% retracement of 1.0505 to 1.1149 at 1.0751) will bring retest of 1.0505 low.
GBP/JPY Daily Outlook
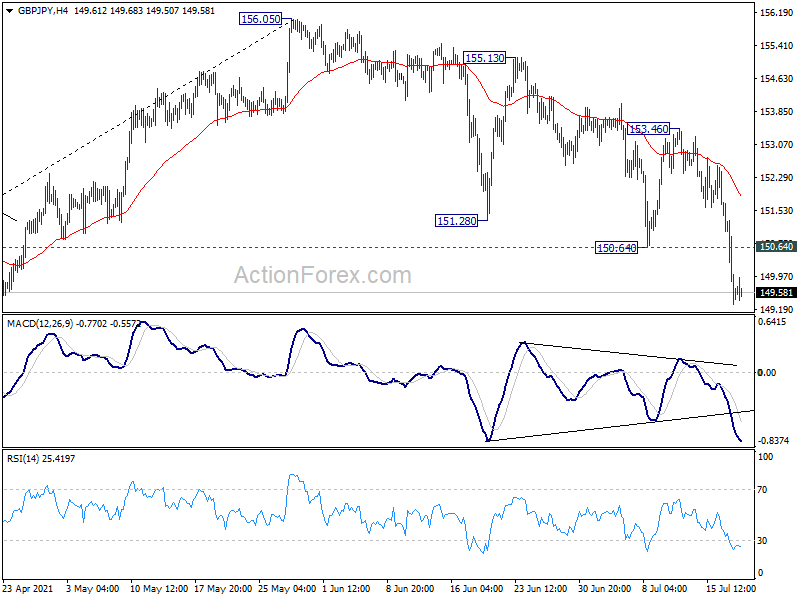
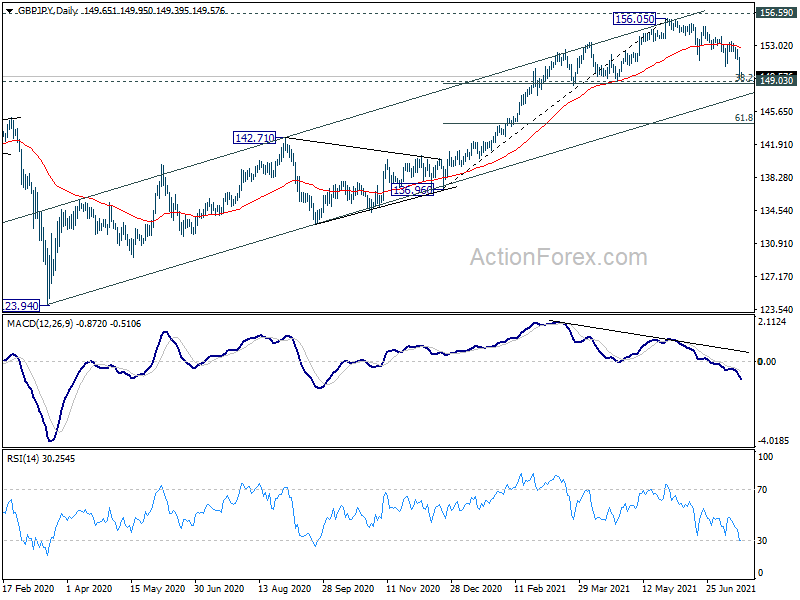
Daily Pivots: (S1) 148.80; (P) 150.22; (R1) 151.09; More...
GBP/JPY's fall from 156.05 resumed by breaking 150.64 and hit as low as 149.30 so far. Intraday bias is back on the downside for 38.2% retracement of 136.96 to 156.05 at 148.75. We'd continue to look for strong support from there to bring rebound. But sustained break there will argue that it's corrective whole up trend from 123.94, and target 142.71 resistance turned support next. On the upside, above 150.64 resistance will turn intraday bias neutral first.
In the bigger picture, rise from 123.94 is seen as the third leg of the pattern from 122.75 (2016 low). Focus remains on 156.59 resistance (2018 high). Sustained break there should confirm long term bullish trend reversal. Next target is 61.8% retracement of 195.86 (2015 high) to 122.75 at 167.93. On the downside, sustained break of 149.03 support, however, will argue that rise from 123.94 has completed. Further break of 142.71 would open up the bearish case for retesting 122.75 low.
Risk Assets Under Pressure As COVID-19-Fears Return
Market movers today
- Today is another quiet day in terms of economic data releases. In the afternoon, US housing starts, and building permits are due out, which will shed some light on the recent development in construction (where activity seems to be declining after a very hot period).
Economic calendar
Covid-fears return: Risk assets tumbled across the board yesterday as covid-fears are once again returning to the forefront of investors' minds with the number of new cases increasing in different parts of the world. U.S. authorities issued a travel warning, advising travellers going to the U.K. to reconsider their plans as the number of new cases hit more than 50,000 per day over the weekend, which is only some 10,000 below the levels seen in the beginning of the year. In the U.S. New York State recorded more than 1,000 new cases, the most since May, and in Texas covid-related hospitalisations reached above 3,000 for the first time in three months. Vaccines have appeared effective in lowering the correlation between new cases and hospitalisations, which should limit the need to re-impose strict lockdowns in countries with a high vaccine uptake.
EU rule of law: In a report due later today the European Commission officially warns of judicial independence being under pressure in both Poland and Hungary, while highlighting other threats to the rule of law such as corruption and favouritism. The report is published as both countries' applications for Next Generation EU funds are currently being assessed, with Poland applying for EUR 24bn and Hungary EUR 7bn. The Commission is under pressure from both MEPs and other member states to toughen up in order to ensure that core EU values are maintained across the union.
Equities: Equities, as other risk assets, naturally were under pressure yesterday with the S&P500 extending losses (-1.6%) in what has been difficult past seven days (the index is down 3% since last Monday). The VIX increased 4 points to the highest level since the beginning of May. This morning Asian indices are down roughly 1% (Hang Seng and Nikkei) whereas index futures in both Europe and the U.S. points to a stable opening later today.
FI: US government bond yields declined heavily on Monday performing along with other safe haven assets settling in at 1.19%, which was 9bp below the level at market open and 50bp below the levels in May. The move was almost solely driven by longer than 5y yields as curve flattened correspondingly. Longer dated U.S. inflation expectations have come lower in recent weeks, but not enough to keep real rates stable with the 10y USD real rate ending the day at -1.12%, which is only marginally above the all-time low recorded seven months ago.
FX: In a tough session for anything rhyming on reflation NOK FX unsurprisingly took the biggest losses with EUR/NOK back above the 10.50 threshold for the first time since January. USD, CHF, and not least JPY - the traditional winners in a global fixed income rally - all posted gains. Yet the sharp decline in USD real rates limited the appreciation of the USD. Industrial sensitive currencies such as EUR, SEK, and CNH did decent given the global environment while CAD, AUD, NZD joined NOK as the biggest underperformers.
Credit: Credit experienced another weak day on Monday, amid rising concerns about the Delta variant and general uncertainty about the economic recovery. This caused iTraxx Main to widen 1.7bp to 49.3bp, whilst iTraxx xover widened 9.2bp to 247.4bp. The primary market remains subdued due to the summer lull.
Elliott Wave View: SPX Correcting Larger Degree Cycle
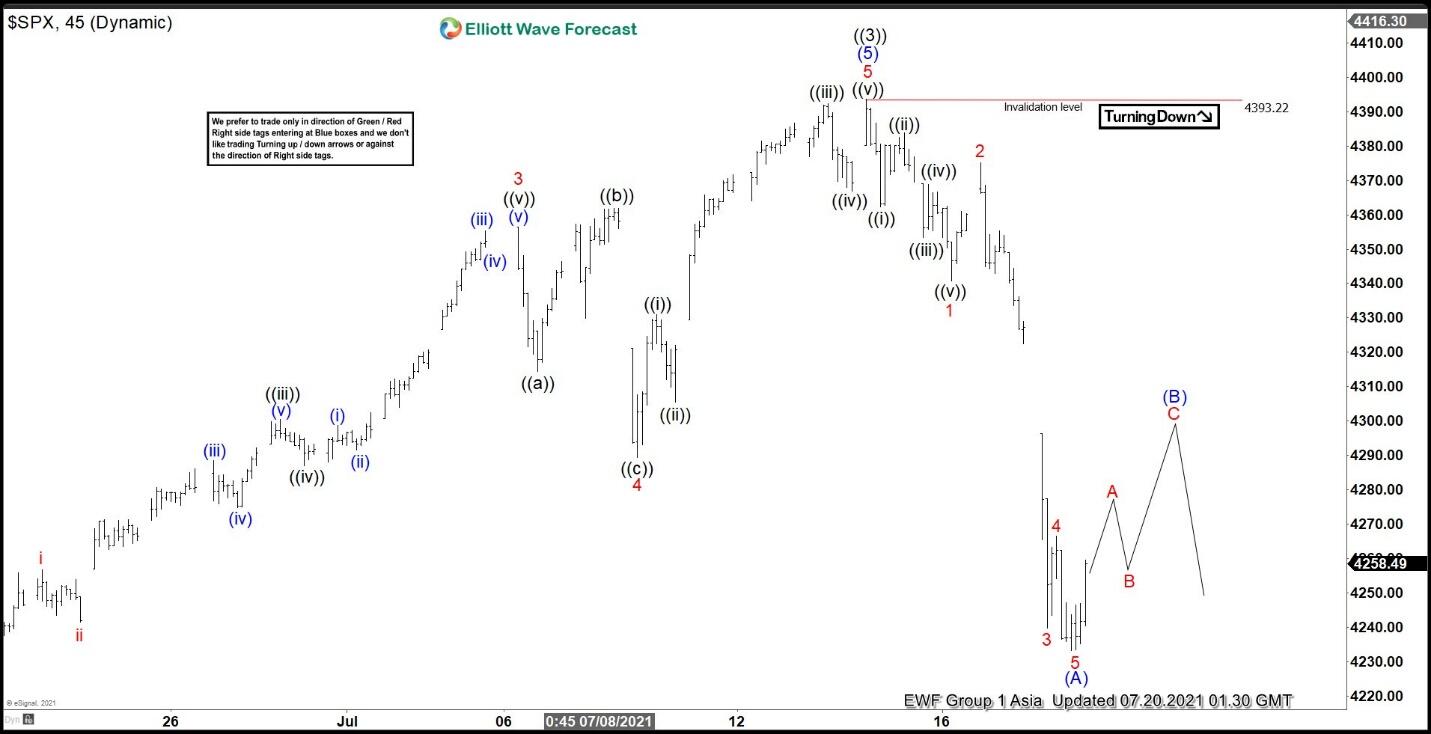
Since forming the bottom on March 2020 low, S&P 500 ($SPX) has started a new bullish cycle which brings the Index to all-time high. The entire rally from March 2020 low can be counted as 3 waves so far. Up from March 23, 2020 low, wave ((1)) ended at 3588.11 and pullback in wave ((2)) ended at 3209.45. Index then resumes higher and ended wave ((3)) at 4393.22 as the 45 minutes chart below shows.
Wave ((4)) pullback is currently in progress to correct cycle from September 24, 2020 low in 3, 7, or 11 swing before the rally resumes. The pullback is proposed to be unfolding as a zigzag Elliott Wave structure. Down from wave ((3)), wave 1 ended at 4340.70 and rally in wave 2 ended at 4375.09. Index resumes lower in wave 3 towards 4239.82 and bounce in wave 4 ended at 4266.56. Final leg lower wave 5 ended at 4233.13. This completed wave (A) in higher degree. Wave (B) is now in progress to correct the decline from July 14 peak in 3, 7, or 11 swing before Index turns lower again. Near term, as far as July 14 high pivot remains intact, expect short term rally to fail in 3, 7, or 11 swing for further downside.
SPX 45 Minutes Elliott Wave Chart