Sample Category Title
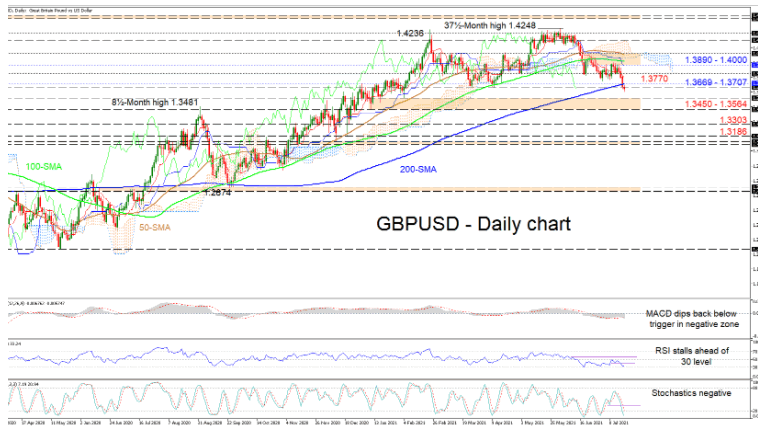
GBPUSD Dives Beyond 200-MA And Key Troughs
GBPUSD has slipped underneath the 200-day simple moving average (SMA) at 1.3707 and the March and April troughs at 1.3669, strengthening a bearish notion as it surrenders extra ground. The dipping 50- and 100-day SMAs are giving the impression that bearish forces are seizing command.
The Ichimoku lines are indicating that downside risks are persisting, while the short-term oscillators are suggesting the pair may remain heavy for a little while longer. The MACD below zero has nudged back beneath its red trigger line, while the RSI is nearing the 30 level. Furthermore, the negatively charged stochastic oscillator is endorsing the reign of the bears.
If sellers manage to prolong the downward trajectory, initial deterrence to the descent could arise from the support zone of 1.3450-1.3564 formed between the lows of February 4 and January 11. Should this critical barricade fail to halt growing negative tendencies, the price may then sink to test the 1.3303 obstacle ahead of the 1.3186 trough.
If buyers manage to find their feet and successfully oppose accelerating bearish pressures, they would initially have to return above the 1.3669 level (previous support-now-resistance) and the nearby 200-day SMA at 1.3707. Pushing higher, the red Tenkan-sen line at 1.3770 and the neighbouring 1.3800 handle may attempt to negate the pair’s efforts to improve. Nonetheless, a more challenging resistance obstacle lingers overhead should buyers persist, that being an area from the blue Kijun-sen line at 1.3890 until the 1.4000 mark.
Summarizing, for GBPUSD’s recently adopted bearish bearing to remain active, the price would need to persist below the SMAs and the 1.3669 troughs. Yet, to elevate buyers’ confidence, the price would be required to pilot back above the SMAs and the Ichimoku cloud.
Economic Growth Worries Torment Stocks And Oil
- Economic slowdown concerns hit stocks, oil gets demolished
- Commodity currencies struggle too, dollar and yen shine
- But the panic could fade soon, as stimulus hopes return
Pandemic blues hit markets
Worries that the rampaging Delta variant will hamstring the global recovery took a bite out of riskier assets on Monday. Markets seem to be coming to the realization that the vaccines won’t be enough to completely obliterate the virus, as the mutations keep getting more resilient.
Many governments are also struggling with vaccine hesitancy, which is blocking the path towards herd immunity. Meanwhile, developing nations simply don’t have enough vaccines to escape the lockdown spiral. Add everything up and it looks like the pandemic might stick around for a long time.
All this translated into another session characterized by fear. Stocks on Wall Street fell sharply, but in classic pandemic fashion, tech and growth names didn’t get hit as hard as value and reopening plays. Whenever investors are worried about growth, they seek shelter in tech companies that can prosper even under lockdown conditions, and whose extreme valuations become more reasonable as bond yields fall.
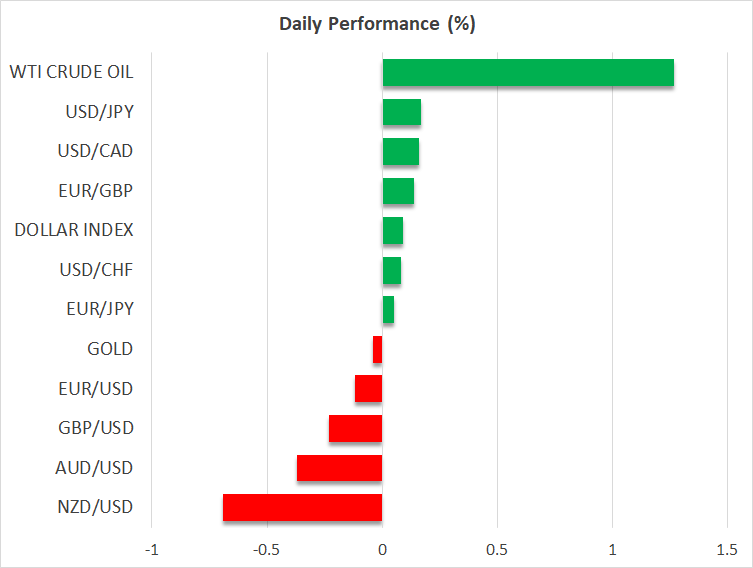
But the real fireworks were in oil prices, which fell almost 7% as traders took profits or covered their bullish bets, decimating the oil-sensitive Canadian dollar. The demand outlook is turning darker just as OPEC locked in steady supply increases, raising doubts about how long the oil market will remain undersupplied.
Can it last?
The rotation to safety was also clear in defensive plays like the US dollar and the yen, which capitalized mainly on the havoc in commodity currencies. Even gold managed a comeback, defying the mighty dollar and instead drawing power from the collapse in real US yields, which are now back within breathing distance of their record lows.
The burning question is how much further this correction has to go. Most assets have stabilized today and a sense of calm has returned, but it’s difficult to say the storm has truly passed. Emotions are the name of the game right now, and those can swing quickly.
The silver lining is that if economic growth is hit as hard as markets currently suggest, the major central banks will likely push back their normalization plans and governments could keep spending heavily for longer. As this crisis has shown, extravagant government spending and cheap money policies are an incredibly powerful elixir for financial markets that can overpower virus fears.
Therefore, the real question is how much worse things have to get before the Fed hits the panic button, calming markets down.
Aussie and kiwi extend losses
The only currencies that haven’t stabilized today are the Australian and New Zealand dollars, as well as the British pound. The aussie has been caught in the crossfire of falling commodity prices, an extension of the lockdowns across Australia, and whispers that the RBA could soon put its tapering plans into reverse.
Meanwhile, the kiwi sliced through some key support levels, even as markets continue to price in even chances for an RBNZ rate increase next month. The island remains virtually virus-free and recent data suggest the economy is booming, but currency markets seem to be saying that raising rates in an environment of slowing global growth will be tricky.
Finally, the British pound remains under pressure as well, unable to capitalize on the newfound calm in stock markets. Britain is grappling with another outbreak, and while hospitalizations are still low thanks to the vaccines, health officials suggest the situation will get worse before it gets better.
Another element tormenting the pound is the dovish tone of the Bank of England’s latest addition, Catherine Mann, who made it clear in her first public appearance yesterday that she won’t get behind an early withdrawal of stimulus.
As for today, the earnings season gets rolling with Netflix and United Airlines.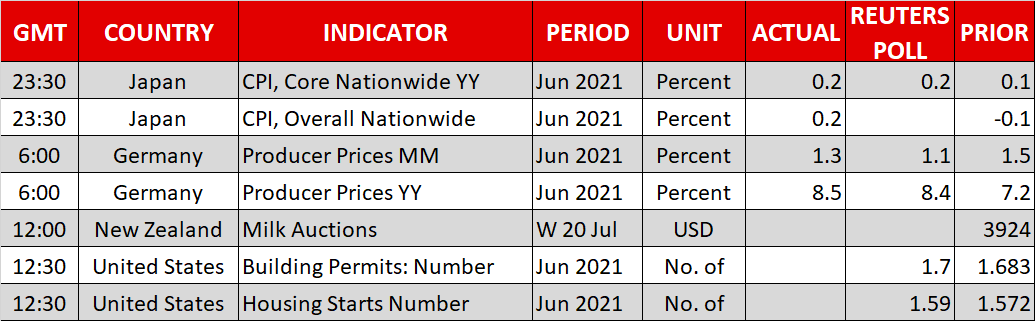
GBPUSD Is Possibly Bearish
Technical analysis
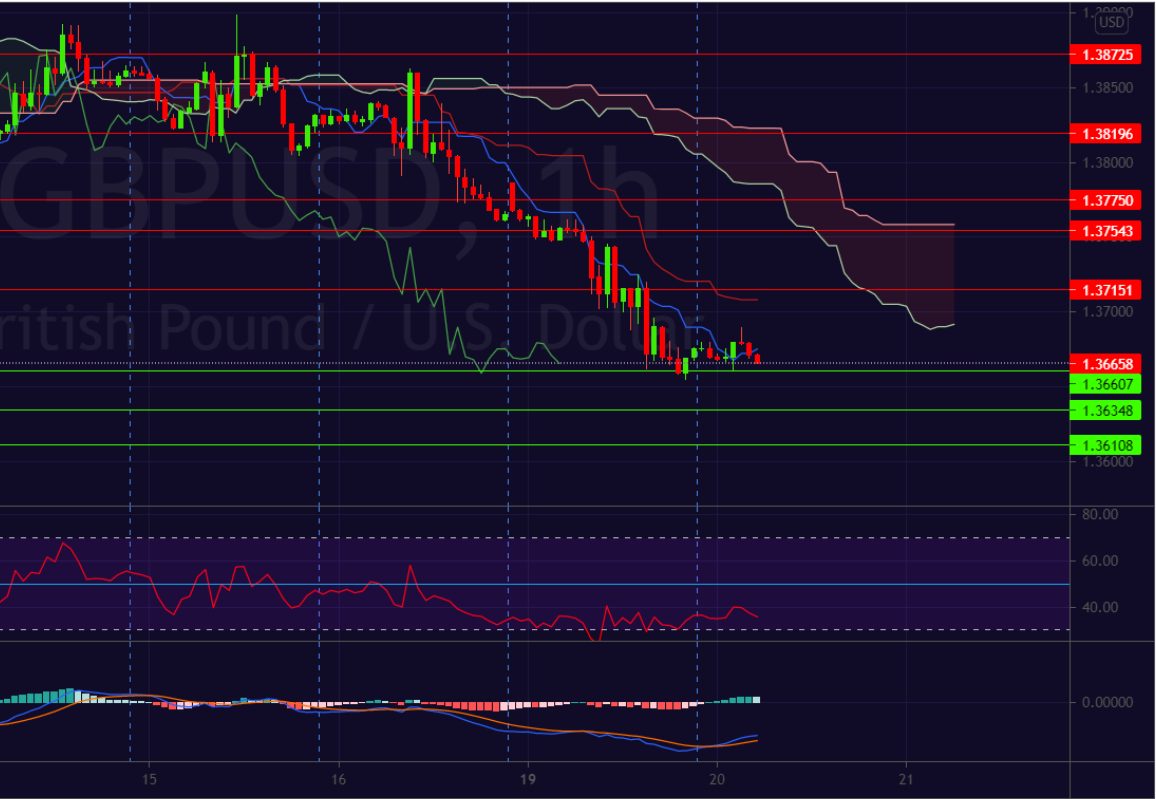
The RSI is under line 50, together with the MACD, indicating that the downtrend may prevail
The Ichimoku indicator shows that the price is under the Tenkan-sen line and the Kijun-sen, signifying selling pressure.
What the possible outcomes are
In our most likely scenario, GBPUSD may experience a downward correction towards the first support level of 1.36607. If the pair falls below the first support level, we can expect a continued downtrend towards the second support level of 1.36348, with a continued downtrend towards 1.36108.
Alternatively, the GBPUSD pair may rise towards the first resistance level of 1.37151. If the pair manages to surpass the first resistance level, we should expect a continued surge towards the resistance level of 1.37543.
Key levels
Support 1.36108 1.36348 1.36607
Resistance 1.37151 1.37543 1.37750
CADJPY Negative Bias
Technical analysis
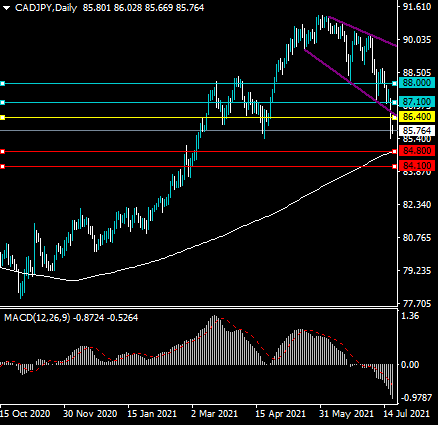
The MACD indicator is bearish, with the MACD histogram and signal line both trending lower on the daily time frame.
The CADJPY pair has broken under a descending broadening wedge pattern. Further heavy selling is likely as wedge pattern breakout usually increase technical selling.
What the possible outcomes are
In our most likely scenario, the CADJPY pair will continue to decline over the medium-term horizon and test towards its trend defining 200-day moving average, around the 84.80 support area.
Alternatively, the CADJPY pair may stage a minor technical correction and then start to fall. This scenatio would see the pair test back towards the former breakout area from the wedge pattern, around the 86.40.
Key levels
Support 84.80 84.10
Resistance 86.40 87.10
AUDUSD Heavily Bearish
Technical analysis
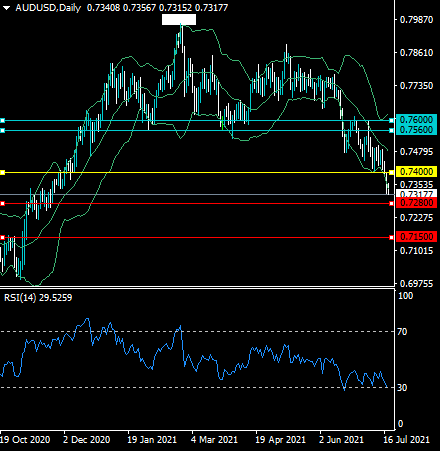
The AUDUSD has broken below its lower Bollinger Band on the daily time frame, meaning that the downtrend in the pair is starting to accelerate.
According to the RSI indicator the AUDUSD pair is bearish, however, the indicator is now approaching slightly oversold conditions.
What the possible outcomes are
In our most likely scenario, the AUDUSD pair falls towards at least the 0.7280 level as a bearish head and shoulders pattern continues to unfold to the downside on the daily time frame.
Alternatively, the AUDUSD could test towards the 0.7280 support level and then start to rebound towards the 0.7400 level, due to the fact that the pair is approaching slightly oversold trading continues.
Key levels
Support 0.7280 0.7150
Resistance 0.7400 0.7560
US Dollar Index Outlook: Dollar Remains Inflated By Risk Aversion On Delta Variant Spread
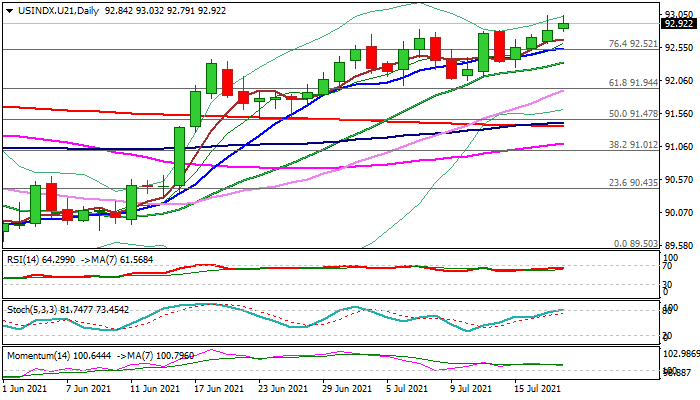
Dollar remains inflated by risk aversion on Delta variant spread US DOLLAR INDEX The dollar remains steady in early Tuesday’s trading and retested new 3 – 1/2 month high (93.03), posted after bullish acceleration on Monday.
The global spread of the highly contagious Delta variant of coronavirus raised fears of a pandemic resurgence and prompted investors into safety that lifted the greenback.
Technical studies on the daily chart are supportive for further advance (20-d Bollinger bands expand, moving averages are in full bullish setup and momentum studies are overall positive), but overbought stochastic suggests bulls may take a breather before pushing towards the next target at 93.45 (2021 high posted on Mar 31).
Broken Fibo 76.4% level (92.52) reverted to the solid support, reinforced by rising 10DMA and expected to ideally contain dips.
Only return and close below ascending 20DMA (92.32) would question larger bulls and soften the near-term structure.
Res: 93.03, 93.11, 93.45, 94.00.
Sup: 92.79, 92.52, 92.32, 92.06.
EUR/USD Bounces Off Support
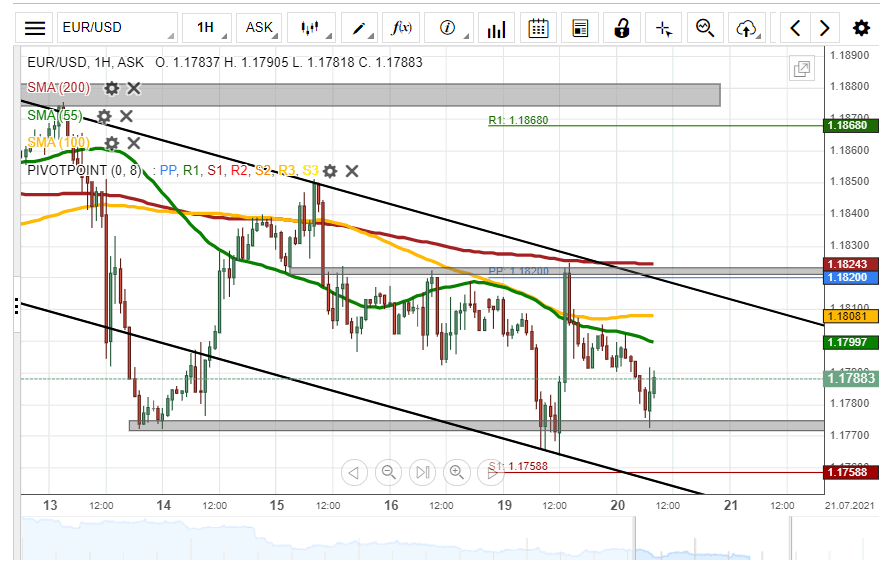
The EUR/USD currency pair bounced off a support level formed by the lower boundary of a descending channel pattern at 1.1765 on Monday. As a result, the common European currency surged by 55 pips or 0.46% against the US Dollar during Monday's trading session.
As for the near future, the exchange rate could continue to edge higher. A breakout through the upper boundary of the channel pattern could occur within this session.
However, if the descending channel pattern holds, bears could drive the currency exchange rate lower today.
GBP/USD Bears Could Prevail
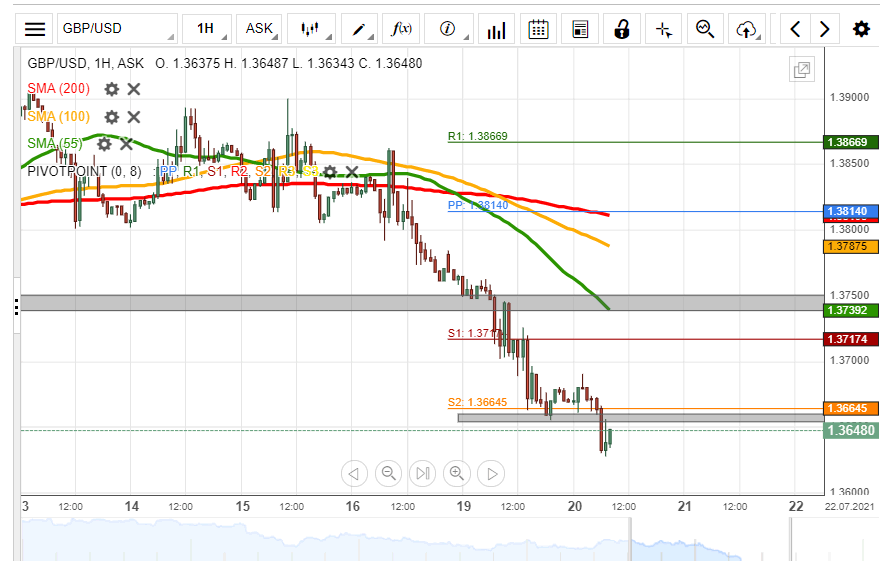
Downside risks dominated the GBP/USD exchange rate on Monday. As a result, the British Pound fell by 89 pips or 0.65% against the US Dollar during Monday's trading session.
All things being equal, the currency pair could continue to edge lower during the following trading session. The potential target for bearish traders would be near the weekly S3 at 1.3567.
However, the weekly support level at 1.3664 could provide support for the currency exchange rate in the shorter term.
USD/JPY Likely To Maintain Channel
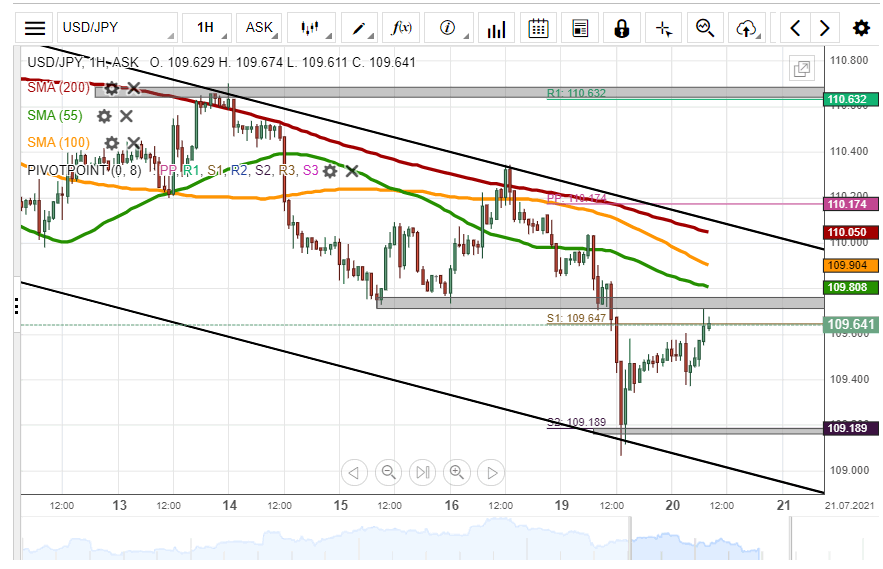
On Monday, the US Dollar plunged by 86 pips or 0.78% against the Japanese Yen. The currency pair tested the lower boundary of a descending channel pattern at 109.18 during Monday's trading session.
Everything being equal, the USD/JPY exchange rate is likely to continue to trend in the descending channel pattern during the following trading session. The potential target for sellers would be near the 109.00 level.
However, bearish traders might find support at 109.18 during Tuesday's trading session.
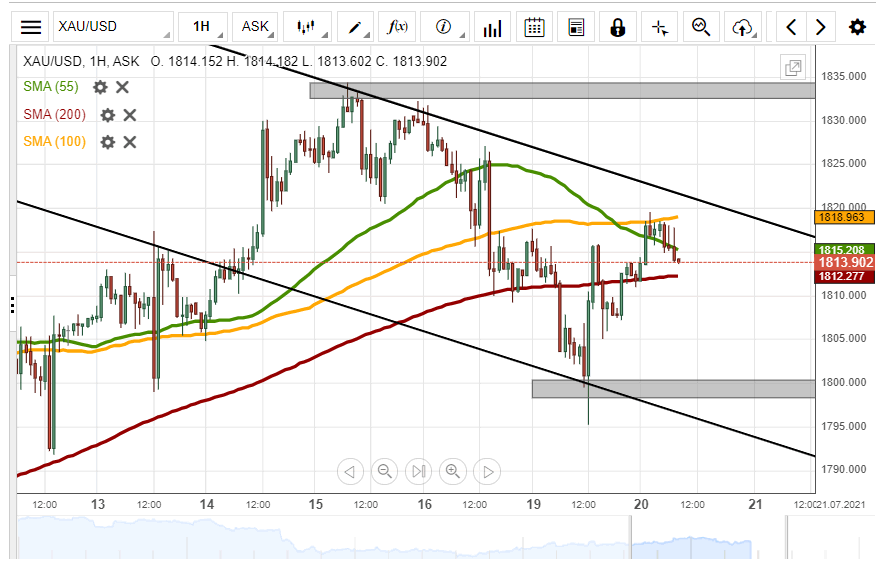
XAU/USD Bulls Could Prevail
During the second part of Monday's trading session, the yellow metal's price surged by 150 pips or 0.83%. The currency pair breached the 200– hour simple moving average at 1811.8 on Tuesday morning.
The XAU/USD exchange rate is likely to continue to edge higher through the following trading session. A breakout through the upper boundary of a descending channel pattern could occur.
However, if the channel pattern holds, bearish traders might drive the price of the commodity lower today.