Sample Category Title
EUR/USD Mid-Day Outlook
Daily Pivots: (S1) 1.1768; (P) 1.1796; (R1) 1.1828; More...
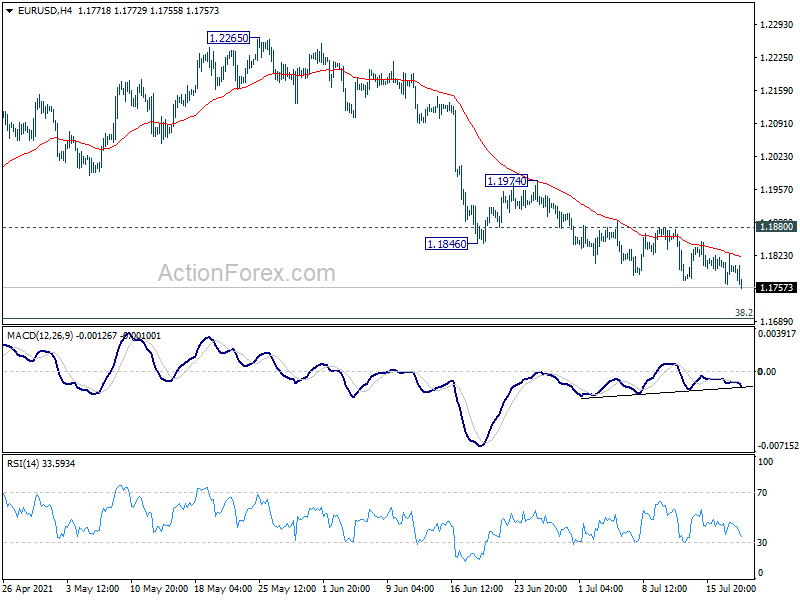
No change in EUR/USD's outlook and intraday bias stays on the downside. Decline from 1.2265, as the third leg of correction from 1.2348, would target 1.1703 support. On the upside, though, break of 1.1880 will indicate short term bottoming and turn bias back to the upside for stronger rebound to 1.1974 resistance first.
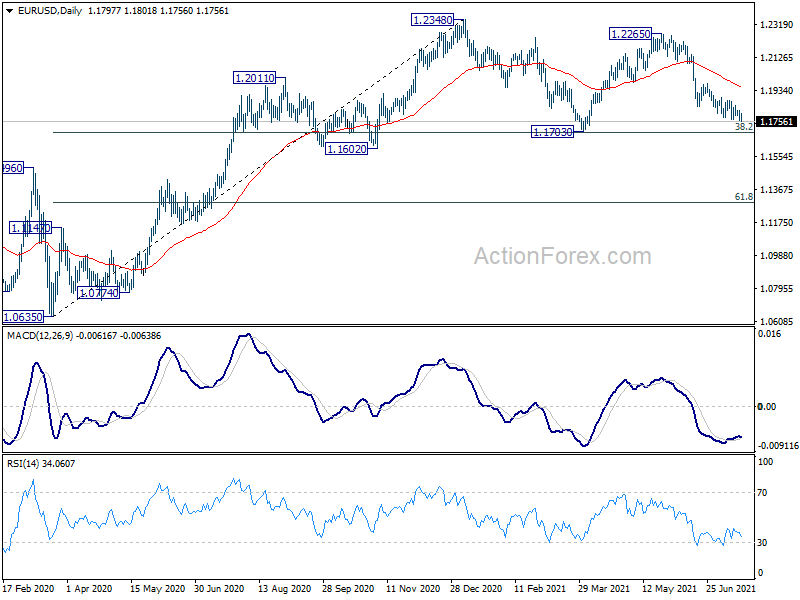
In the bigger picture, rise from 1.0635 is seen as the third leg of the pattern from 1.0339 (2017 low). Further rally could be seen to cluster resistance at 1.2555 next, (38.2% retracement of 1.6039 to 1.0339 at 1.2516). This will remain the favored case as long as 1.1602 support holds. Reaction from 1.2555 should reveal underlying long term momentum in the pair. However sustained break of 1.1602 will argue that the rise from 1.0635 is over, and turn medium term outlook bearish again.
USD/CHF Mid-Day Outlook
Daily Pivots: (S1) 0.9177; (P) 0.9190; (R1) 0.9209; More....
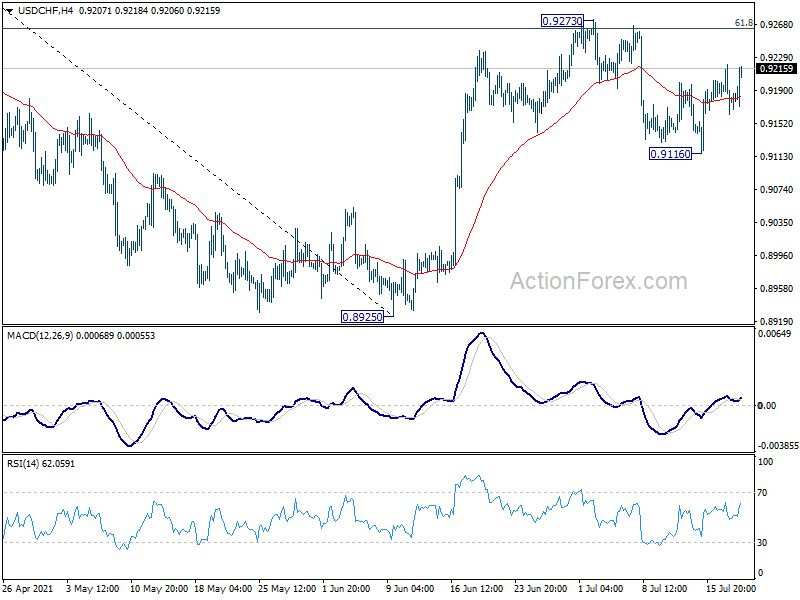
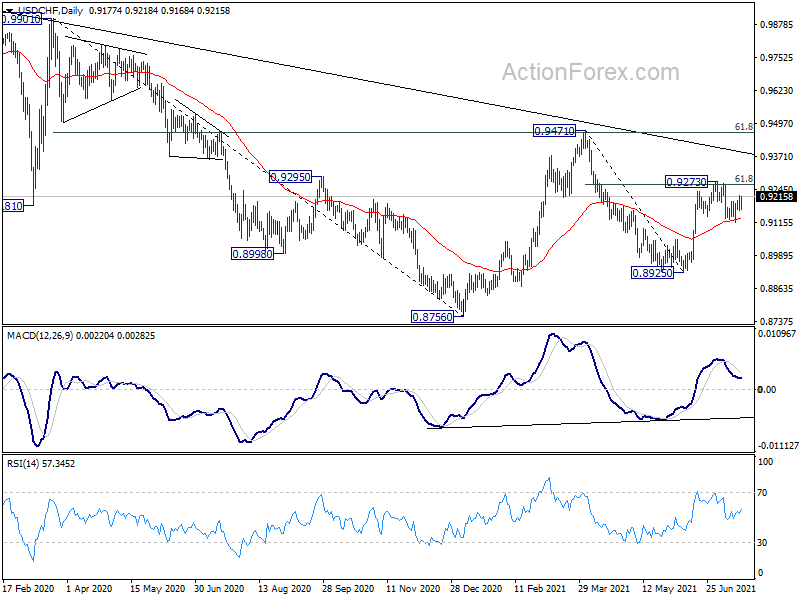
Range trading continues in USD/CHF and intraday bias remains neutral first. On the downside, sustained break of the 55 day EMA (now at 0.9130) will affirm the case that rebound from 0.8925 has completed at 0.9273. Deeper fall would then be seen back to retest 0.8925 low. On the upside, however, break of 0.9273 and sustained trading above 61.8% retracement of 0.9471 to 0.8925 at 0.9262 will target 0.9471 resistance next.
In the bigger picture, medium term outlook is currently neutral with focus on 0.9471 resistance. Sustained break there will indicate completion of whole decline from 1.0342 (2016 high). Medium term outlook will be turned bullish for a test on 1.0342 high. But, rejection by 0.9471 again will revive bearishness for another fall through 0.8756 low.
USD/JPY Mid-Day Outlook
Daily Pivots: (S1) 108.99; (P) 109.54; (R1) 110.02; More...
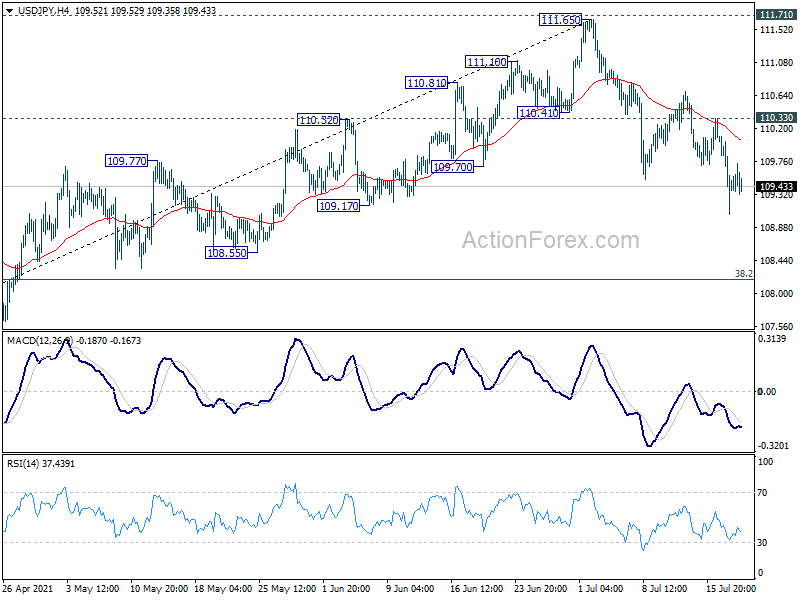
USD/JPY's fall from 111.65 is still in progress and intraday bias remains on the downside. Such decline is seen as at least correcting the whole rise from 102.58. Next target is 38.2% retracement of 102.58 to 111.65 at 108.18. On the upside, break of 110.33 resistance is needed to indicate short term topping. Otherwise, outlook will stay bearish.
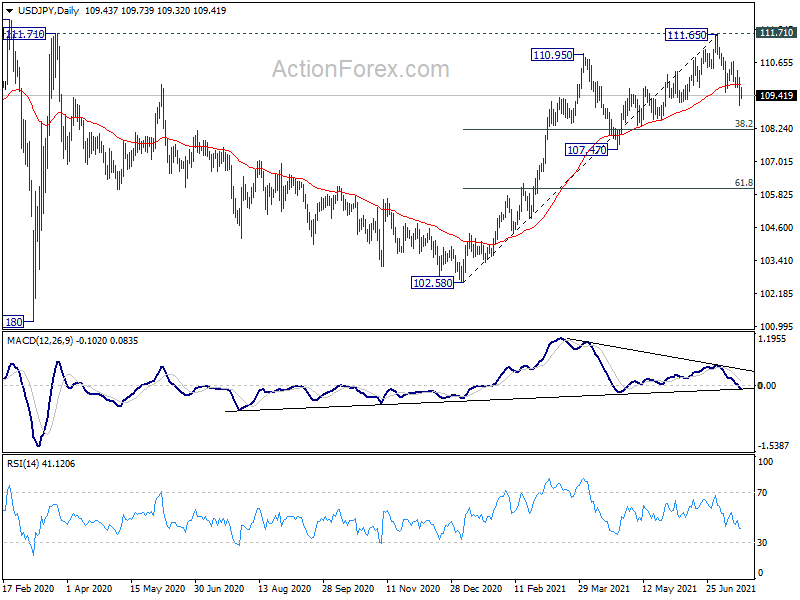
In the bigger picture, medium term outlook is staying neutral with 111.71 resistance intact. Sustained trading below 55 day EMA would argue that the pattern from 101.18 is starting another falling leg, that could head back to 102.58 support and below. For now, outlook won't turn bullish as long as 111.71 resistance holds, even in case of strong rebound.
US: Housing Starts Rise Again in June
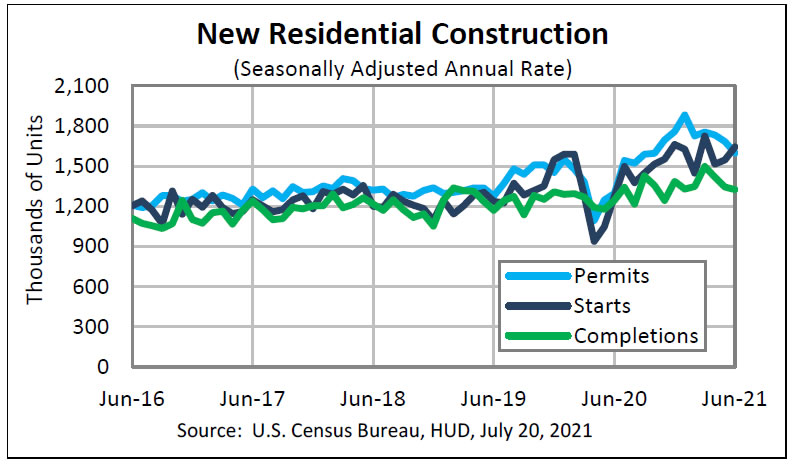
- Housing starts increased by 97k units in June to 1,643k (annualized), beating expectations for a modest expansion to 1,590k. Revisions to the prior months' data subtracted 26k units from the overall tally.
- Single family construction led the way (+69k, +6.3% m/m), while the multifamily segment rose 28k (+6.2% m/m).
- Building permits declined by 85k units to 1,598k (annualized). Permitting in the single family segment decreased by 71k, and was complemented by a pullback in multifamily permit applications (-14k).
- Monthly gains were concentrated in the West (+48k) and South (+78k), while the Northeast (-12k) and Midwest (-17k) recorded moderate declines.
Key Implications
- New housing construction remains healthy with starts and permits in line with post-pandemic highs. Headline starts are above the six-month (1,583k) and 12-month (1,546k) moving averages. The multifamily segment also showed resiliency as the lifting of pandemic-era restrictions in urban centers increased the appeal of urban living.
- Single-family sales have slowed through the early months of 2021, reflecting some softening in demand. Meanwhile, the supply of housing has been slowly recovering with months' supply of new single-family homes rising since October 2020, and supply of existing homes ticking higher since the turn of the year. There is still some room for improvement on the supply side and the market can certainly absorb additional construction projects in the pipeline without risk of becoming overbuilt.
- With permitting activity slowing, we anticipate some normalization in housing construction in the second half of 2021. Fortunately, newly-falling mortgage rates and the recent declines in lumber prices should help with affordability of new builds, while healthy labor market gains add to the pool of potential buyers.
GBP/USD Mid-Day Outlook
Daily Pivots: (S1) 1.3628; (P) 1.3703; (R1) 1.3752; More....
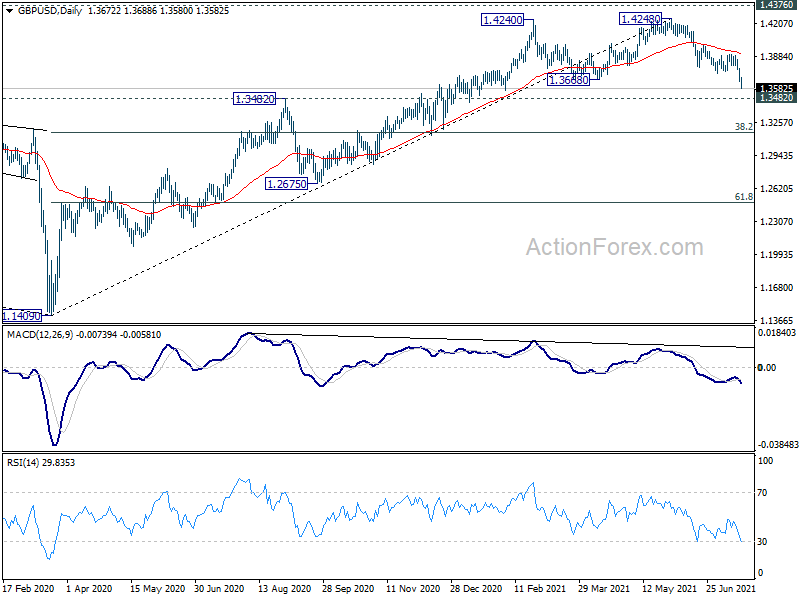
GBP/USD's fall accelerates to as low as 1.3586 so far and intraday bias remains on the downside for 1.3482 key support. Decisive break there will indicate that it's already correcting whole up trend from 1.1409. Next target will then be 38.2% retracement of 1.1409 to 1.4248 at 1.3164. On the upside, above 1.3688 minor resistance will turn intraday bias neutral first. But further fall will remain in favor as long as 1.3908 resistance holds.
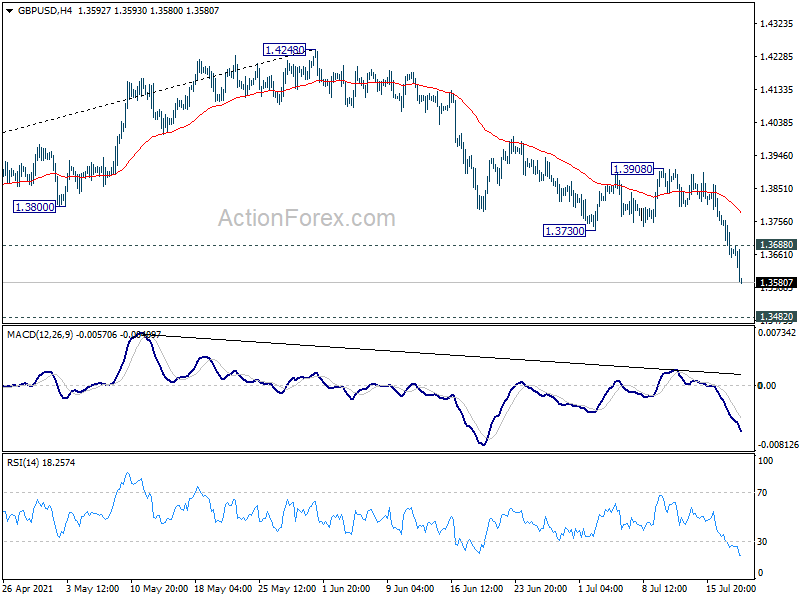
In the bigger picture, as long as 1.3482 resistance turned support holds, up trend from 1.1409 should still continue. Decisive break of 1.4376 resistance will carry larger bullish implications. However, firm break of 1.3482 support will argue that the rise from 1.1409 has completed. GBP/USD would then be seen in another leg of long term range pattern between 1.1409 and 1.4376. Deeper fall could then be seen to 61.8% retracement of 1.1409 to 1.4248 at 1.2493, and even below.
Sterling and Kiwi Fall on Fragile Market Sentiments, Dollar Strong
Overall sentiments in the financial markets remain rather fragile today, despite some stabilization. Major European indexes are trading slight up while DOW futures also gains over 150 pts at the time of writing. But there appears to be little support for treasury yield, with Germany 10-year yield below -0.4 handle at -0.42. US 10-year yield is also extending freefall, appearing to be targeting 1% handle eventually. In the currency markets, Dollar overtakes Yen as the strongest today. New Zealand Dollar is currently the weakest, catching up with others, Sterling is also rather weak, as selloff intensifies in crosses too.
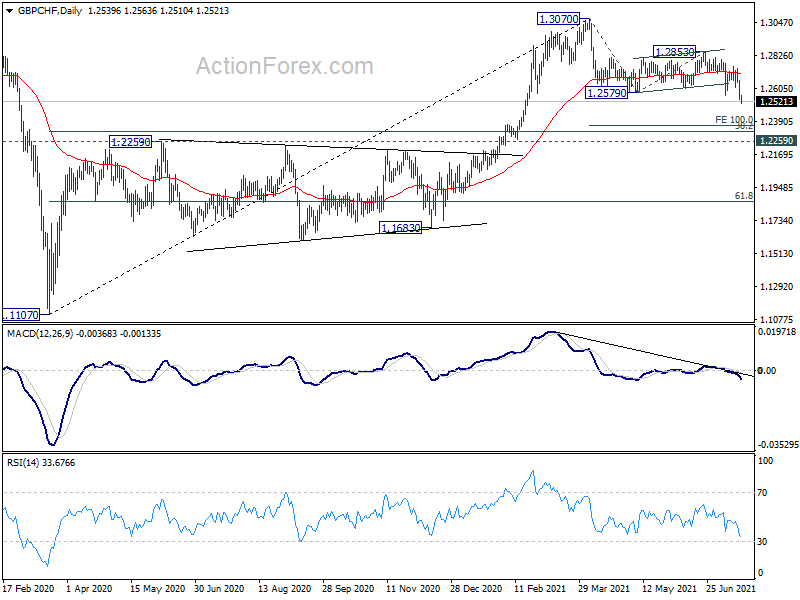
Technically, we'd pay some attention to European-Sterling crosses for the rest of the week. EUR/GBP's rally is accelerating and break of 0.8670 resistance will solidify that case that it's resuming whole rebound from 0.8470. That is, we could see further upside acceleration through 0.8718 resistance quickly. Meanwhile, GBP/CHF also broke out to the downside this week, resuming the fall from 1.3070. Such decline could also accelerate down to 100% projection of 1.3070 to 1.2579 from 1.2853 at 1.2362 before finding a bottom that.
In Europe, at the time of writing, FTSE is up 0.34%. DAX is up 0.15%. CAC is up 0.66%. Germany 10-year yield is down -0.050 at -0.433. Earlier in Asia, Nikkei dropped -0.96%. Hong Kong HSI dropped -0.84%. China Shanghai SSE dropped -0.07%. Japan 10-year JGB yield dropped -0.0033 to 0.014.
US building permits dropped to 1.598m in June, housing starts rose to 1.643m
US building permits dropped -5.1% mom to 1.598m annualized rate in June, below expectation of 1.690m. It's nonetheless 23.3% above June 2020 rate of 1.296m. Housing starts rose 6.3% mom to 1.643m annualized rate, above expectation of 1.590m. It's also 29.1% above June 2020 level of 1.273m.
Eurozone current account surplus at EUR 12B in May
Eurozone current account recorded EUR 12B surplus in May, down from April's EUR 22B. In the 12 months to May, current account surplus amounted to EUR 310B (2.7% of Eurozone GDP), up from EUR 228B (2.0%) one year earlier.
In the financial account, Eurozone residents' net acquisition of non-euro area portfolio investment securities totalled EUR 950B, in the 12 months to May. Non-residents' net acquisitions of Eurozone area portfolio investment securities totalled EUR 187B.
Germany PPI rose 1.3% mom, 8.5% yoy in June, versus expectation of 1.2% mom, 8.5% yoy. Swiss Trade surplus widened to CHF 5.53B versus expectation of EUR 5.12B.
RBA Minutes: Conditions for rate hike won't be met until 2024
In the minutes of July 5 meeting, RBA reiterated that the "central scenario implied that the conditions for an increase in the cash rate would not be met until 2024". However, "fast-than expected" recovery over the course of 2021 had "widened the range of alternative plausible scenarios for the economic outlook", and thus, "the cash rate over the period to November 2024". Hence, it decided to retain April 2024 bond as the target bond, rather than extending the horizon to November 2024 bonds.
On the decision on the size of weekly bond purchases, it noted that "the economic outcomes had been materially better than earlier expected and the outlook had improved". And, "in light of these improvements and the agreed decision-making framework, members decided to adjust the weekly purchases from $5 billion to $4 billion and agreed to review the rate of purchases at the November 2021 meeting."
NZD/USD downside breakout, heading to 0.68 handle
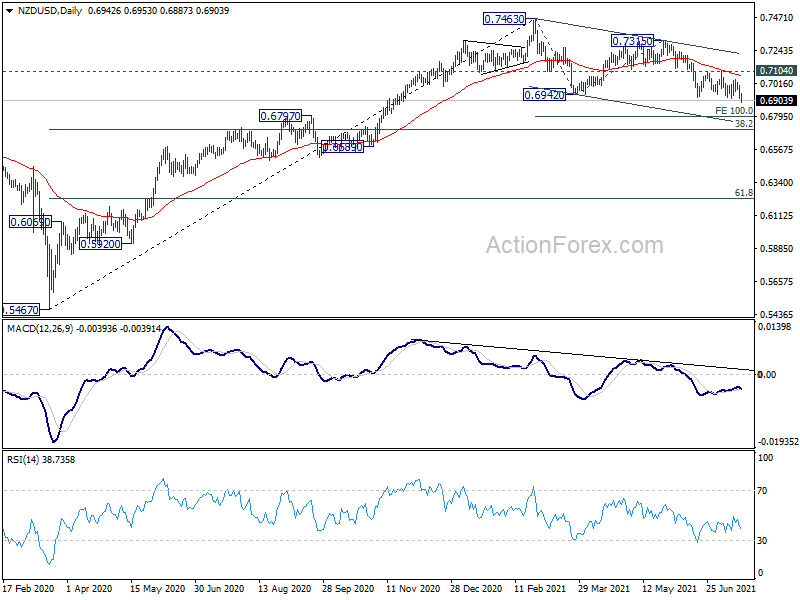
NZD/USD finally follows other commodity currencies and breaks out to the downside today. Overall risk-off sentiments overwhelm speculations of RBNZ rate hike. Technically, fall from 0.7463 is seen as a correction to whole up trend from 0.5467. Outlook will stay bearish as long as 0.7104 resistance holds. Next target is 100% projection of 0.7463 to 0.6942 from 0.7315 at 0.6794 before completion.
For now, we'd look for strong support around 38.2% retracement of 0.5467 to 0.7463 at 0.6701 to complete the correction. But we'll keep monitoring downside momentum, as well as development in the risk markets closely, to reassess the outlook.
GBP/USD Mid-Day Outlook
Daily Pivots: (S1) 1.3628; (P) 1.3703; (R1) 1.3752; More....
GBP/USD's fall accelerates to as low as 1.3586 so far and intraday bias remains on the downside for 1.3482 key support. Decisive break there will indicate that it's already correcting whole up trend from 1.1409. Next target will then be 38.2% retracement of 1.1409 to 1.4248 at 1.3164. On the upside, above 1.3688 minor resistance will turn intraday bias neutral first. But further fall will remain in favor as long as 1.3908 resistance holds.
In the bigger picture, as long as 1.3482 resistance turned support holds, up trend from 1.1409 should still continue. Decisive break of 1.4376 resistance will carry larger bullish implications. However, firm break of 1.3482 support will argue that the rise from 1.1409 has completed. GBP/USD would then be seen in another leg of long term range pattern between 1.1409 and 1.4376. Deeper fall could then be seen to 61.8% retracement of 1.1409 to 1.4248 at 1.2493, and even below.
Economic Indicators Update
| GMT | Ccy | Events | Actual | Forecast | Previous | Revised |
|---|---|---|---|---|---|---|
| 23:30 | JPY | National CPI Core Y/Y Jun | 0.20% | 0.20% | 0.10% | |
| 01:30 | AUD | RBA Minutes | ||||
| 06:00 | CHF | Trade Balance (CHF) Jun | 5.53B | 5.12B | 4.95B | 4.85B |
| 06:00 | EUR | Germany PPI M/M Jun | 1.30% | 1.20% | 1.50% | |
| 06:00 | EUR | Germany PPI Y/Y Jun | 8.50% | 8.50% | 7.20% | |
| 08:00 | EUR | Eurozone Current Account May | 11.7B | 24.3B | 22.8B | 22.1B |
| 12:30 | USD | Housing Starts Jun | 1.64M | 1.59M | 1.57M | 1.55M |
| 12:30 | USD | Building Permits Jun | 1.60M | 1.69M | 1.68M |
US building permits dropped to 1.598m in June, housing starts rose to 1.643m
US building permits dropped -5.1% mom to 1.598m annualized rate in June, below expectation of 1.690m. It's nonetheless 23.3% above June 2020 rate of 1.296m.
Housing starts rose 6.3% mom to 1.643m annualized rate, above expectation of 1.590m. It's also 29.1% above June 2020 level of 1.273m.
NZD/USD downside breakout, heading to 0.68 handle
NZD/USD finally follows other commodity currencies and breaks out to the downside today. Overall risk-off sentiments overwhelm speculations of RBNZ rate hike. Technically, fall from 0.7463 is seen as a correction to whole up trend from 0.5467. Outlook will stay bearish as long as 0.7104 resistance holds. Next target is 100% projection of 0.7463 to 0.6942 from 0.7315 at 0.6794.
For now, we'd look for strong support around 38.2% retracement of 0.5467 to 0.7463 at 0.6701 to complete the correction. But we'll keep monitoring downside momentum, as well as development in the risk markets closely, to reassess the outlook.
Yen Drifting, Japan CPI As Expected
The Japanese yen has settled down on Tuesday, after starting the week with strong gains. In the European session, USD/JPY is trading at 109.38, down 0.04% on the day. The yen remains relatively strong and dropped as low as 109.05 on Wednesday, its lowest level since May.
Japan inflation ticks higher
Japan's inflation levels remain low, but there was a slight rise in CPI in June, thanks to higher energy prices. Nationwide Core CPI edged up 0.2% after a 0.1% gain in May. Core inflation remains well short of the BoJ's inflation target of 2%. There are no inflationary pressures building up in the economy, unlike the situation in the eurozone, the UK and the US. In these areas, pent-up demand has been unleashed as the economy has reopened, triggering a jump in economic activity as well as inflation. However, in Japan, the domestic economy remains subdued, and the little inflation that we're seeing is due to the surge in oil prices. Most businesses have been reluctant to pass onto the consumer the increased costs of raw materials, and this has also curbed inflation.
The weak Japanese economy is unlikely to resurge anytime soon. Last week, the Bank of Japan revised lower its growth forecast for the current fiscal year to March due to Covid-19. The BoJ quarterly report stated that the economy would grow 3.8%, down from the previous estimate of 4.0%.
Despite the weak economy, the yen has gained strength of late, rising 1.47% in July. This is due to the yen's safe-haven status, which has made the currency attractive, as risk appetite is falling fast. The spike in the Delta Covid variant is taking a toll on the major economies and has alarmed investors, who are shedding their risky assets in favor of something safer. If Covid continues to spread, the yen should be able to make further inroads against the dollar.
USD/JPY Technical
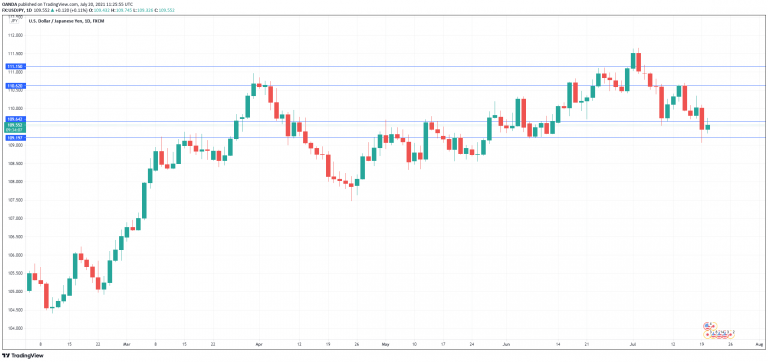
- USD/JPY faces resistance at 110.62 and 111.15
- On the downside, the pair is testing support at 109.64. Below, we find support at 109.19
EURJPY Hits 4-Month Low, Pivot Area Could Be Nearby
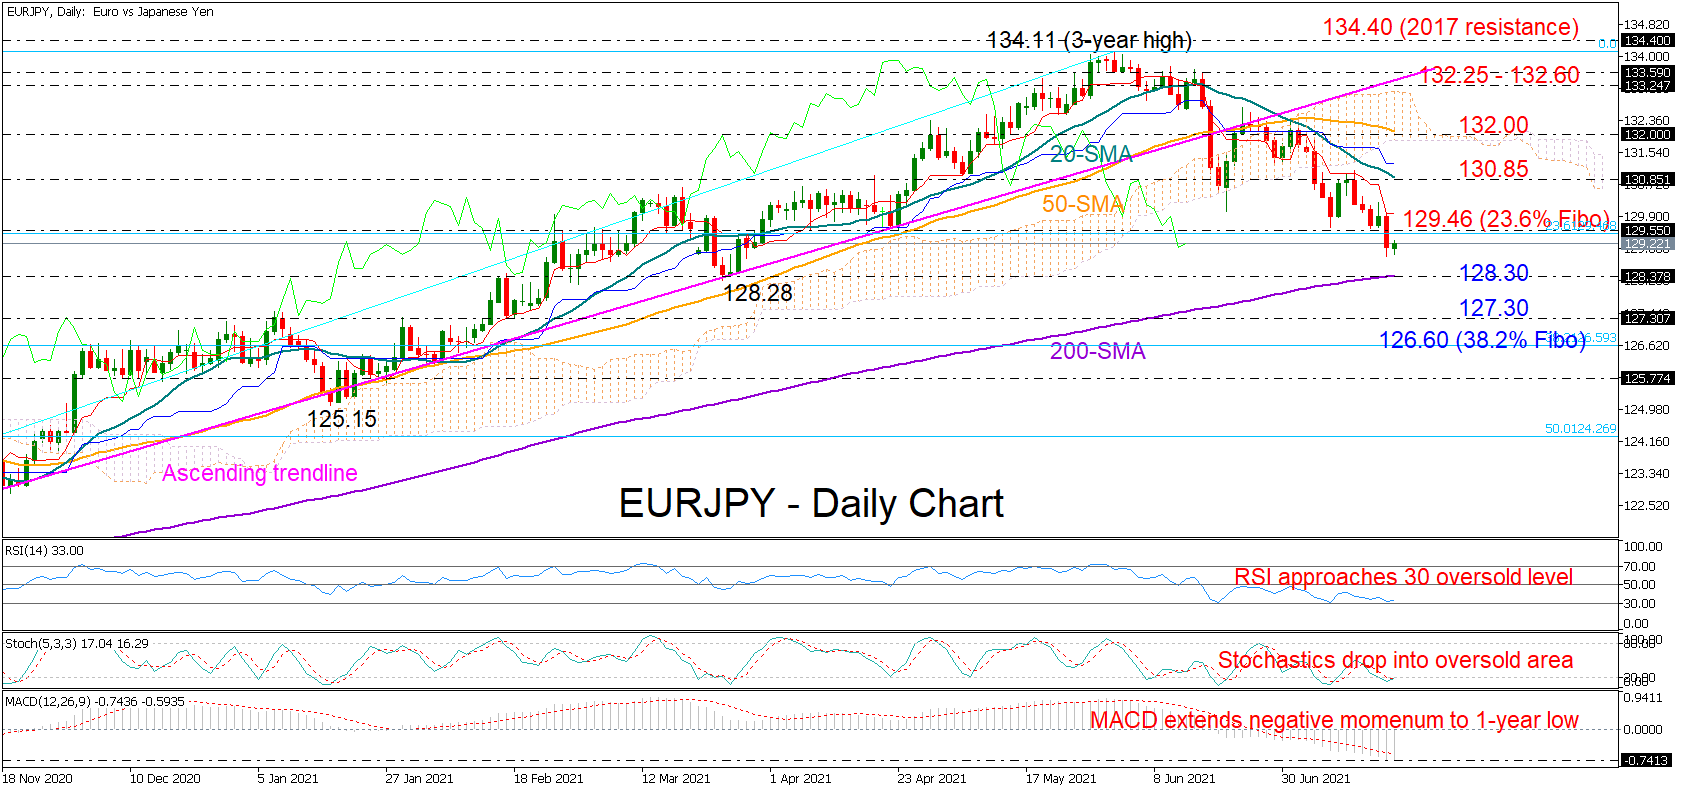
EURJPY raised the odds for a bearish trend reversal following the drop below the long-term ascending trendline and the Ichimoku cloud, with the 20- and 50-day simple moving averages (SMAs) further enhancing the bearish case after their recent intersection.
The price is currently consolidating Monday’s losses around a four-month low of 128.87 as the downward direction in momentum indicators keep favoring additional price declines. That said, the RSI and the Stochastics are flirting again with oversold levels, providing some optimism that the sell-off could soon take a breather perhaps near 128.30, where the 200-day SMA coincides with the March lows.
If the 128.30 area proves easy to break, the bears could accelerate to test the 127.30 restrictive region ahead of the 38.2% Fibonacci retracement of the long 114.42 – 134.11 upleg at 126.60.
On the upside, the 23.6% Fibonacci of 129.46 may attract some interest, though a close above the red Tenkan-sen line at 130.00, which has been capping upside corrections over the past two weeks, could be the key for an extension towards the 20-day SMA currently at 130.85. Moving higher, the bulls could slow down near the 132.00 mark and the 50-day SMA before speeding up to challenge the broken ascending trendline probably within the former resistance zone of 132.25 – 132.60.
In brief, EURJPY is in a bearish situation in the short-term picture, though with the price approaching an important support region and the momentum indicators hovering near oversold territory, an upside reversal cannot be excluded.