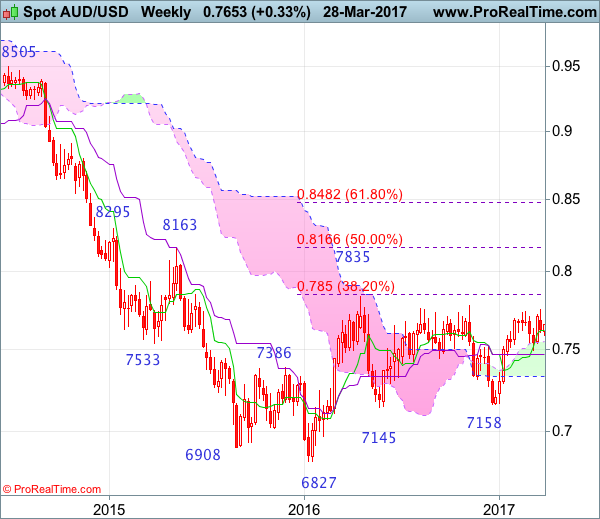
Weekly
• Last Candlesticks pattern: Morning star
• Time of formation: 2 Jan 2017
• Trend bias: Sideways
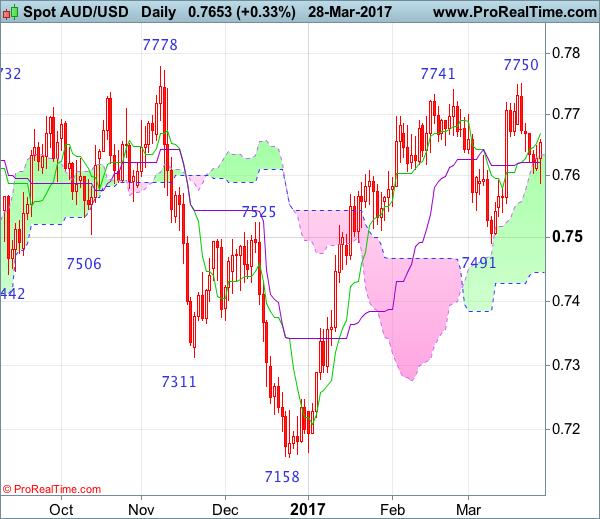
Daily
• Last Candlesticks pattern: Long white candlestick
• Time of formation: 15 Mar 2017
• Trend bias: Up
Although aussie has retreated after rising to 0.7750 last week and consolidation below this level would be seen initially, reckon downside would be limited to 0.7555 and bring another rise later, above said resistance at 0.7750 would bring test of previous chart resistance at 0.7778, however, break there is needed to retain bullishness and confirm early erratic upmove from 0.6827 (2016 low) has resumed for retest of 0.7835 (2016 high) first but near term overbought condition should prevent sharp move beyond 0.7900-10 and price should falter well below psychological resistance at 0.8000.
On the downside, expect pullback to be limited to 0.7585-90 and 0.7555 should hold, bring another rise later to aforesaid upside targets. A daily close below 0.7555 would risk another test of indicated support at 0.7491 but only break there would abort and signal recent rise from 0.7158 has ended, risk weakness to the lower Kumo (now at 0.7445) and then towards 0.7400 which is likely to hold from here, bring another upmove later.
Recommendation: Hold long entered at 0.7600 for 0.7800 with stop below 0.7500.
On the weekly chart, although aussie rose marginally to 0.7750 last week, as price has retreated after faltering below indicated previous resistance at 0.7778, suggesting initial consolidation below this level would be seen and pullback to the upper Kumo (now at 0.7545) cannot be ruled out before prospect of another rise later to 0.7750 and possibly test of 0.7778 resistance but as broad outlook remains consolidative, reckon upside would be limited and price should falter below 2016 high at 0.7835. Looking ahead, only above this level would suggest an upside break of recent established broad range has occurred, bring further subsequent rise to 0.7900 and later towards psychological level at 0.8000.
On the downside, whilst pullback to the upper Kumo (now at 0.7545) cannot be ruled out, price should stay well above support at 0.7491 and bring another rise later. A weekly close below said support at 0.7491 would suggest top is formed, bring test of the Kijun-Sen (now at 0.7468), a sustained breach below this level would signal the rise from 0.7158 has ended instead, risk further fall to 0.7400.