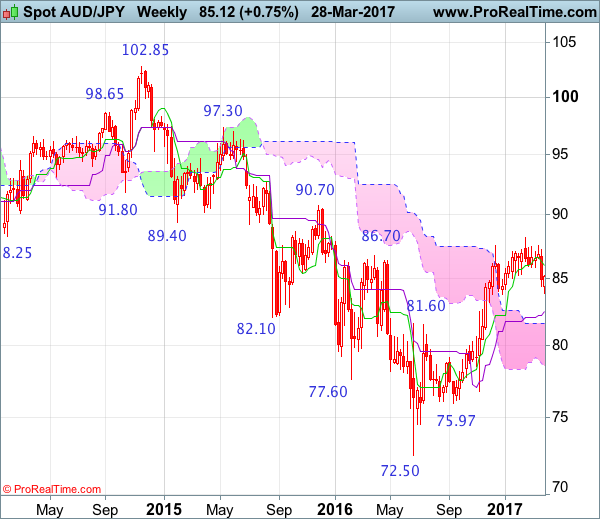
Weekly
• Last Candlesticks pattern: Shooting star
• Time of formation: 12 Dec 2016
• Trend bias: Down
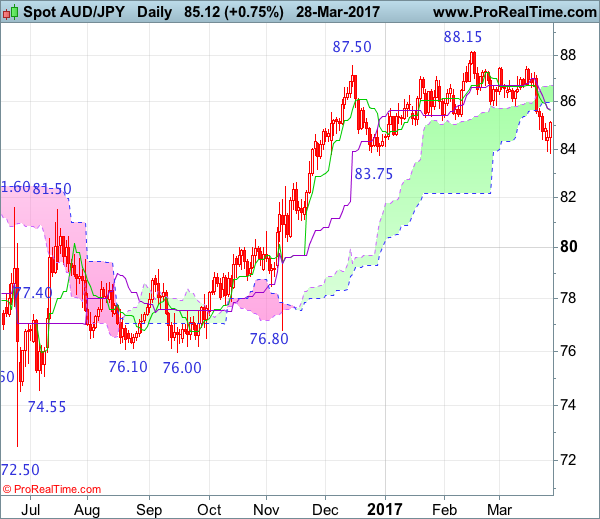
Daily
• Last Candlesticks pattern: Shooting star
• Time of formation: 1 Nov 2016
• Trend bias: Up
As assize’s decline has accelerated after break indicated support at 85.85, suggesting top has been formed at 88.15 earlier and consolidation with downside bias is seen for the erratic decline from there to bring retracement of medium term upmove, hence further fall to 83.75 would be seen, however, a daily close below there is needed to retain bearishness and extend fall from 88.15 to 83.00-10 but near term oversold condition should limit downside to 82.50-60 and 82.00 should remain intact, price should stay well above support at 81.10-15, bring rebound later.
On the upside, whilst initial recovery to 84.90-00 cannot be ruled out, reckon upside would be limited to the Kiun-Sen (now at 85.66) and bring another decline later. Only a daily close above previous support at 85.85 (now resistance) would abort and signal low is formed instead, bring a stronger rebound to 86.20 and possibly towards the upper Kumo (now at 86.68) but upside should be limited to 87.00 and price should falter well below resistance at 87.50, bring another decline later.
Recommendation: Sell at 85.70 for 83.70 with stop above 86.70.
On the weekly chart, last week’s selloff together with the breach of previous support at 85.85 suggest top has been formed at 88.15 earlier and consolidation with downside bias is seen for retracement of recent upmove, hence weakness to 83.75 and possibly 83.00-10 is likely, however, reckon the Kijun-Sen (now at 82.49) would limit downside and the upper Kumo (now at 81.61) should remain intact, bring rebound later due to near term oversold condition.
On the upside, expect recovery to be limited to 85.50-55 and the Tenkan-Sen (now at 86.00) should hold, bring another decline later. A weekly close above 86.00 would risk rebound to 86.50-60 but reckon upside would be limited to 87.00 and resistance at 87.50 should hold, bring another retreat. Only a break above 87.50 would revive bullishness and signal the pullback from 88.15 top has ended, bring retest of 88.15. Looking ahead, a break of 88.15 resistance would confirm the rise from 72.50 low has resumed for retracement of early downtrend to 88.50 and then 89.00-10 but reckon upside would be limited to psychological resistance at 90.00 and previous resistance at 90.70 should remain intact.