
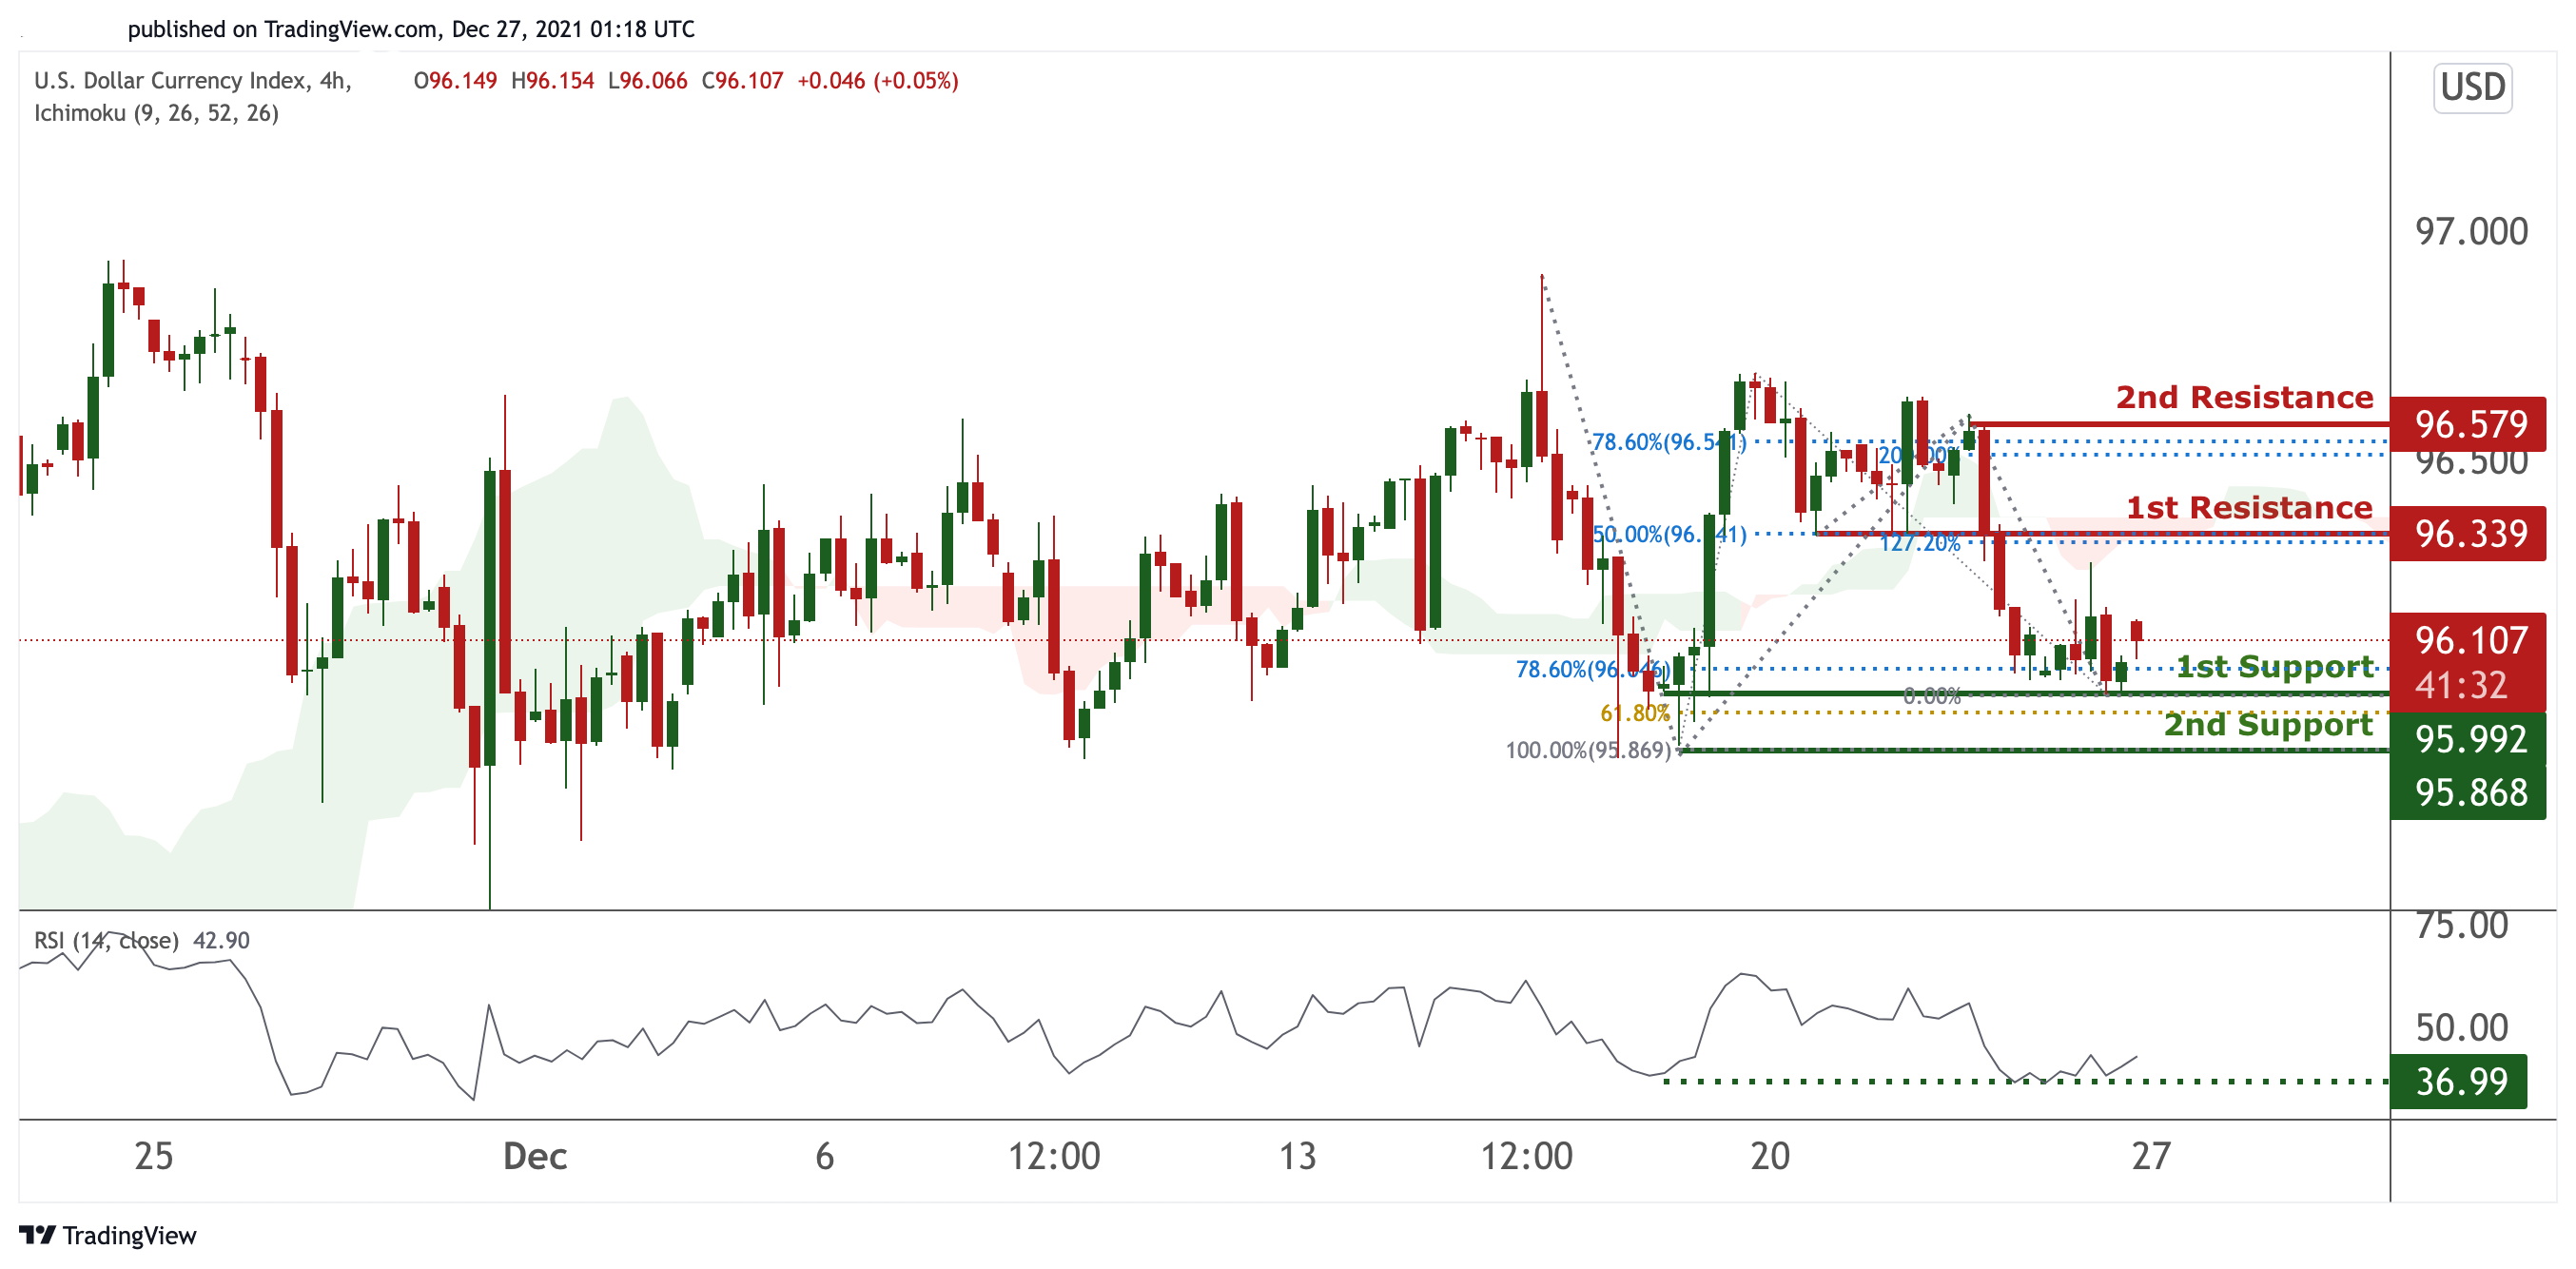
DXY:
On the H4, prices are on bearish momentum and abiding to our descending trendline. We see the potential for a dip from our 1st resistance at 95.927 in line with 23.6% Fibonacci retracement and 38.2% Fibonacci retracement towards our 1st support in line 95.566 with 100% Fibonacci extension. Prices are trading below our MA 40 and ichimoku clouds showing further bearish momentum.
Areas of consideration:
H4 time frame, 1st resistance at 95.827
H4 time frame, 1st support at 95.566
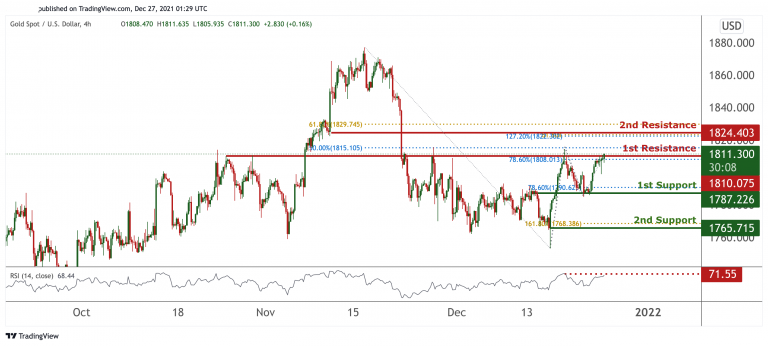
XAU/USD (GOLD):
On the H4, Prices are at a pivot and strong graphical overlap. We see the potential for a dip from our 1st resistance at 1834.195 in line with 61.8% Fibonacci retracement towards our 1st support at 1813.845 in line with 50% and 50% Fibonacci retracement. RSI are at levels where dips previously occurred. Alternatively, breaking our 1st resistance could find prices could climb higher towards our 2nd resistance at 1849.77 in line with 161.8% Fibonacci Projection and 78.6% Fibonacci retracement.
Areas of consideration:
H4 1st support at 1813.845
H4 1st resistance at 1834.195
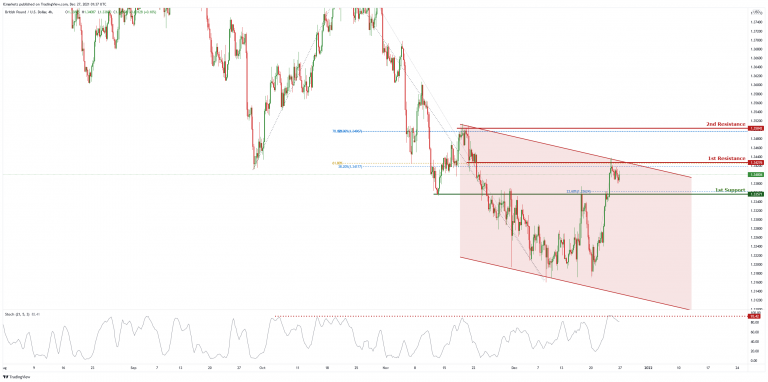
GBP/USD
On the H4 chart price is abiding by an ascending trendline and near 1st support of 1.35037 which is 78.6% Fibonacci projection. Price can potentially go to the 1st resistance level of 1.36034 which is also 100% Fibonacci projection and 61.8% Fibonacci retracement. Our bullish bias is supported by the ichimoku cloud indicator as price is trading above it.
Areas of consideration :
H4 1st resistance at 1.36034
H4 1st support at 1.35037
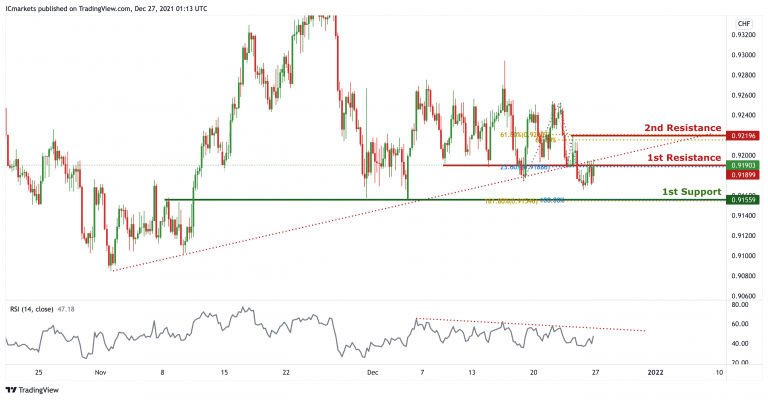
USD/CHF
In reference to last week’s analysis, price indeed dropped to the 1st Support at 0.91011. On the H4 timeframe, price broke out of the ascending trendline support, signifying potential bearish momentum. We can expect price to drop from 1st Resistance in line with 50% Fibonacci retracement and 61.8% Fibonacci projection towards 1st Support in line with 78.6% Fibonacci projection. Our bearish bias is further supported by price holding below the Ichimoku cloud and RSI is abiding to the descending trendline resistance.
Areas of consideration:
Watch 1st Support at 0.91011
Watch 1st Resistance at 0.91562
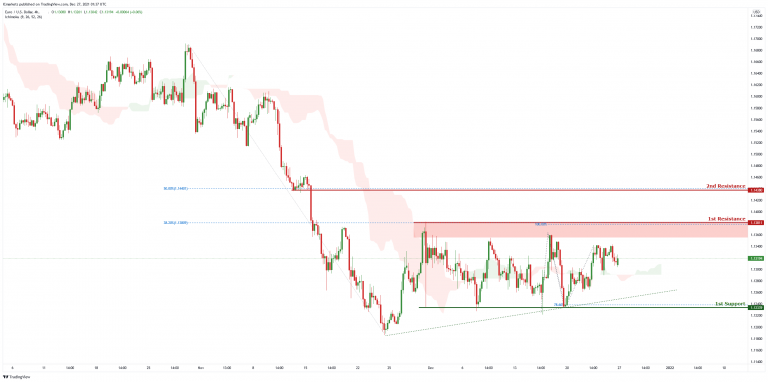
EUR/USD :
On the H4 chart price is near 1st resistance level of 1.13854 which is also 100% Fibonacci projection and 38.2% Fibonacci retracement. Price can potentially dip to the 1st support level of 1.12339 which is also 23.6% Fibonacci retracement and 78.6% Fibonacci projection. Our bearish bias is supported by the stochastic indicator as it is near resistance level.
Areas of consideration :
H4 1st resistance at 1.13854
H4 1st support at 1.12339
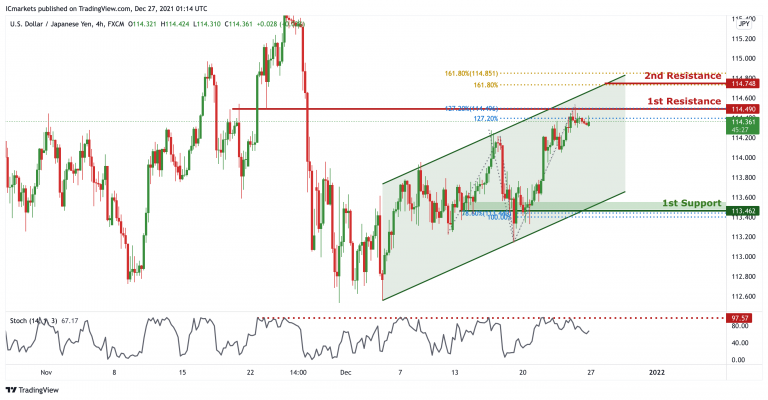
USD/JPY
On the H4 timeframe, price is abiding to the ascending channel, showing an overall bullish momentum. However, we can expect a short term bearish momentum and drop from 1st resistance in line with graphical overlap resistance and 127.2% Fibonacci projection towards 1st Support in line with graphical overlap support, 78.6% Fibonacci projection and 38.2% Fibonacci retracement. Our bearish bias is further supported by stochastic where the %K line dropped from the resistance.
Areas of consideration:
H4 1st resistance level 115.175
H4 1st support level 114.418
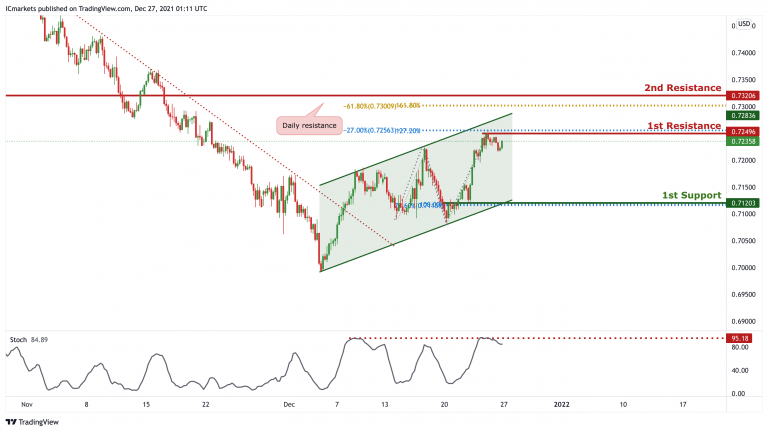
AUD/USD:
On the H4, price is reacting in an ascending channel, signifying bullish momentum. However, price is currently at a resistance, we can expect price to drop from 1st Resistance in line with 127.2% Fibonacci projection ,127.2% Fibonacci Extension and 50% Fibonacci retracement towards 1st Support in line with 100% Fibonacci projection and 78.6% Fibonacci retracement. Our short-term bearish bias is further supported by the stochastic indicator where the %K line is approaching the resistance level.
Areas of consideration:
H4 1st Support level 0.71203
H4 1st resistance level 0.72773
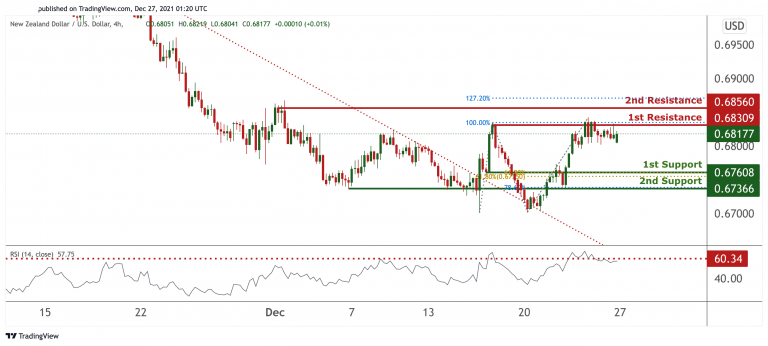
NZD/USD:
On the H4, prices are consolidating in an ascending triangle. We see the potential for further bullish movement towards our 1st resistance at 0.68676 in line with 127.2% Fibonacci extension and 161.8% Fibonacci projection. Technical indicators are showing momentum. Alternatively, breaking our 1st support may find prices dipping towards our 2nd support at 0.67886.
Areas of consideration:
H4 time frame, 1st resistance at 0.68676
H4 time frame, 1st support at 0.68211
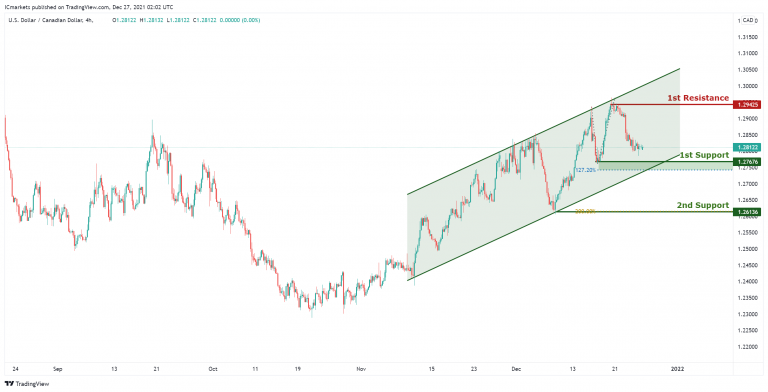
USD/CAD:
On the Weekly, with price at the resistance of the ichimoku indicator and horizontal swing high resistance, we have a bearish bias that price will drop from our 1st resistance at 1.26839 which is in line with horizontal overlap resistance, 78.6% Fibonacci retracement level to 1st support at 1.26036, which is in line with horizontal swing low support. Alternatively, price may rise up to our 2nd resistance at 1.27654, which coincides with horizontal swing high resistance, 38.2% Fibonacci retracement level .
Areas of consideration:
H4 time frame, 1st support at 26036
H4 time frame, 1st resistance at 26839
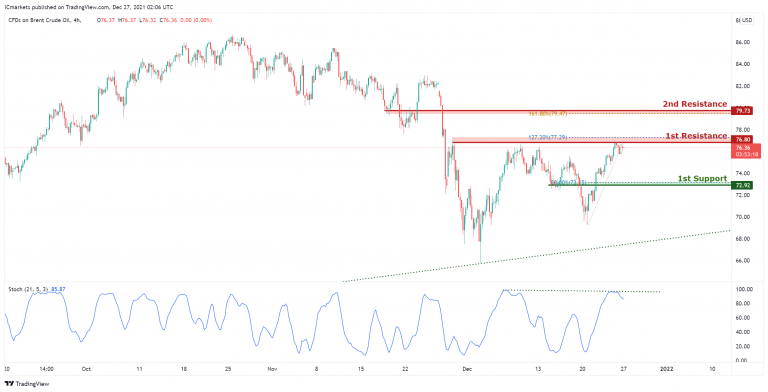
OIL:
On the H4, with price on a downwards trend on the stochastics indicator, we have a bearish bias that price will drop from our 1st resistance at 79.4 which is in line with horizontal overlap resistance, 161.8% Fibonacci extension and 100% Fibonacci projection level to 1st support at 75.52, which is in line with horizontal overlap support, 38.2% Fibonacci retracement level. Alternatively, price may rise up to our 2nd resistance at 82.83, which coincides with horizontal swing high resistance and 127.2% Fibonacci extension level .
Areas of consideration:
H4 time frame, 1st resistance of 40
H4 time frame, 1st support of 52
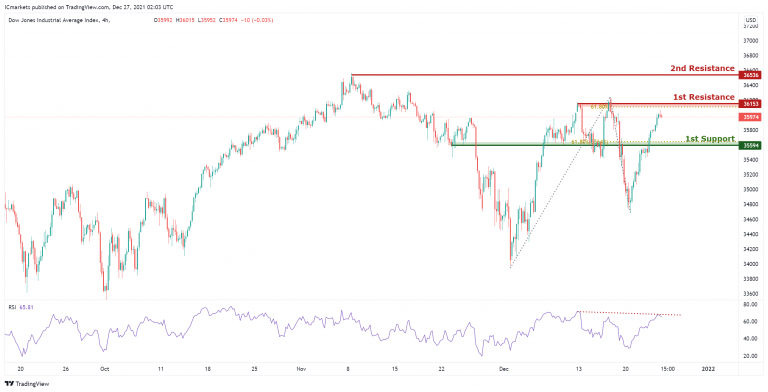
Dow Jones Industrial Average:
On the H4, with price rejecting the resistance on the stochastics indicator, we have a bearish bias that price will drop from our 1st resistance at 36555 which is in line with horizontal swing high resistance and 127.2% Fibonacci extension level to 1st support at 35971, which is in line with horizontal overlap support, 38.2% Fibonacci retracement level. Alternatively, price may rise up to our 2nd resistance at 37124, which coincides with horizontal swing high resistance and 161.8% Fibonacci extension .
Area of consideration:
4H resistance at 36555
4H support at 35971


