
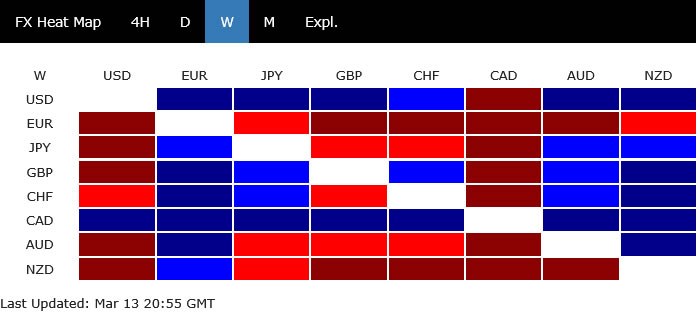
“King Dollar” returned with a vengeance last week as global markets were jolted by a volatile mix of geopolitical escalation and a dramatic repricing of U.S. monetary policy expectations. The greenback surged broadly, pushing Dollar Index back above the psychological 100 level. The question now is how long Dollar can keep the “throne”. To answer that, we need to examine the macro forces driving markets and how they could evolve in the coming weeks.
The ultimate driver remains the Iran war. Since the February 28 escalation between the U.S./Israel and Iran, the conflict has entered what analysts describe as a phase of “horizontal escalation,” widening its geographic and economic reach. Reports indicate that the Strait of Hormuz—responsible for roughly a quarter of global seaborne oil shipments in 2025—has effectively been closed to major tanker traffic. Recent U.S. strikes targeting Iranian installations on Kharg Island have further raised fears that part of Iran’s export capacity could be permanently removed from global supply.
The energy shock triggered violent reactions in oil markets, with WTI crude spiking toward $120 before stabilizing slightly below $100 by the end of the week. The International Energy Agency attempted to ease the situation by announcing a record 400 million barrel emergency release, the largest in its 52-year history. Yet traders remain skeptical. The release represents only about 20 days of disrupted supply if Hormuz remains blocked, meaning a sizeable “war premium” is still embedded in crude prices.
The consequences have quickly spread across global markets. Inflation fears have triggered a sharp hawkish shift in central bank expectations. In particular, markets are increasingly abandoning forecasts for Fed rate cuts in 2026. U.S. Treasury yields surged toward the critical 4.3% zone, equities sold off sharply with DOW threatening 45,000 psychological level, and Dollar Index pushed above 100 for the first time in months. If the Iran war drags on—as Iranian strategists increasingly signal through their “endurance” doctrine—elevated oil prices, rising yields, and fragile risk sentiment could allow the Dollar to keep its “throne” for longer than many expected.
Why the War May Drag On
One reason markets remain reluctant to unwind the recent risk-off move is the growing belief that the Iran conflict would not end quickly. Analysts note that the war has already moved beyond a conventional exchange of airstrikes and into a broader regional confrontation involving shipping lanes, energy infrastructure, and proxy forces. Even after heavy U.S. and Israeli strikes, Iran has continued missile and drone attacks across the region while disrupting traffic through the Strait of Hormuz.
Meanwhile, neither Washington nor Tehran appears willing to compromise. U.S. officials insist the campaign will continue until strategic objectives are achieved, while Iran’s leadership has signaled a willingness to prolong the confrontation and impose economic pressure through energy disruption
More importantly, reopening the Strait is not simply a political decision but a complex military and logistical challenge. Naval mines, tanker attacks, and insurance withdrawals have effectively halted commercial traffic, and experts warn that securing the waterway could take weeks even in the absence of active fighting.
Most analysts are now pricing in a conflict duration of three weeks to two months. However, the “horizontal” nature of the attacks means that even if the main bombing stops, the guerrilla-style disruption of oil and shipping could haunt markets for the rest of 2026.
Dollar Index Breaks Above 100, Eyes 101.13 as Trend Reversal Builds
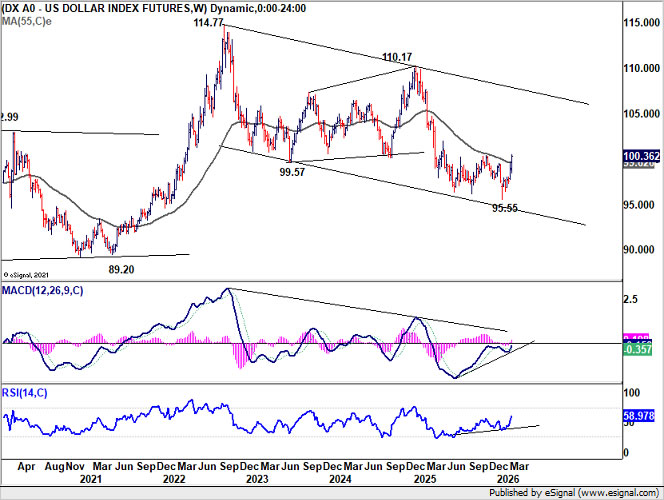
Dollar Index extended its rebound from the 95.55 low last week and pushed above the key 100.39 structural resistance, marking an important technical development. Equally notable was the close above the 55 W EMA (now at 99.62), which reinforces the view that medium-term momentum has turned bullish after the prolonged decline through much of 2025.
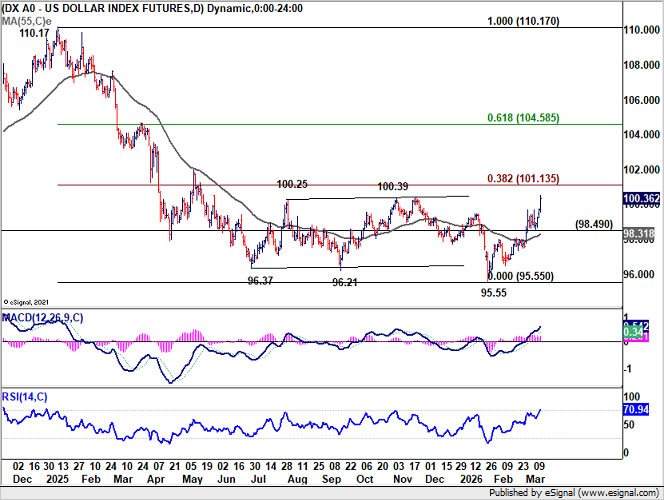
The immediate focus now turns to 100% retracement of 110.17 (2025 high) to 95.55 at 101.13. Decisive break above this level would confirm that the medium-term bottom at 95.55 is likely already in place. Such a move would open the door for a strong rally recovery toward 61.8% retracement at 104.58, particularly if the current macro backdrop of elevated oil prices, rising yields, and persistent geopolitical tensions continues to support Dollar demand.
On the downside, rejection by 101.13 followed by a break of 98.49 support would suggest that the current rebound has run its course. In that case, the move from 95.55 could be interpreted as merely a corrective bounce within the broader bearish structure that dominated 2025.
From a longer-term perspective, a sustained move above 101.13 would also carry important implications for the Dollar’s structural outlook. Such a breakout would likely push Dollar Index through the 55 M EMA (now at 102.31).
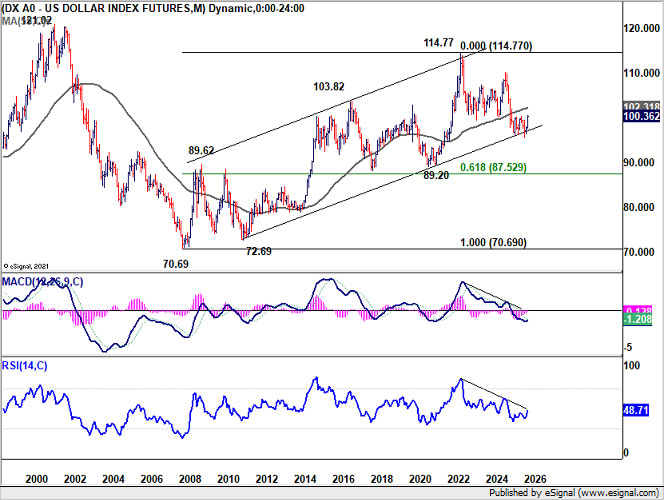
That would strengthening the case that the entire down trend from 114.77 (2022 high) to 95.55 trough was a completed three-wave correction, after hitting the long-term rising channel floor that has been in place since 2010. If that scenario unfolds, it could signal that the broader uptrend originating from the 70.69 low in 2008 is probably resuming.
DOW Correction Targets 45,000 as Risk-Off Pressure Builds
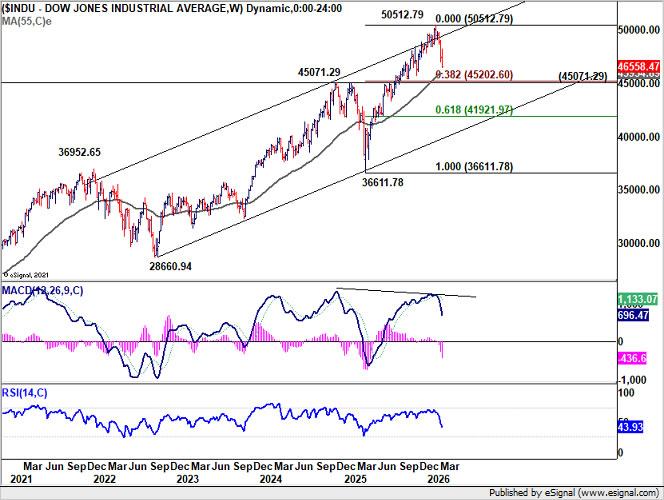
DOW’s decline from the 50,512.79 medium term accelerated last week, reflecting the sharp shift in global market sentiment triggered by rising oil prices and the hawkish repricing of interest rate expectations. The index finished the week on a weak note, signaling that sellers remain in control for the time being.
Technically, the correction still has room to run as long as 48,220.54 resistance caps any near-term rebounds. The next major downside objective is the 38.2% retracement of 36,611.78 to 50,512.79 at 45,202.60.
Even if the index briefly slips below 45,202.60, strong support could emerge near 45,000 psychological threshold. This region aligns closely with the former 2024 peak at 45,071.29 and could attract bargain hunting that stabilizes the correction.
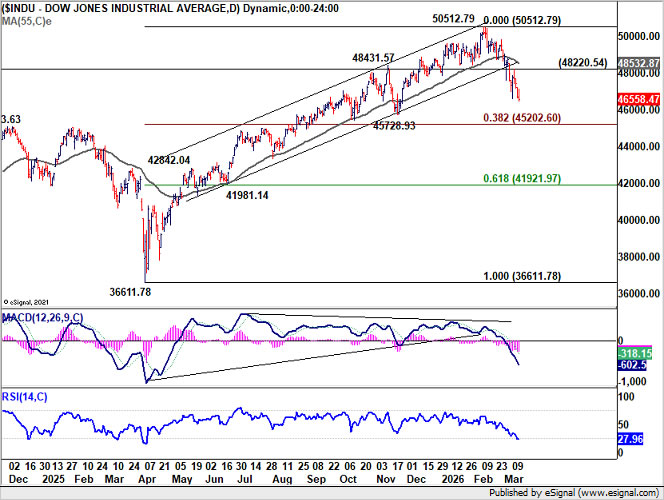
Nevertheless, decisive breakdown below 45,000 would mark a significant shift in the technical outlook. Such a move would imply that the entire advance from the 36,611.78 base (2025 low) is reversing and could expose DOW to deeper fall toward 61.8% retracement at 41,921.97. A decline of that magnitude would likely amplify risk-off flows and further support Dollar.
10-Year Yield Eyes 4.311 Break as Inflation Fears Intensify
US 10-year Treasury yield extended its rebound from 3.956 last week and accelerated sharply higher to close at 4.285. The move reflects a dramatic repricing of inflation and monetary policy expectations as markets digest the energy shock triggered by the Iran war and the growing likelihood that the Fed at current restrictive level for longer.
The immediate focus now turns to 4.311, a key structural resistance level. Decisive break above there would suggest that the converging triangle pattern that began from the 4.809 (2025 high) has already completed with five waves down to 3.956. Such a breakout would signal that yields are entering a fresh medium-term rally phase.
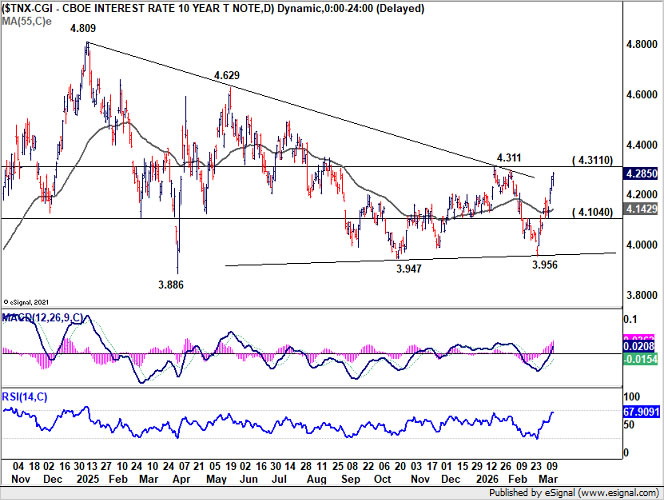
If confirmed, the next upside target would lie at 4.629 resistance, with the possibility of a further move back toward the 4.809 peak should inflation expectations continue to rise. A sustained yield rally of that magnitude would likely intensify pressure on equity markets while providing a powerful tailwind for Dollar.
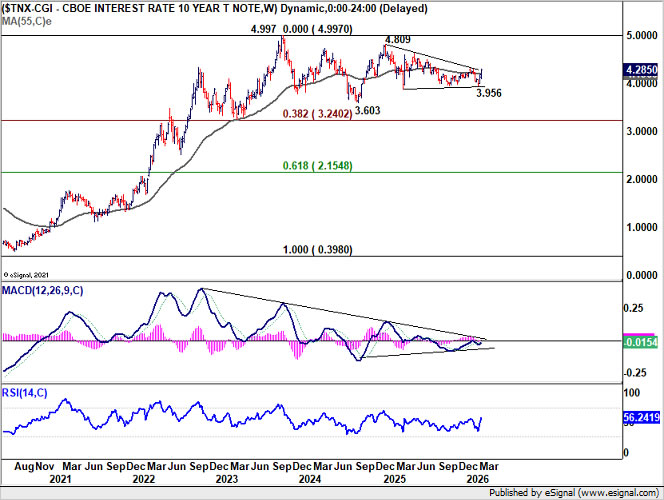
On the other hand, rejection at 4.311 followed by a break below 4.104 support would suggest that the current move higher is merely another leg within the broader consolidation pattern. In that case, Treasury yields could remain trapped within a range as markets wait for clearer signals on inflation and central bank policy.
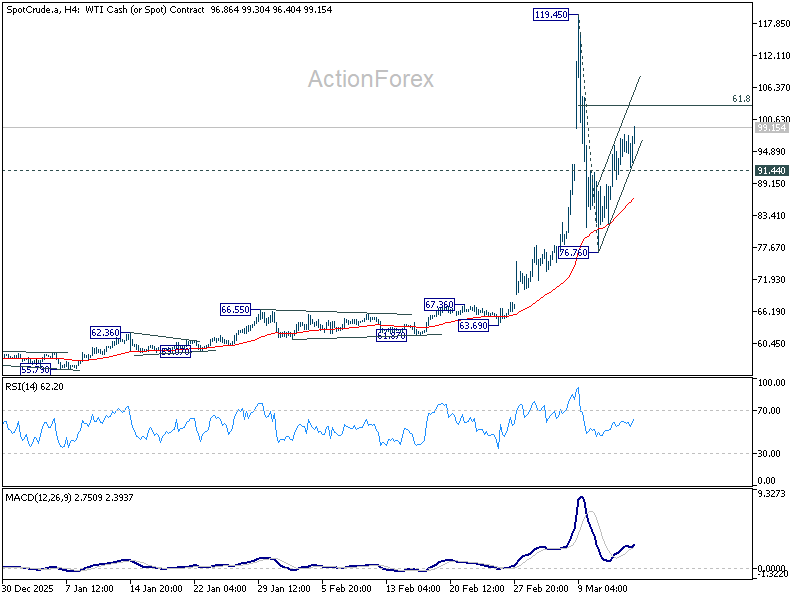
WTI Rebound Should Slow Above 103
WTI crude is now in a consolidation phase following last week’s extreme volatility. Technically, the rebound from 76.76 is seen as the second leg of the corrective pattern from 119.45. As long as the 91.44 support level holds, the near-term bias remains tilted to the upside, with the next key objective located at 61.8% retracement of 119.45 to 76.76 at 103.14.
Upward momentum should begin to fade once prices breaks above 103.14 that region. WTI should form a near-term top below 119.45 and reverse from there to extend the corrective pattern.
That said, any decisive acceleration above 103.14 would be a warning signal that the consolidation has ended. Such a breakout could trigger a renewed rally through 119.45 peak, especially if supply disruptions in the Middle East persist.
NZD Slides as RBNZ Outlook Diverges From Global Hawkish Shift
New Zealand Dollar was the worst performer for the week, with NZD/USD being the top mover, down -2.12%. That reflects the widening policy divergence between RBNZ and other major economies where markets are increasingly pricing in renewed tightening.
While investors are now betting on rate hikes from central banks such as the RBA and potentially others, expectations for the RBNZ remain far more cautious. Policymakers face a difficult dilemma: raising rates to combat oil-driven inflation risks pushing an already fragile economy into a deeper recession.
Additionally, the RBNZ continues to emphasize the presence of significant spare capacity in the economy, which policymakers believe will limit the risk of second-round inflation effects. As a result, the most hawkish outcome markets currently expect from the central bank is simply maintaining current policy settings throughout the year.
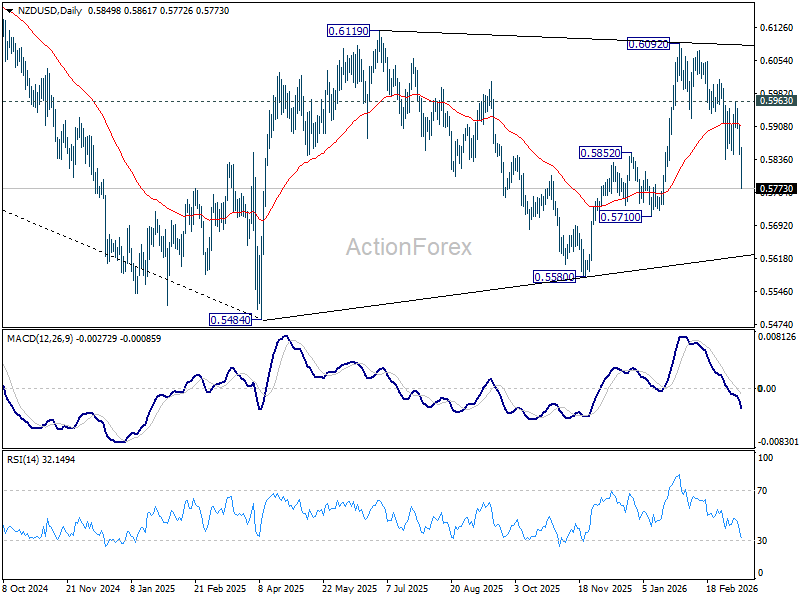
Technically, NZD/USD’s accelerated decline and break of 0.5852 support turned resistance suggest that rebound from 0.5580 has completed.
Risk will stay on the downside as long as 0.5963 resistance holds. Further break of 0.5710 support will argue that whole consolidation pattern from 0.5484 (2025 low) has completed with three waves to 0.6092. That should bring deeper fall through 0.5580 support to retest 0.5484.
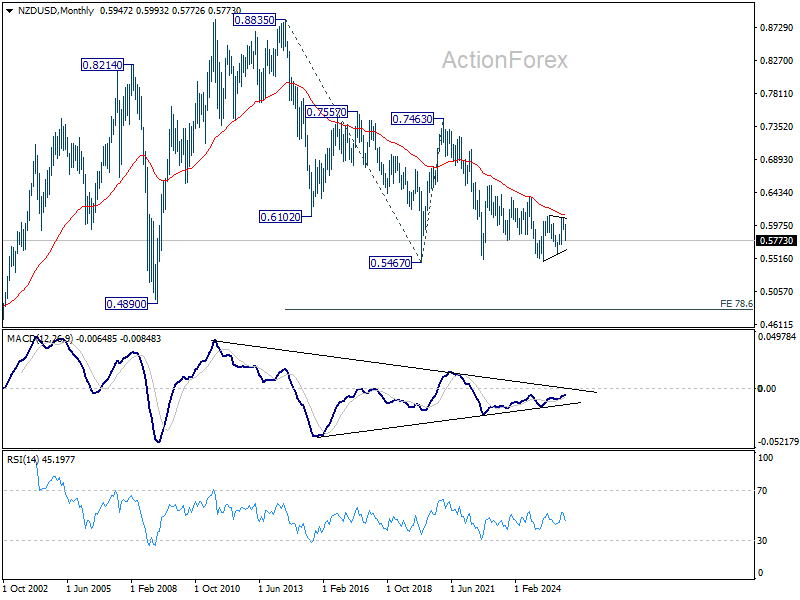
In the long term picture, current development suggests that NZD/USD was rejected by the falling 55 EMA (now at 0.6117) again. Firm break of 0.5484/67 support zone will resume whole down trend from 0.8835 (2014 high). Next medium term target will be 0.4890 (2009 low).
EUR/USD Weekly Outlook
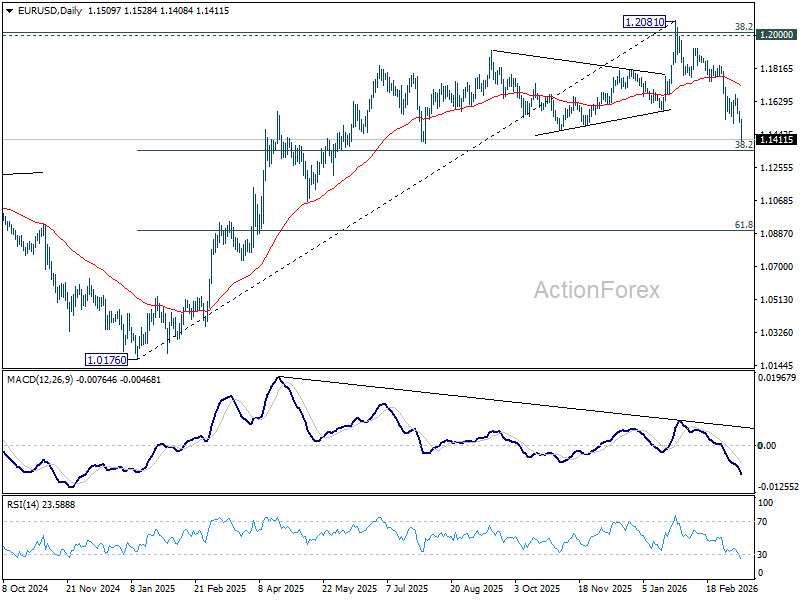
EUR/USD’s fall from 1.2081 resumed by breaking through 1.1506 last week. Initial bias stays on the downside this week for 38.2% retracement of 1.0176 to 1.2081 at 1.1353 next. Firm break there will target 61.8% projection at 1.0904 next. Overall, near term outlook will stay cautiously bearish as long as 1.1666 resistance holds, in case of another recovery.
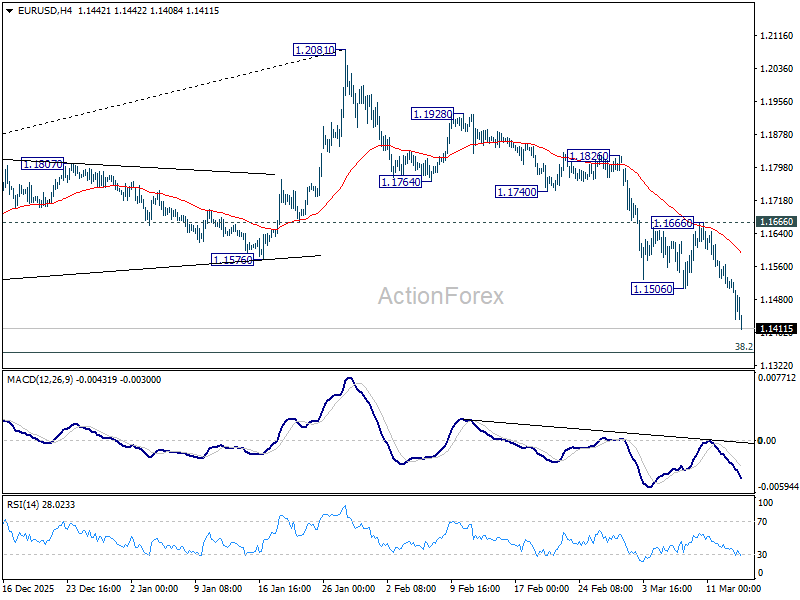
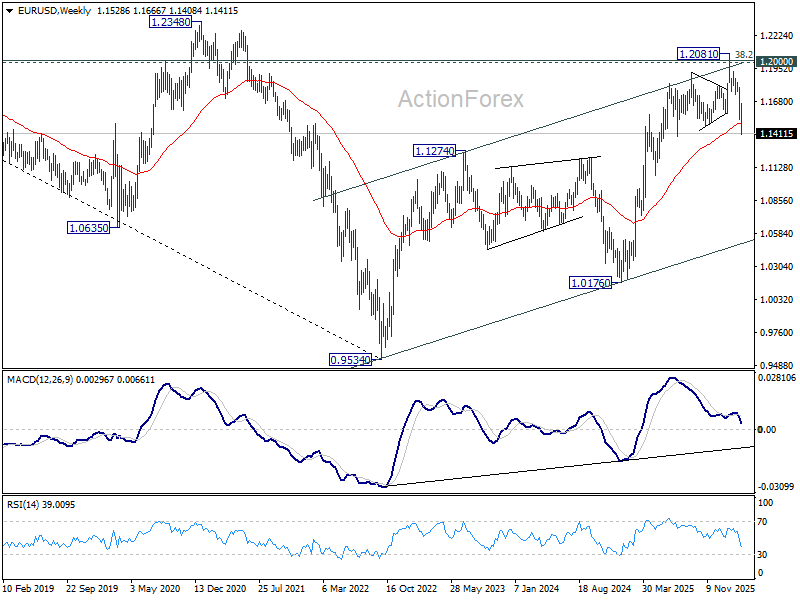
In the bigger picture, the break of 55 W EMA (now at 1.1495) confirms rejection by 1.2 key cluster resistance level. The whole up trend from 0.9534 (2022 low) might have completed as a three wave corrective rise too. In either case, deeper fall is now expected to long term channel support (now at 1.0528. Risk will stay on the downside as long as 1.2081 holds, in case of recovery.
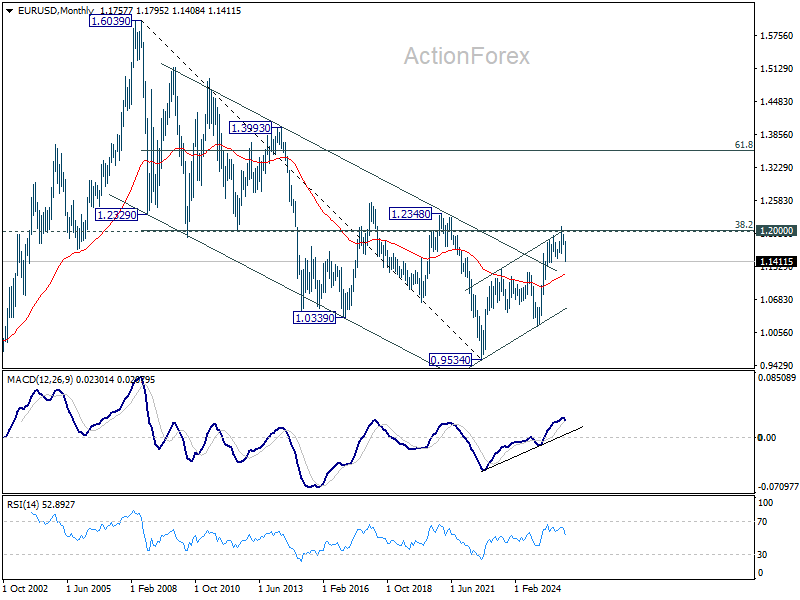
In the long term picture, 38.2% retracement of 1.6039 to 0.9534 at 1.2019, which is close to 1.2000 psychological level is the key for the outlook. Rejection by this level will keep the multi decade down trend from 1.6039 (2008 high) intact, and keep outlook neutral at best. However, decisive break of 1.2000/19, will suggest long term bullish trend reversal, and target 61.8% retracement at 1.3554.


