
Key Highlights
- Gold started a fresh decline below the $4,600 support.
- A major bearish trend line is forming with resistance at $4,660 on the 4-hour chart.
- WTI Crude Oil regained traction and climbed above $105.
- EUR/USD could continue to move down toward 1.1550.
Gold Price Technical Analysis
Gold failed to surpass $4,800 and trimmed gains against the US Dollar. The price dipped below $4,700 and $4,600 to enter a bearish zone.
The 4-hour chart of XAU/USD indicates that the price even declined below $4,550, the 100 Simple Moving Average (red, 4 hours), and the 200 Simple Moving Average (green, 4 hours). A low was formed at $4,480, and the price is now consolidating losses.
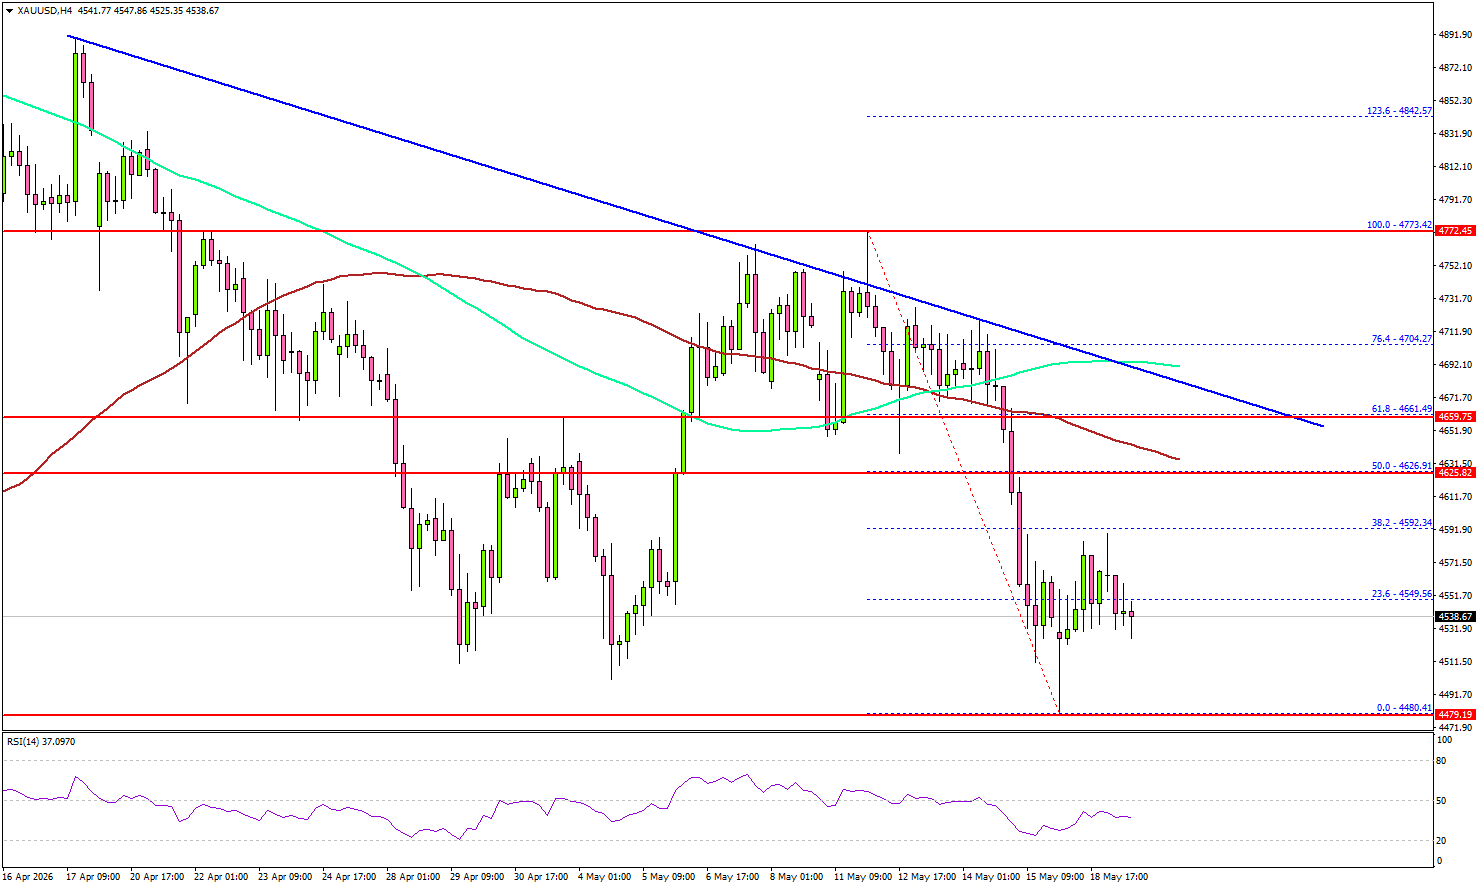
On the upside, immediate resistance is $4,590. The next major resistance sits near $4,625. The main resistance could be near $4,660 and the 61.8% Fib retracement level of the downward move from the $4,773 swing high to the $4,480 low.
There is also a major bearish trend line forming with resistance at $4,660. A clear move above $4,660 could open the doors for more upside. In the stated case, the bulls could aim for a move toward $4,700 or even $4,720.
If there is another decline, Gold might find bids near the $4,480 level. The first major support sits at $4,450. The next support could be $4,400, below which the price might slide to $4,320. The main support sits at $4,200. Any more losses might call for a test of $4,065 or even $4,000 in the coming days.
Looking at WTI Crude Oil, the price regained bullish momentum above $105 and might continue to rise in the short term.
Economic Releases to Watch Today
- FOMC Meeting Minutes.


