
Commodity currencies trade generally higher today. New Zealand Dollar leads the way following improvement in RBNZ’s own preferred core inflation measures. Australian Dollar is also firm after RBA reaffirmed that the next move is likely a hike rather than a cut. Yen continues to trade as the weakest one even though stocks are turning mixed. Dollar follows as the second weakest as recent consolidation continues.
In other markets, Nikkei is back today and trades up 0.94% at the time of writing. Singapore Strait Times is up 0.45%. But China SSE is down -1.01% at 2785, back below 2800 handle. That drags down Hong Kong HSI by -1.0%. Overnight, DOW closed up 0.18% at 25064.36 but NASDAQ and S&P 500 lost -0.26% and -0.1% respectively. For now, thanks to Dollar’s pull back, Gold is still holding above 1236.66, struggling around 1240. WTI crude oil suffered steep selling yesterday and is now pressing 68, after taking out 70 handle rather decisively.
Technically, while Dollar is broadly weak, it’s staying in familiar range against Euro, Sterling, Aussie, Canadian and Yen. It’s just in consolidation mode. Yen is also seen losing downside momentum against Euro and Sterling. The Pound will be a focus today with job data featured. 0.8808 in EUR/GBP is a level to watch.
New Zealand Dollar jumps as RBNZ sectoral factor model CPI improved
New Zealand CPI rose 0.4% qoq, 1.5% yoy in Q2, accelerated from Q1’s 0.5% qoq and 1.1% yoy. The headline number missed expectations of 0.5% qoq, 1.6% yoy. However New Zealand Dollar later reacts to RBNZ’s own prices data. Most notably, the sectoral factor model CPI rose to 1.7% yoy in Q2. There were continuous improvements since last year from 1.4% in Q3 2017 to 1.5% in Q4 2017 to 1.6% in Q1 2018.
The sectoral factor model CPI was created by RBNA to estimate the common component of inflation in the CPI basket, the tradable basket, and the non-tradable basket, based upon separate factors for the tradable and non-tradable sectors. The data excludes GST. It’s one of RBNZ’s preferred core inflation gauge.
RBA reiterates next move is more likely an increase
RBA minutes of July meeting cleared up some confusions in the market as it stated that “members continued to agree that the next move in the cash rate would more likely be an increase than a decrease.” Still, as the progress of wage growth and inflation will “likely to be gradual, “there was no strong case for a near-term adjustment in monetary policy.” Instead, “the Board assessed that it would be appropriate to hold the cash rate steady and for the Bank to be a source of stability and confidence while this progress unfolds.” Overall, the minutes reaffirmed the tightening bias of the central bank, but the rate hike will only happen at least deep into mid-2019.
On the economy, RBA noted that recent data has been consistent with the central forecast of GDP growth at a bit above 3% over 2018 and 2019. Non-mining business investments had “contributed significantly” to growth in Q1. Public infrastructure investment and business conditions “remained positive”. But consumption “remained a source of uncertainty”. Labor market outlook remain positive for solid growth ahead, with “vacancy rate” risen to historical high. And the conditions will lead to gradual decline in unemployment rate and push up wages.
Minneapolis Fed Kashkari: ‘This time is different’ are the four most dangerous words
Minneapolis Fed President Neel Kashkari warned of the recession signal from flattening yield curve in a paper. Over the past 2.5 years, the difference between 10 year yield and 2 year yield has dropped 134bps to 25bps today, a 10-year low. He warned that “if the Fed continues raising rates, we risk not only inverting the yield curve, but also moving to a contractionary policy stance and putting the brakes on the economy, which the markets are indicating is at this point unnecessary.”
And he added that “this time is different” are the “four most dangerous words in economics”. And such declaration should be a “warning that history might be about to repeat itself.
UK PM May got Brexit Customs Bill narrowly passed after conceding to Brexiteers
UK Prime Minister Theresa May narrowly avoided defeat yesterday on the Brexit Customs Bill in the Commons after conceding to four amendments of the Brexiteers. But the slim margin in vote showed once again the deep divisions between pro-EU Tories and Brexiteers that could heavily undermine May’s position in upcoming negotiations.
One amendment prevents UK from collecting taxes on behalf of the EU unless the rests of the EU does the same for the UK. It’s passed by 305 to 302 with 14 Tories rebelled. Another amendment ensures the UK is out of EU’s VAT regime and was passed by 303 to 300, with 11 Tories rebelled.
Debates will continue today with the Trade Bill going to the Commons. The bill allows the UK government to build new trade relationships with other countries after Brexit. Some pro-EU MPs who support staying in the EU customs union are pushing for some changes in wordings.
IMF: US initiated trade actions as biggest threat, could lower global growth by 0.5% by 2020
IMF released the July update of the World Economic Outlook. Chief Economist Maury Obstfeld said in the the group continued to project global growth of around 3.9% for 2018 and 2019. But “risk of worse outcomes has increased, even for the near term.” In particular, he noted that “risk that current trade tensions escalate further—with adverse effects on confidence, asset prices, and investment—is the greatest near-term threat to global growth.”
He added that the US has ” initiated trade actions affecting a broad group of countries” and “faces retaliation or retaliatory threats from China, the European Union, its NAFTA partners, and Japan, among others.” Based on their modeling, Obstfeld said the trade policy threats could lower global output by around 0.5% by 2020. The US is “especially” vulnerable as it’s the “focus of global retaliation”.
Global growth forecast was left unchanged at 3.9% in both 2018 and 2019. For advanced economies, 2018 growth forecast was revised down by -0.1% to 2.4%, 2019 growth forecast was left unchanged at 2.2%. US growth was forecast was left unchanged at 2.9% (2018) and 2.7% (2019). Eurozone growth was projected to be at 2.2% (2018, down -0.2%) and 1.9% (2019, down -0.1%). Japan growth was projected to be at 1.0% (2018, down -0.2%) and 0.9% (2019, unchanged). UK growth was projected to be at 1.4% (2018, down -0.2%) and 1.5% (2019, unchanged). China growth projections were unchanged at 6.6% (2018) and 6.4% (2019).
Elsewhere
UK employment data will be the main focus today. Canada will release manufacturing sales. US will release industrial production and NAHB housing index.
AUD/USD Daily Outlook
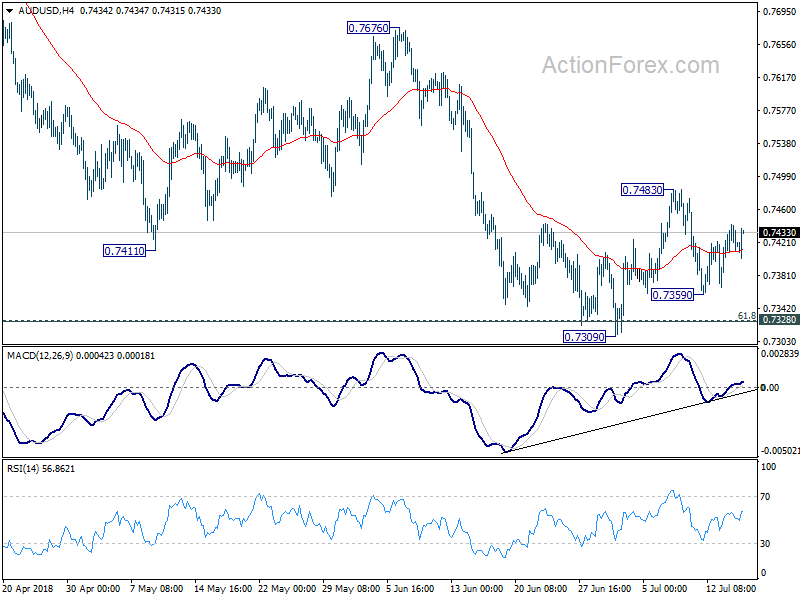
Daily Pivots: (S1) 0.7406; (P) 0.7424; (R1) 0.7440; More…
AUD/USD strengthens mildly today but stays in range of 0.7359/7483. Intraday bias remains neutral first. Outlook is unchanged that consolidation from 0.7309 could extend further and stronger recovery cannot be ruled out. But after all, upside should be limited below 0.7676 resistance to bring larger fall resumption. On the downside, below 0.7359 will target 0.7309 support first. Sustained trading below 0.7328 cluster support (61.8% retracement of 0.6826 to 0.8135 at 0.7326) will extend the fall from 0.8135 to 0.7158 support next.
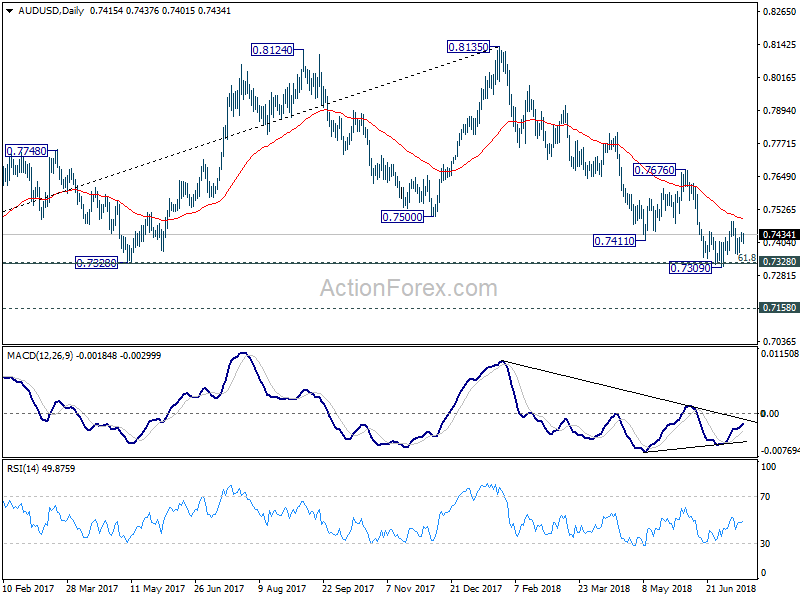
In the bigger picture, medium term rebound from 0.6826 is seen as a corrective move that should be completed at 0.8135. Deeper decline would be seen back to retest 0.6826 low. This will now remain the favored case as long as 0.7676 resistance holds.
Economic Indicators Update
| GMT | Ccy | Events | Actual | Forecast | Previous | Revised |
|---|---|---|---|---|---|---|
| 22:45 | NZD | CPI Q/Q Q2 | 0.40% | 0.50% | 0.50% | |
| 22:45 | NZD | CPI Y/Y Q2 | 1.50% | 1.60% | 1.10% | |
| 01:30 | AUD | RBA Minutes Jul | ||||
| 08:30 | GBP | Jobless Claims Change Jun | 2.3K | -7.7K | ||
| 08:30 | GBP | Average Weekly Earnings 3M/Y May | 2.50% | 2.50% | ||
| 08:30 | GBP | ILO Unemployment Rate 3Mths May | 4.20% | 4.20% | ||
| 12:30 | CAD | Manufacturing Sales M/M May | 0.60% | -1.30% | ||
| 13:15 | USD | Industrial Production M/M Jun | 0.50% | -0.10% | ||
| 13:15 | USD | Capacity Utilization Jun | 77.90% | |||
| 14:00 | USD | NAHB Housing Market Index Jul | 69 | 68 | ||
| 20:00 | USD | Net Long-term TIC Flows May | 34.3B | 93.9B |


