
The surge in oil price is the main focus today after Saudi Arabia and Russia agreed to extend production cut. WTI crude oil is now having 50 handle back in sight. Meanwhile, rise in oil price takes FTSE 100 to new record high at 7460.20. DAX also follow to record high at 12832.29. But both indices cannot ride on the initial strength and quickly pare back gains. Nonetheless, in the forex markets, commodity currencies follow and trade broadly higher. USD/CAD’s dip is now putting near term support at 1.3534 in focus. Elsewhere in the FX markets, Euro strengthens clearly against Dollar, Sterling and Yen.
Oil price surges on Saudi-Russia production deal
Oil price jumps today after Saudi Arabia and Russia agreed to extend the current production cut deal by another nine-month. Saudi Energy Minister Kahlid Al-Falih said at a joint press briefing that, "the agreement needs to be extended as we will not reach the desired inventory level" by the end of June. Meanwhile, Russian Energy Minister Alexander Novak emphasized that "everyone is committed" and there is no reason for any country to "quit". Under the current agreement, OPEC and other oil producers pledged to lower output by 1.8mbpd during the first half of 2017. With the new deal, production cut will be extended to March 2018. WTI crude oil hits as high as 49.52 so far today, comparing to last week’s close at 47.84 and this month’s low as 43.76. Canadian Dollar finally follows with USD/CAD dropping to as low as 1.3605 so far.
On the data front…
US Empire State manufacturing index dropped to -1 in May. Swiss PPI dropped -0.2% mom, rose 0.8% yoy in April. Japan machine tools orders rose 34.7% yoy in April. Domestic CGPI rose 2.1% yoy in April. Australia home loans dropped -0.5% in March. New Zealand retail sales rose 1.2% qoq in Q1.
The batch of data released from China today is generally weaker than expected. Retail sales rose 10.7% yoy in April, down from prior month’s 10.9% yoy and missed consensus of 10.8% yoy. Fixed asset investment rose 8.9% yoy, down from prior 9.2% and missed consensus of 9.1%. Industrial production rose 6.5% yoy, down from prior 7.6% yoy and missed expectation of 7.0% yoy. The set of data is in-line with recent PMIs, which showed loss of momentum in Q2 after a solid Q1.
USD/CAD Mid-Day Outlook
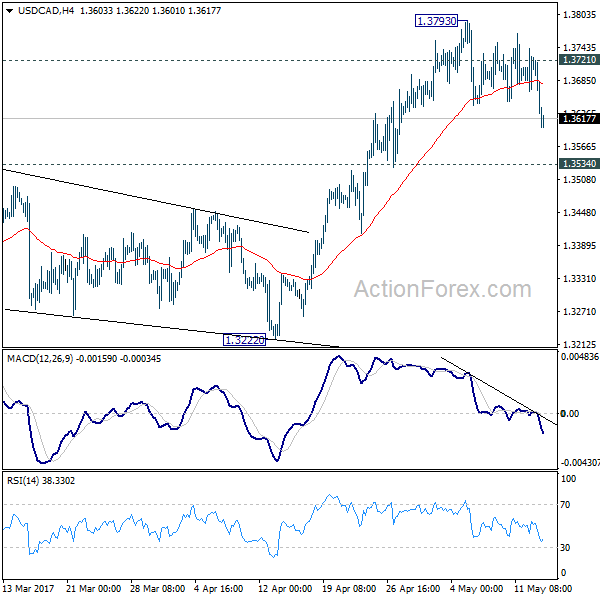
Daily Pivots: (S1) 1.3668; (P) 1.3705; (R1) 1.3745; More….
USD/CAD’s fall from 1.3793 resumes by diving to as low as 1.3600 so far. Based on accelerating downside momentum, intraday bias is cautiously on the downside for 1.3534 resistance turned support. Break there should confirm completion of the rise from 1.2968 and target 1.3222 support next. On the upside, above 1.3721 will turn bias back to the upside and target 1.3793 and above. However, as noted before, choppy rise from 1.2460 is seen as a corrective move. In case of an extension, upside should be limited by 1.3838 fibonacci level to bring reversal.
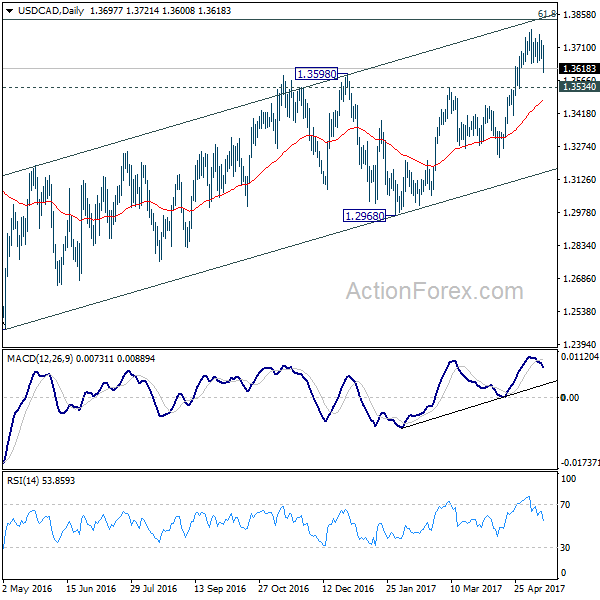
In the bigger picture, price actions from 1.4689 medium term top are seen as a correction pattern. The first leg has completed at 1.2460. Rise from 1.2460 is seen as the second leg and would end at around 61.8% retracement of 1.4689 to 1.2460 at 1.3838. Break of 1.3222 should indicate the start of the third leg while further break of 1.2968 should confirm. Nonetheless, sustained trading above 1.3838 would pave the way to retest 1.4689 high.
Economic Indicators Update
| GMT | Ccy | Events | Actual | Forecast | Previous | Revised |
|---|---|---|---|---|---|---|
| 22:45 | NZD | Retail Sales Ex Inflation Q/Q Q1 | 1.20% | 0.90% | 0.60% | 0.70% |
| 23:50 | JPY | Domestic Corporate Goods Price Index Y/Y Apr | 2.10% | 1.80% | 1.40% | |
| 01:30 | AUD | Home Loans Mar | -0.50% | 0.00% | -0.50% | -0.80% |
| 02:00 | CNY | Retail Sales Y/Y Apr | 10.70% | 10.80% | 10.90% | |
| 02:00 | CNY | Fixed Assets Ex Rural YTD Y/Y Apr | 8.90% | 9.10% | 9.20% | |
| 02:00 | CNY | Industrial Production Y/Y Apr | 6.50% | 7.00% | 7.60% | |
| 06:00 | JPY | Machine Tool Orders Y/Y Apr P | 34.70% | 22.80% | ||
| 07:15 | CHF | Producer & Import Prices M/M Apr | -0.20% | 0.00% | 0.10% | |
| 07:15 | CHF | Producer & Import Prices Y/Y Apr | 0.80% | 1.00% | 1.30% | |
| 12:30 | USD | Empire State Manufacturing Index May | -1 | 7.5 | 5.2 | |
| 14:00 | USD | NAHB Housing Market Index May | 68 | 68 | ||
| 20:00 | USD | Net Long-term TIC Flows Mar | 68.3B | 53.4B |


