
Global financial markets are bracing for potential upheaval as geopolitical strains drive gold to new record while oil prices surge. This surge, alongside the rally in metals like Copper, ignites concerns over an inflation comeback. Such inflationary pressures, combined with a revival in manufacturing and service sectors, could deter major central banks from implementing significant monetary easing through the year. The markets’ nervous response is evident in the stark pullback of stock indices, though a major reversal remains pending confirmation.
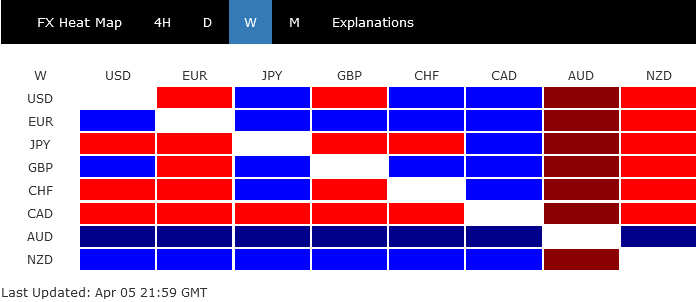
In the currency markets, Australian Dollar emerged resilient, finishing as the week’s strongest contender, buoyed by the commodities boom rather than deterred by equity market dips. New Zealand Dollar claimed the second spot, albeit at a distance, while Euro clinched third place despite underwhelming inflation figures.
Conversely, Canadian Dollar found itself at the bottom, unable to capitalize on the oil rally but weighed down by disappointing job data. Yen also lagged, after being briefly buoyed by BoJ Governor’s hints at further tightening. Swiss Franc, despite early losses post-weak CPI data sparking rate cut speculation, managed a third-place finish from the bottom.
Dollar and Sterling presented a mixed picture. Greenback, in particular, showed reluctance to rally despite rising yields, robust job data, and diminishing expectations for a Fed rate cut in June.
Global Markets Teeter on Correction Amid Cooling Monetary Easing Expectations
Global stock markets stand at a critical juncture, on the brink of a sizeable correction following last week’s sharp retreat. This shift in sentiment arises as investors begin to take profits, reacting to tempered expectations for rapid monetary policy easing from the world’s leading central banks.
On the one hand, recent economic indicators signaled a more robust footing than anticipated, notably in the US where job market continues to demonstrate resilience in terms of growth and wages. Further buoying sentiment, Eurozone’s PMI Composite made an unexpected return to expansion in March, bolstered by strengthening services sector. Similarly, both UK manufacturing PMI and US ISM manufacturing data suggest return to growth, adding to the optimistic economic outlook.
On the other hand, this economic revival brings with it the specter of inflation, heightened by the marked increase in commodity prices recently, including copper and oil.
The prospect for stronger than expected economic growth diminishes the immediacy for central banks to implement aggressive rate cuts. At the same time, resurgence of inflationary pressures could deter central banks from taking more a proactive approach too.
In the US, the futures market now pegs the probability of a June rate cut by Fed at just 53%, following a strong set of NFP data. The prospects for a July rate reduction are higher at 73%. Yet it appears September may present the most probable window for initiating cuts, with odds surpassing 90%.
However, it’s important to note the prevailing consensus among Fed officials suggests no rush to alter policy. Minneapolis Fed President Neel Kashkari has even hinted at the possibility of foregoing rate cuts entirely this year should inflation just moves sideway.
Across the Atlantic, ECB is still eyeing June for its inaugural rate decrease, contingent on forthcoming Q1 wage due data in May. However, the path beyond this initial cut is clouded with uncertainty, reflecting the complex balance between fostering economic recovery and managing inflation risks.
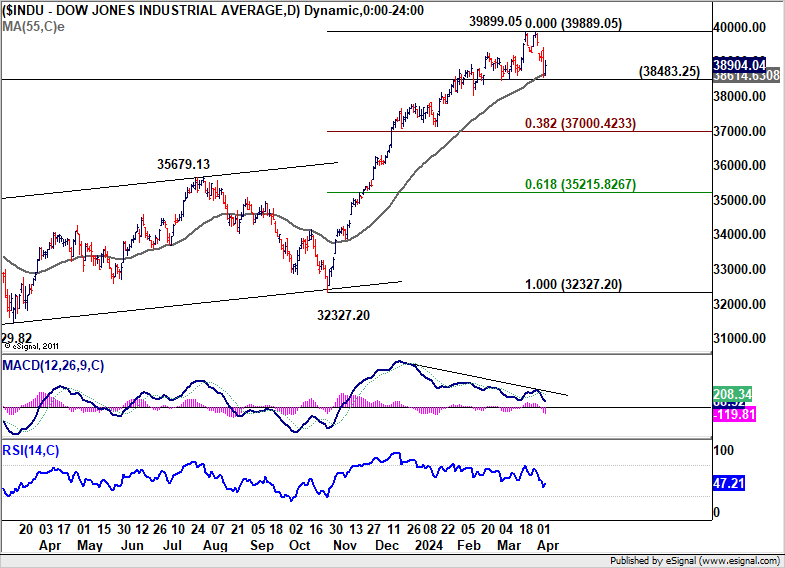
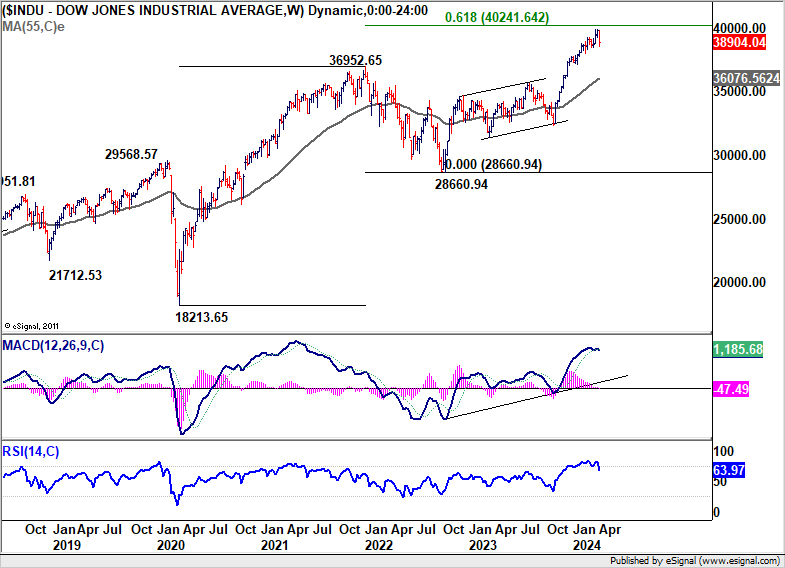
Technically, while DOW rebounded notably on Friday after drawing support from 55 D EMA, it still closed the week sharply lower. Considering bearish divergence condition in D MACD, it’s possible that 39899.05 is already a medium term top. That came just ahead of 40000 handle, and 61.8% projection of 18213.65 to 336952.65 from 28660.94 at 40241.64.
Firm break of 38383.25 support will confirm this bearish case, and bring deeper fall to 38.2% retracement of 32327.30 to 39899.05 at 37000.42.
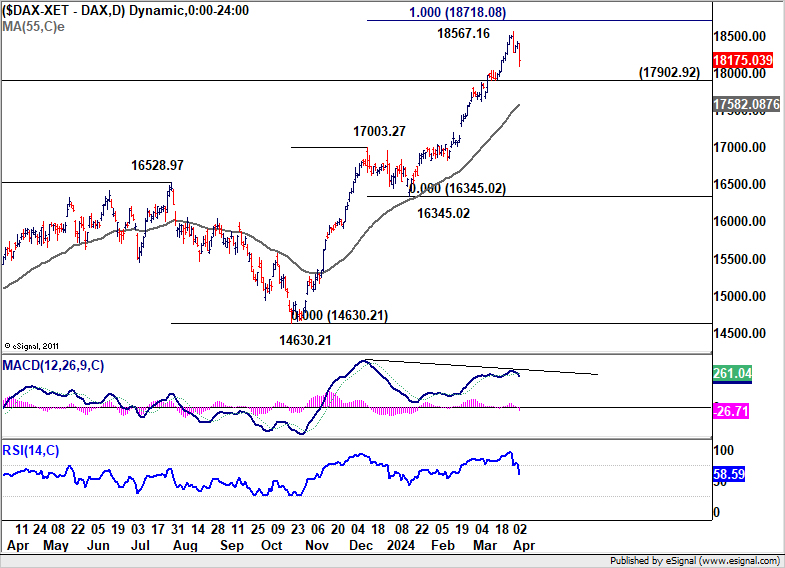
As for DAX, it’s clearly losing upside momentum as seen in D MACD. While another rise cannot be ruled out yet, 100% projection of 14630.21 to 17003.27 from 16345.02 at 18718.08 should limited upside for the near term. Break of 17902.92 support will bring deeper fall to 55 D EMA (now at 17582.08) even as a correction to rise from 16345.02 only.
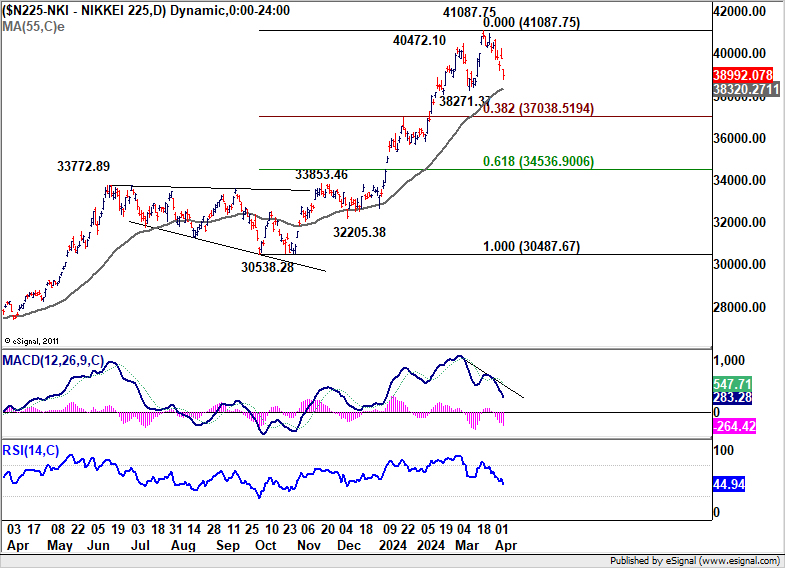
Nikkei’s up trend also looks exhausted as seen in bearish divergence condition in D MACD, after failing to sustain above 40k handle again. Break of 55 D EMA (now at 38320.27) will argue that it’s already correcting the five-wave rally from 30538.28. Deeper correction would then be seen to 38.2% retracement of 30538.28 to 41087.75 at 37038.51 and possibly below.
Commodities Rally: Copper and Oil Soar, Gold Reaches New Record
Copper prices surged to the highest levels in over a year, propelled by a combination of escalating supply risks and optimism for a revival in global demand. Reports have highlighted significant production challenges faced by Codelco, the Chilean state-owned entity and the world’s largest copper producer, which is grappling with its lowest output in twenty-five years.
Furthermore, in China, copper smelters are reportedly on the brink of enacting a collective reduction in output, a move spurred by disruptions at major mining sites that have forced smelters to contend with unprecedentedly high costs for procuring mined ore.
On the demand side, the rally in Copper prices reflects broader anticipations of a rebound in global manufacturing, departure from the sector’s year-long recession. The prospect of increased demand for Copper, buoyed by its essential role in various industries, including electronics and renewable energy, adds to the bullish sentiment surrounding the metal.
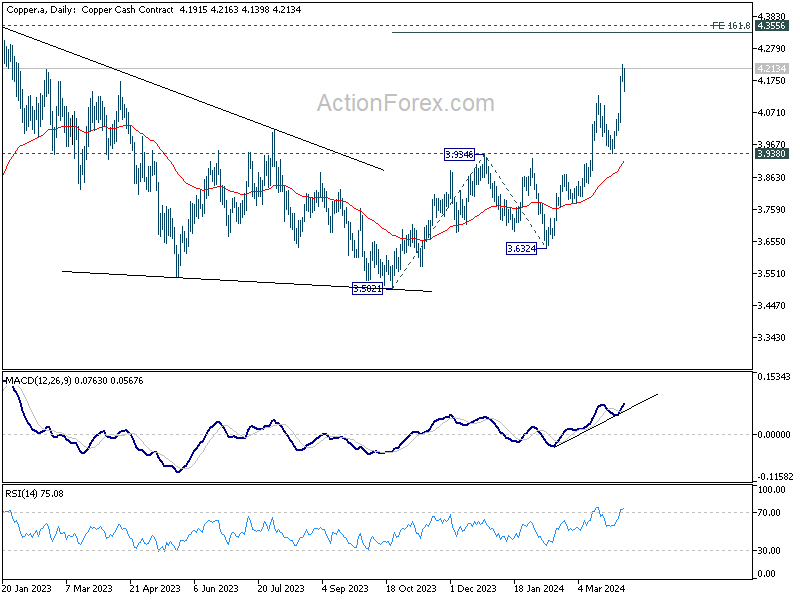
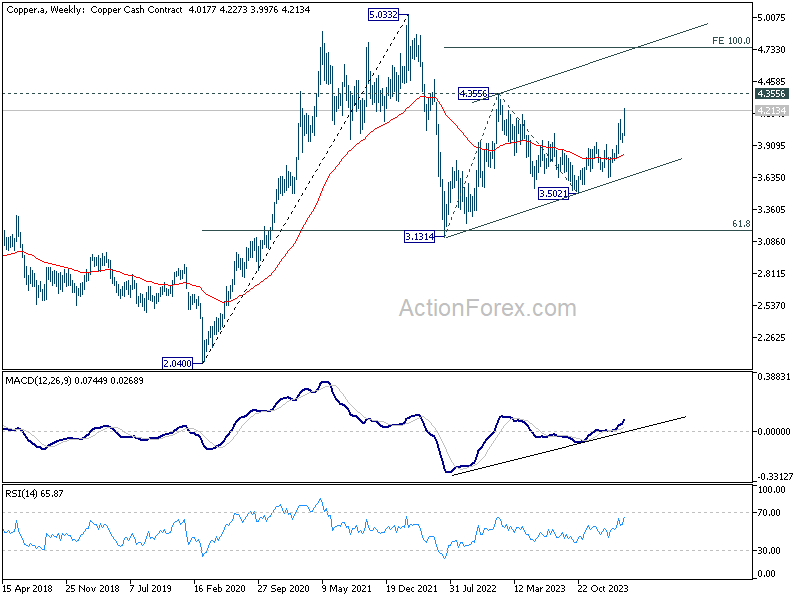
Technically, Copper’s rally from 3.5021 resumed last week and hit as high as 4.2273. Next target is 161.8% projection of 3.5021 to 3.9346 from 3.6324 at 4.3322, which is close to 4.3556 (2023 high). The more important question is whether Copper is indeed resuming the rise from 3.1314 (2022 low) too. In this medium term bullish case, firm break of 4.3556 would pave the way to 100% projection of 3.1314 to 4.3556 from 3.5021 at 4.7263.
Oil prices accelerated to their highest levels in five months, marking significant weekly gains amidst escalating tensions in the Middle East. The closure of 28 Israeli embassies worldwide, sparked by fears of retaliatory strikes from Iran, underscores the geopolitical volatility. These developments follow a missile strike on Iran’s consulate in Damascus which resulted in the death of a high-ranking general. Iran attributed the attack to Israel, which hasn’t claimed responsibility.
Compounding the market’s anxieties are recent Ukrainian offensives against Russian infrastructure, which have notably affected Russia’s oil production capabilities. For the first time since the onset of the conflict, there is a tangible prospect of substantial Russian oil supplies being withdrawn from the market, a scenario that could exacerbate existing supply constraints.
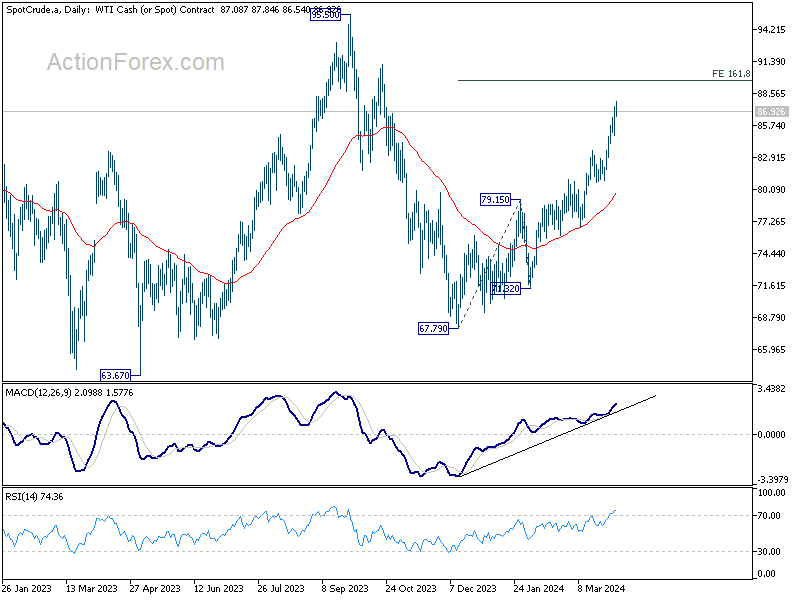
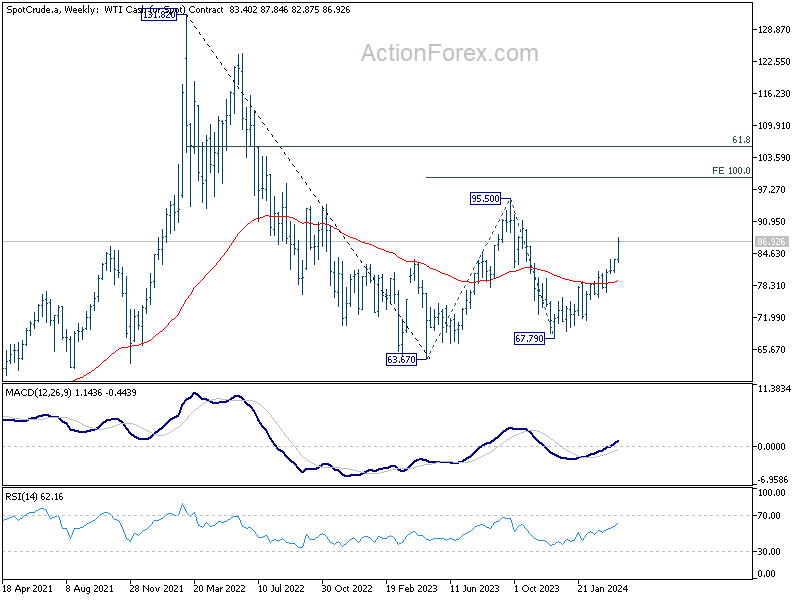
Technically, WTI crude oil is clearly in upside acceleration mode as seen in D MACD. Next target is 161.8% projection of 67.79 to 79.15 from 71.32 at 89.70. Firm break there will put 2023 high at 95.50 in radar. More importantly, if rise from 67.79, as the third leg of the pattern from 63.67, has the potential to climb to 100% projection of 63.67 to 95.50 from 67.79 at 99.62, which is close to 100 psychological level.
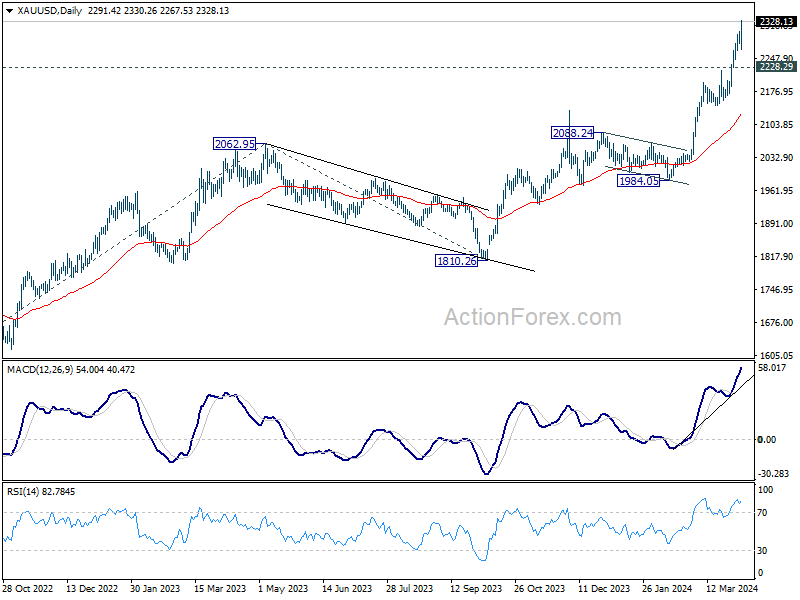
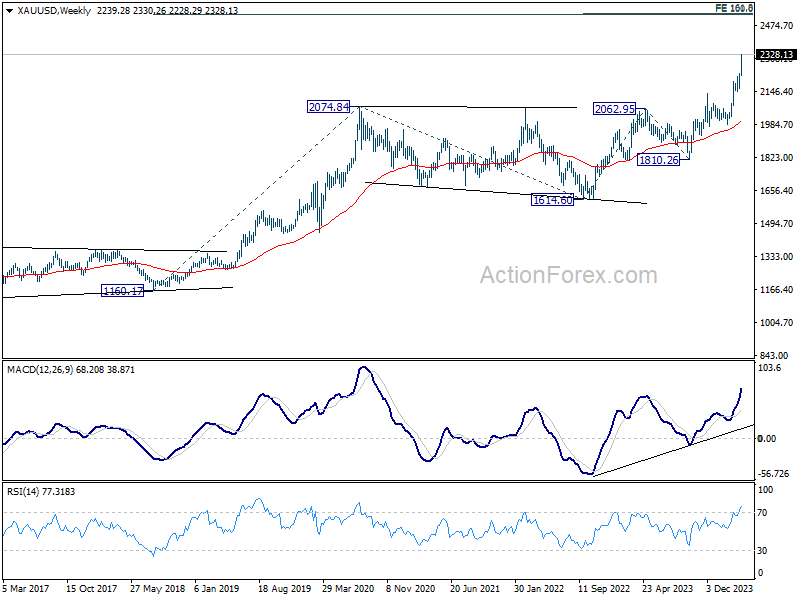
Gold extended its record run and accelerated to new high above 2300 mark last week. While the anticipation of global monetary policy easing has undoubtedly played a role in bolstering the precious metal’s appeal, it appears that the escalating geopolitical risks are currently the more dominant driver. Additionally, reports of China’s continued accumulation of gold reserves over the past 16 months underscore a strategic move to diversify away from US Dollar, further fueling gold’s ascent.
Technically, near term outlook in Gold will stay bullish as long as 2228.29 support holds. Next target is cluster projection level at around 2500, 161.8% projection of 1614.60 to 2062.95 from 1810.26 at 2536.56 and 100% projection of 1160.17 to 2074.84 from 1614.60 at 2529.27. Break of 2228.29 will bring consolidations first before staging another rally.
Dollar’s Hesitation Visible, Yet Upside Remains Slightly Favored
Dollar Index showed much hesitation to move higher last week. It seems that the greenback is more sensitive to bearish factors for now. For example, it’s dragged down by weaker than expected ISM Services readings. Fed Chair Jerome Powell’s comments, hinting that it’s still on track for three cuts this year, also weighs. Meanwhile, strong non-farm payroll data could only give Dollar a brief lift. There is probably a need for the greenback to draw further cues from overall stock market sentiment for a more decisive move.
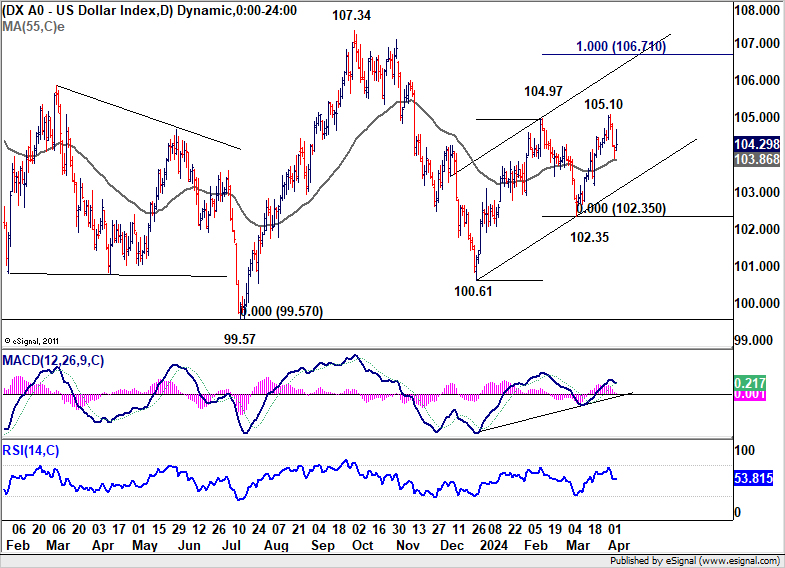
Technically, though, further rise remains in favor in Dollar Index as long as 55 D EMA (now at 103.86) holds. Rise from 102.35 is seen as the third leg of the pattern from 100.61. Break of 105.10 will target 100% projection of 100.61 to 104.97 from 102.35 at 106.71. Nevertheless, sustained trading below the EMA will dampen this bullish view and bring deeper fall back to 102.35 support instead.
AUD/USD Weekly Report
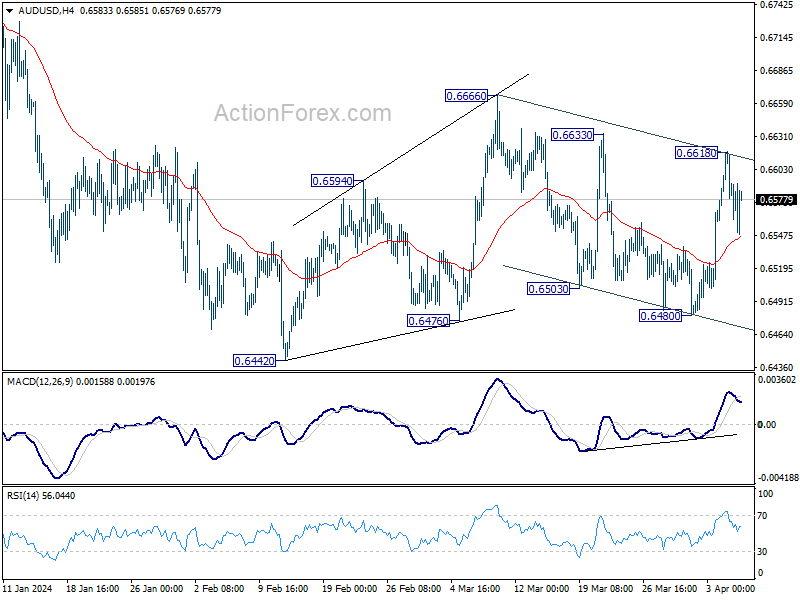
AUD/USD’s strong was rebound last week was capped below 0.6666 resistance, and followed by equally steep decline. Initial bias remains neutral this week first, with focus on 0.6503 support. Decisive break there will indicate that larger fall from 0.6870 is ready to resume, and turn bias to the downside for 0.6442 low. For now, risk will stay on the downside as long as 0.6633 resistance holds, in case of recovery.
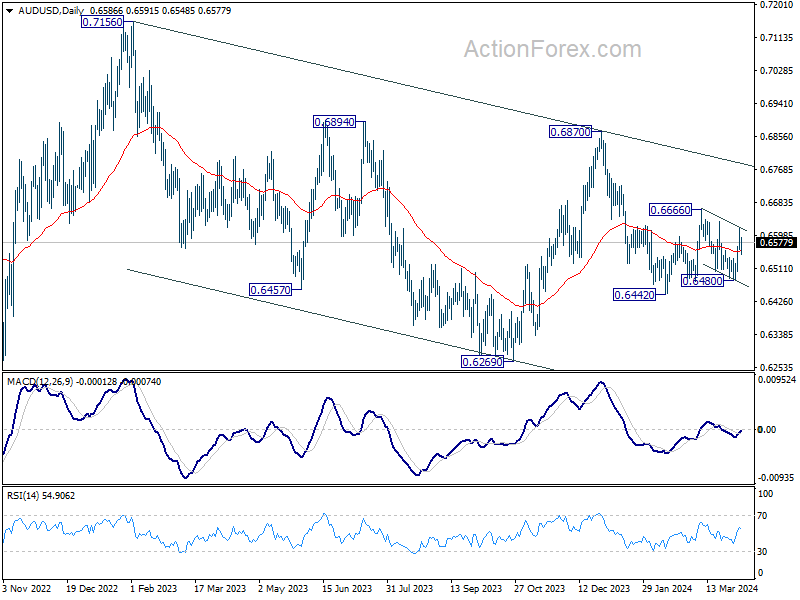
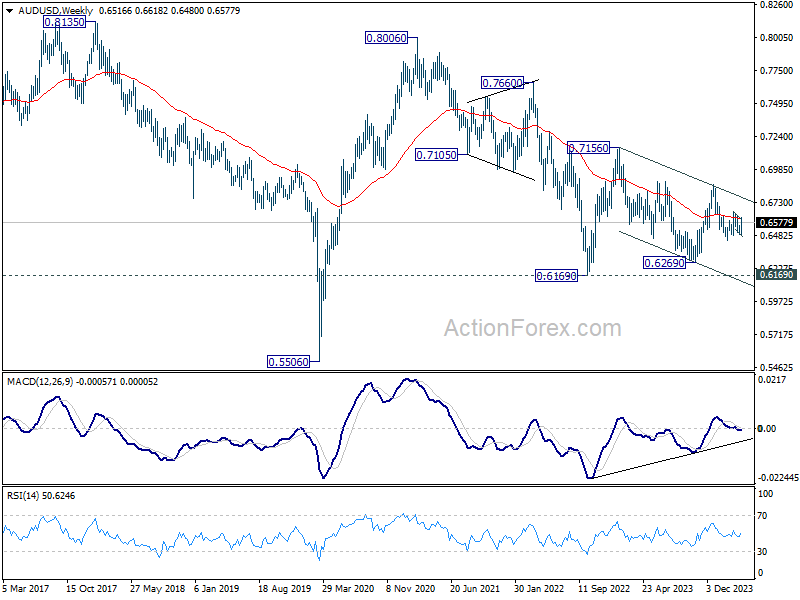
In the bigger picture, price actions from 0.6169 (2022 low) are seen as a medium term corrective pattern to the down trend from 0.8006 (2021 high). Fall from 0.7156 (2023 high) is seen as the second leg, which might still be in progress. Overall, sideway trading could continue in range of 0.6169/7156 for some more time. But as long as 0.7156 holds, an eventual downside breakout would be mildly in favor.
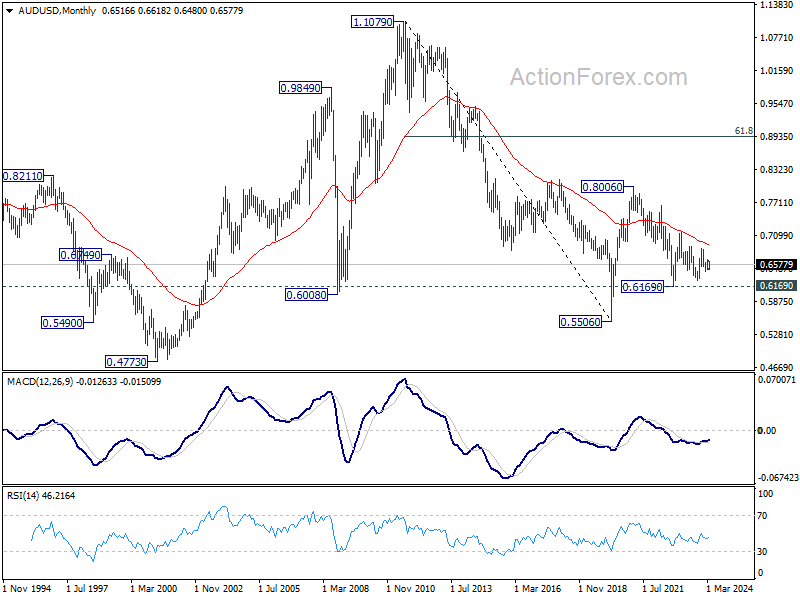
In the long term picture, the down trend from 1.1079 (2011 high) should have completed at 0.5506 (2020 low) already. It’s unsure yet whether price actions from 0.5506 are developing into a corrective pattern, or trend reversal. But in either case, fall from 0.8006 is seen the second leg of the pattern. Hence, in case of deeper decline, strong support should emerge above 0.5506 to bring reversal.


