
U.S. Review
Aggregate Demand Takes a Big Hit from the Shutdowns
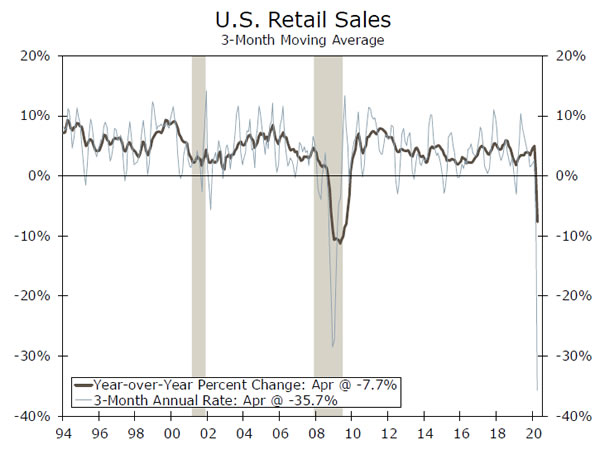
- Retail sales plummeted 16.4% in April, following an 8.3% drop the prior month.
- Industrial production fell 11.2% in April, with huge declines in consumer goods, business equipment and mining.
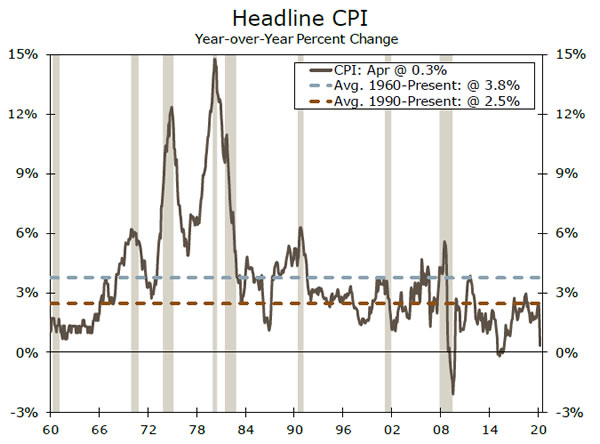
- With demand eviscerated, inflation has eased. The Consumer Price Index fell 0.8% in April, while prices excluding food and energy products fell 0.4%.
- The Empire Manufacturing Survey report improved in May, rising to -48.5 from a record low -78.2 in April, though it remains in deeply contractionary territory.
Demand Has Fallen More Abruptly than Supply
The abrupt shutdown of the U.S. economy and virtually all developed nations’ economies has profoundly reduced aggregate demand much more quickly than supply could adjust, which has reduced near-term inflation. One of the clearest examples has been oil prices, where the demand for jet fuel and gasoline fell more quickly and by much more than production of oil and refined products. The resulting glut led to much lower prices for oil, gasoline and jet fuel. Too bad we cannot lock in today’s prices for the next ten years! The same dynamic is playing out in markets for most goods, the notable exception being some extremely highdemand grocery items, such as toilet paper, ground beef and chicken. Services prices have also begun to soften, with residential rent likely set for a prolonged moderation.
This dynamic was evident in this week’s inflation reports. The Consumer Price Index fell 0.8%, the Producer Price Index fell 1.3% and the Import Price Index fell 2.6%. The sizable drops and expectations of further declines in coming months have raised the prospect of sustained deflation. As noted in a recent report, we do not expect deflation to take hold in the United States. While outright price declines are somewhat rare, they are not unprecedented and are understandable in today’s environment.
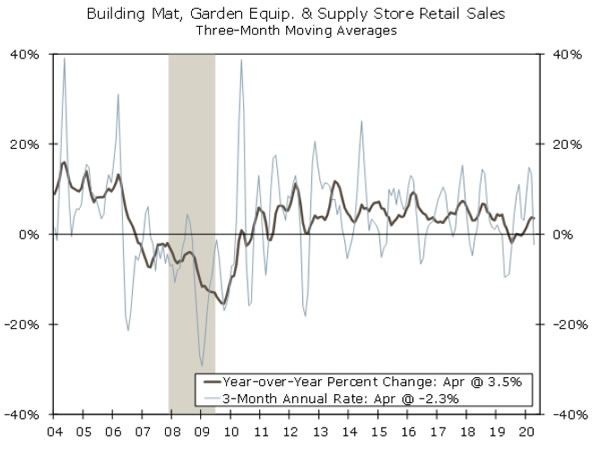
Declines in consumer prices made the drop in retail sales look even worse. Gasoline prices fell 20.6%, which contributed to the 28.8% decline in sales at gasoline stations. Spending was off sharply in virtually every category, with the exception of non-store retailers, which includes online retailers and jumped 8.4% in April. Sales at restaurants & bars fell 29.5%, following a 29.7% drop in March. Sales at clothing stores were down 78.8% in April and sales at electronics stores plummeted 60.6%. One place where spending has proven somewhat resilient has been home improvement centers. Sales at building material & hardware stores fell just 3.5% in April, following a 0.5% drop the prior month. The resilience in home improvement store sales is a slight positive for residential investment in Q2.
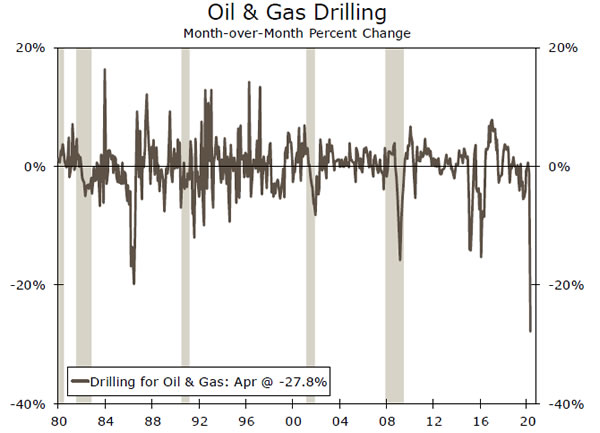
While aggregate demand has fallen more abruptly, the supply side is also contracting. Industrial production fell 11.2% in April, and manufacturing output fell 13.7%. Both declines were in line with expectations. Most major manufacturing operations, such as auto assembly plants and commercial aircraft assembly plants, were completely shut down. Notable exceptions were food products manufacturers and paper products plants, which continue to work to meet the needs of folks readjusting to remaining at home. Output in the mining sector, which include oil & gas, declined 6.1% in April. Oil and gas drilling fell 28%, which is the largest decline on record dating back to 1972.
The New York Fed’s Empire manufacturing survey suggest cuts to industrial output ebbed modestly in early May, with the overall index rising to -48.5 from -78.2 in April. Major assembly plants are beginning to re-open, but will likely show up in the June data. The recovery will be gradual, as demand remains subdued and manufacturers grapple with supply chain disruptions.
U.S. Outlook
Housing Starts • Tuesday
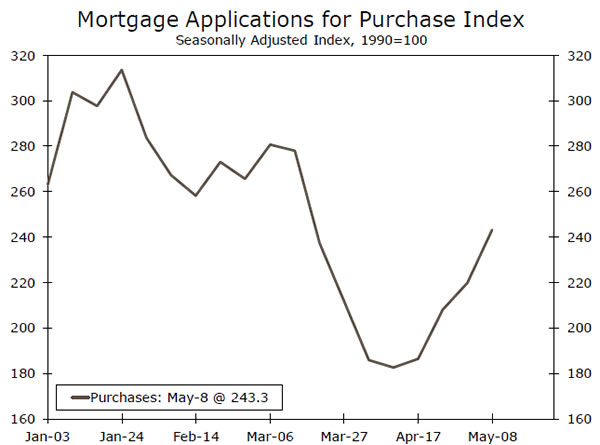
Housing demand, as measured by mortgage purchase applications, has proved surprisingly resilient, now down only 10% year-overyear. Despite the chaos of the past few months, it remains the case that much of the country is vastly underbuilt, and a wave of Millennials was on the cusp of homeownership prior to the outbreak. And while the pandemic has certainly affected occupations of all stripes, it has disproportionately hit lower-income workers who are more likely to be renters than prospective homebuyers.
On the supply side, residential construction has mostly been deemed an essential industry, and many projects have continued. Even in the most restrictive regions, such as New York City, Boston and the San Francisco Bay Area, all types of construction are being phased in again. The NAHB measure of homebuilder optimism plunged 42 points last month and will hopefully show signs of bottoming when it is released Monday.
Previous: 1216K Wells Fargo: 984K Consensus: 950K
FOMC Meeting Minutes • Wednesday
A cadre of Fed officials hit the media circuit this week via videoconference, with Chair Powell shutting down growing concerns over the Fed introducing negative interest rates. We have long been a seller of this idea, and Powell confirmed this yet again, saying it is not something the Fed is considering at this time, despite futures market pricing and Trump tweets.
Powell also emphasized the human and economic toll of the virus, and warned of lasting scars if more is not done, particularly in terms of fiscal relief. To drive the point home, he revealed a stunning statistic: “Among people who were working in February, almost 40 percent of those in households making less than $40,000 a year had lost a job in March.” The Fed has provided tremendous support to the financial system, but it is starting to reach its limits—in Powell’s words, “recall that the Fed has lending powers, not spending powers.” The FOMC meeting minutes will shed further light on the Fed’s thinking, but Powell continues to suggest that the ball is in Congress’s court.
Initial Jobless Claims • Thursday
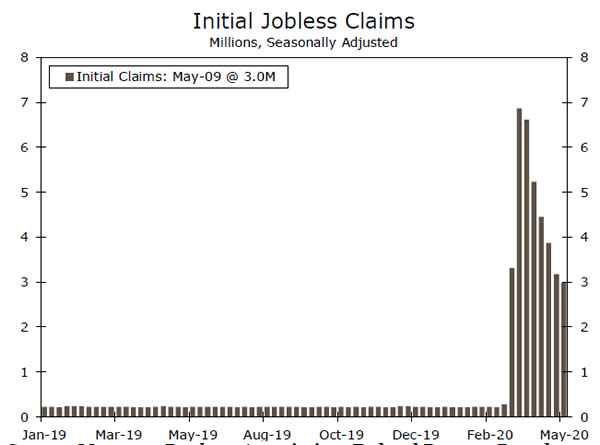
Jobless claims are one of the best indications of the timing and strength of the labor market rebound, but they have been challenging to interpret, particularly this week after at least one major clerical error. At first publication, initial jobless claims declined for the sixth straight week from their peak of 6.8 million at the end of March, but the rate of decay appears to be stalling. The three million claims filed last week brought the eight-week total to 36.5 million. One bright spot, however, was the nearly flat reading in continuing claims, which serve as a gauge of (1) how quickly the economy can ramp up after states ‘re-open’ and (2) the efficacy of the PPP. The plateau in continuing claims is an early sign that employers are calling back employees. New hires nearly offset layoffs last week, and we will watch to see if this continues.
Previous: 3.0M Consensus: 2.5M
Global Review
Q2 Likely to Be Worse for Global Economies
- This week’s data releases offered further evidence of the economic damage inflicted by COVID-19 and the associated lockdown measures.
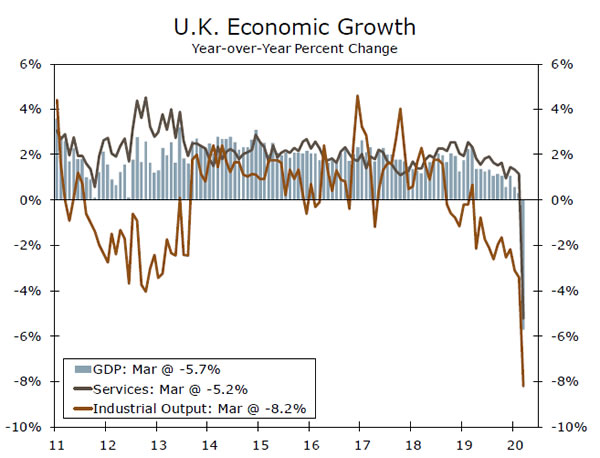
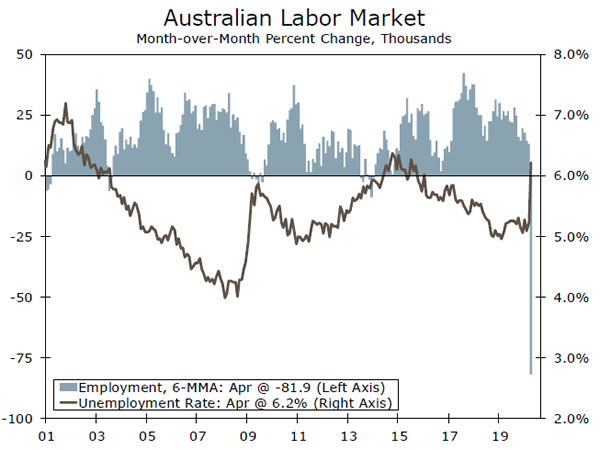
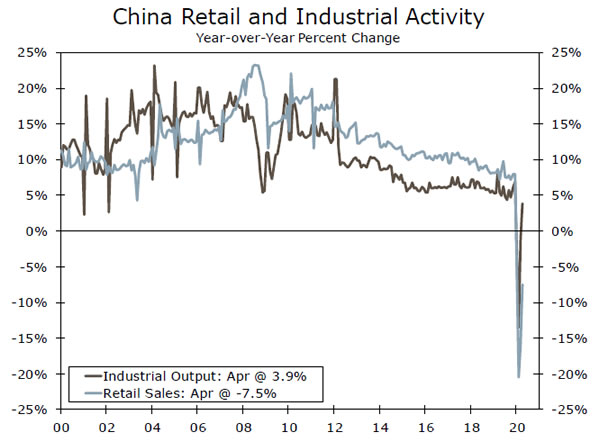
- U.K. Q1 GDP fell 2.0% quarter-over-quarter, with notable weakness in both the services and industrial sectors. In a separate report of monthly GDP figures, U.K. GDP fell 5.8% month-over-month, indicating a larger decline in Q2 is likely. Meanwhile, data out of Australia showed significant weakness in the labor market as April employment fell sharply. Elsewhere, China’s industrial economy improved in April, but retail sales are still under pressure.
U.K. Economic Growth Plunges in Q1
This week’s release of the United Kingdom’s Q1 GDP figures offered additional insight into the extent of early economic damage inflicted by COVID-19 and the associated lockdown measures. The report showed the economy shrank 2% quarter-over-quarter in the first quarter, a bit less than expected, and 1.6% year-over-year. On a quarterly basis the decline in Q1 was the largest since 2008, with notable softness across the economy. Private consumption declined 1.7% quarter-over-quarter, while exports fell 10.8%. In addition to the quarterly figures, a separate release of monthly GDP figures provided an additional level of granularity that indicated the U.K. economy is likely to face an even larger contraction in the second quarter, when stricter lockdown measures were implemented in an effort the curb the spread of the virus. March GDP fell 5.8% month-over-month, with record declines in service sector output and construction. The figures this week highlight the widespread damage of COVID-19 on the U.K. economy. That said, for the second quarter we expect GDP growth to decline about 13% quarter-over-quarter, and forecast the economy to contract 8.1% for full-year 2020.
AU Employment Slumps while RBNZ Unleashes Stimulus The Australian labor market report this week also provided evidence of the negative impact of COVID-19 on the economy amid government lockdowns. The month of April saw a record 594,300 decline in employment, exceeding market expectations, with over one-third of the losses in full-time employment. Australia’s official unemployment rate rose just one percentage point to 6.2% in April. The increase would have been larger if not for the drop in the participation rate which slipped to 63.5%, the lowest since 2004.
Like many of the world’s economies, New Zealand has also been hit hard by the dual challenges of COVID-19 and low global commodity prices. Although the Reserve Bank of New Zealand (RBNZ) opted to hold its Official Cash Rate (OCR) steady at 0.25%, the monetary policy committee unleashed large stimulus measures by nearly doubling its Large Scale Asset Purchase (LSAP) program to NZ$60B (~19% of GDP) over the next 12 months. Moreover, the central bank’s action and rhetoric were dovish in tone, leaving the door open for further policy easing. The outlook for the NZ economy remains challenging and we view the risks over the next few months as tilted toward the downside.
Chinese Industry Improves but Retail Under Pressure
Data released last night showed that the Chinese industrial economy appears to be gradually recovering. Industrial production returned to positive territory following declines earlier in the year, rising 3.9% year-over-year, exceeding consensus estimates. The consumer, however, is still showing signs of weakness as retail sales fell more than expected (-7.5% year-over-year), but less than the decline in March. By category, restaurant and catering was down 31.1% year-over-year, clothing spending declined 18.5% and petroleum fell 14.1%. As of now, we maintain our GDP growth forecast for China to contract 1.2% in 2020, but the risks are tilted slightly toward the upside.
Global Outlook
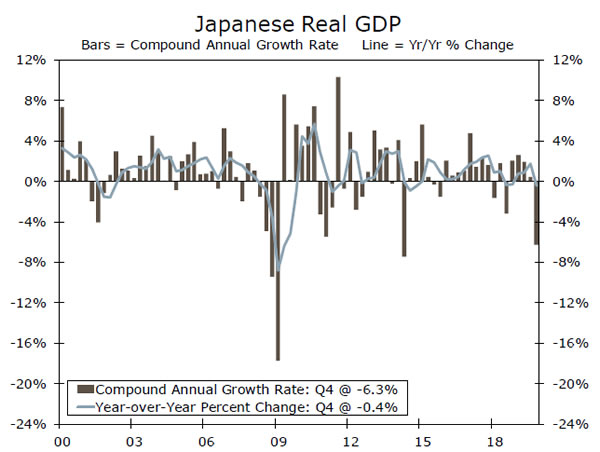
Japan GDP • Monday
Japan releases Q1 GDP data early next week, for which the consensus expect a fall of 1.1% quarter-over-quarter, or 4.5% annualized. While that would not be as weak as some other major economies, it would represent a second-straight decline for an economy that was already struggling after the October 2019 consumption tax hike. With respect to domestic activity, consumer spending is expected to decline 1.6% quarter-over-quarter, and business capital spending by a similar 1.5%.
Things are unlikely to get much better in Q2, and the economy is likely on track for a third-straight quarterly decline. Next week also see the release of the May PMI indices, and we not that the services PMI in particular is already at a very low 21.5. Finally disinflationary pressures appear to be building, and the April headline CPI due next week is expected to slow to just 0.1% year-over-year.
Previous: -7.1% Consensus: -4.5% (Quarter-over-Quarter SAAR)
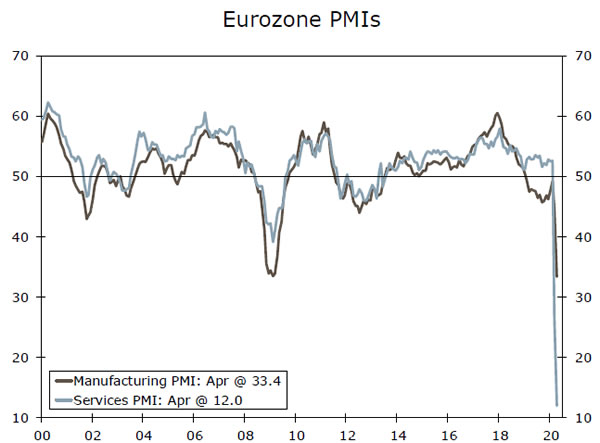
Eurozone PMIs • Friday
The European data events calendar is not especially busy next week, but it does include one of the more noteworthy releases in the form of the Eurozone manufacturing and services PMI. These indices tend to be closely watch by markets, give that they are very timely indicators of activity, and have a reasonably close relationship with overall GDP growth.
Much of the focus will likely be on the services PMI, which is expected to rise to 24.5 in May from a record low 12.0 in April. Despite the improvement the index would remain at very low levels, consistent with a sharp contraction in activity in Q2. The outlook for manufacturing also remains challenging, with the manufacturing PMI forecast to rise only modestly to 38.0 in May from 33.4 in April. With few signs of stronger growth so far, and to avoid deflationary pressures, we expect the ECB to expand quantitative easing further at its July monetary policy announcement.
Previous: 33.4 and 12.0 Consensus: 38.0 and 24.5 (Manufacturing and Services)
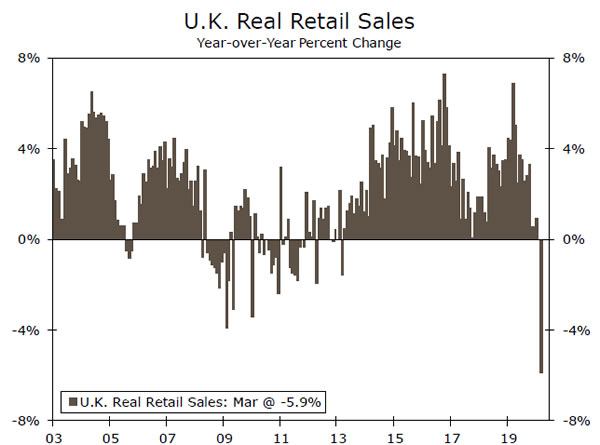
U.K. Retail Sales • Friday
Evidence of U.K. economic weakness keeps rolling in next week with the release of April retail sales. Recall that sales fell by 5.1% monthover- month in March, led by declines in clothing and footwear, automotive fuel and specialty stores. Those areas are likely to lead the way lower again in April, where the consensus forecast is for retail sales to fall an even larger 15.5% month-over-month.
Another key data release markets will be focused on next week are the May manufacturing and services PMIs. The services index in particular will be closely watched, as it represents roughly 80% of the overall economy. After the services PMI printed at a record low of 13.4 in April, it is expected to modestly to 21.1 in May–still an extremely low level. Meanwhile the manufacturing PMI is forecast to rise slightly to 35.0. Watch also for April inflation figures, where the headline CPI is expected to slow to 0.9% year-over-year.
Previous: -5.1% Consensus: -15.5% (month-over-month)
Point of View
Interest Rate Watch
Powell: Fed Prepared to Do More
Fed Chairman Powell participated in a webinar on May 13 that was hosted by the Peterson Institute for International Economics. In his prepared remarks, the chairman briefly discussed the collapse in economic activity that the COVID-19 pandemic has caused, but he also noted some potential longer-term consequences of the pandemic. Powell referenced research showing that deep and long recessions can have adverse effects on the long-term productive capacity of the economy.
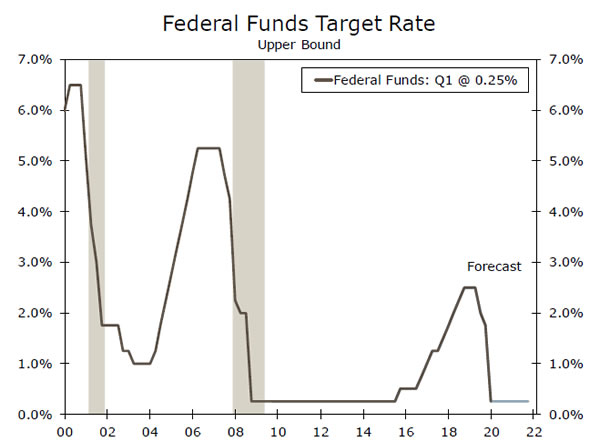
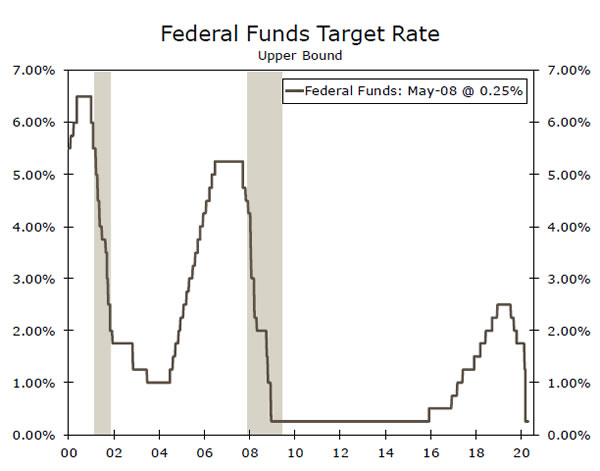
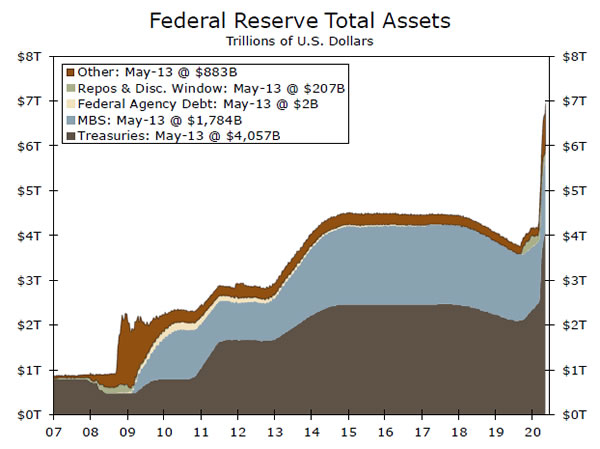
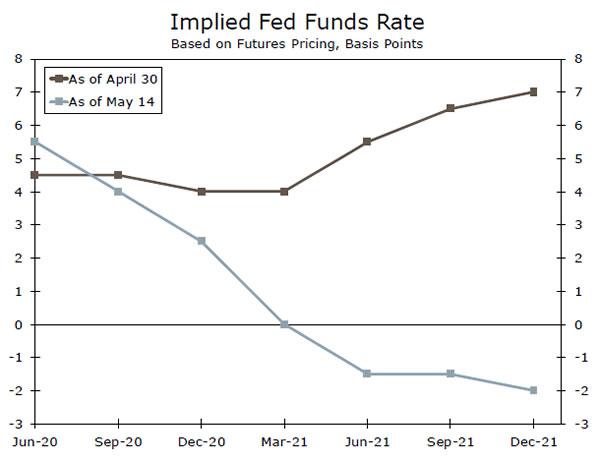
To avoid that outcome, Powell said that the Fed will use its tools “to their fullest until the crisis has passed and the economic recovery is well under way.” The Federal Open Market Committee (FOMC) has already slashed its target range for the fed funds rate to 0.00% to 0.25% (top chart), and it has restarted its quantitative easing program via significant purchases of Treasury and mortgage-backed securities (middle chart). The Fed is also providing direct lending support via its Main Street Lending Program. Presumably, the Fed could provide even more support, if needed. The chairman also called on elected officials to provide additional fiscal support, if needed. Some market participants expect that the FOMC will cut the fed funds rate into negative territory as a means of offering more support to the economy. As shown in the bottom chart, the pricing on futures contracts in 2021 has moved the implied fed funds rate modestly into negative territory over the past week or so. Thus, some market participants are betting that the committee will take rates negative at some point next year.
But the chairman splashed cold water on this notion during the Q&A portion of the webinar. Powell said “the committee’s view on negative rates really has not changed,” and added “this is not something that we’re looking at.” As we wrote in a recent report, we do not look for negative rates anytime soon because there could be adverse effects on the U.S. financial system via money market funds. But if the U.S. economy were to enter a prolonged slump, which we do not expect, then negative rates become a potential policy option for the Fed.
Credit Market Insights
Economic Well-Being of Households
This week, the Federal Reserve released its annual report on the Economic Well-Being of U.S. Households. While the report primarily focused on households’ financial state in 2019, it also includes supplemental data from surveys taken at the beginning of April in an attempt to capture some of the impact from the COVID-19 pandemic.
The survey results echo much of what we have seen through other labor market indicators: widespread, but hopefully temporary job loss. Nearly 20% of respondents reported that they lost their job or worked reduced hours in March, but nine out of ten of those who lost their job indicated they planned to or had already returned to the same employer. That job loss, however, was not distributed evenly, as nearly forty percent of people with household incomes under $40,000 lost their job in March, comparted to just 19% for all adults. This may not be surprising, given that some of the hardest hit sectors— leisure & hospitality and retail trade—are also lower paying sectors, and higher income individuals are more often able to work from home, but the stats are grim nonetheless.
The report also highlighted how the COVID- 19 crisis has impacted households’ financial standings. While the proportion of those unable to pay their bills decreased only slightly, among those who lost their job more than a third did not expect to be able to pay all of their bills in April.
Topic of the Week
Watch Continuing Claims Going Forward
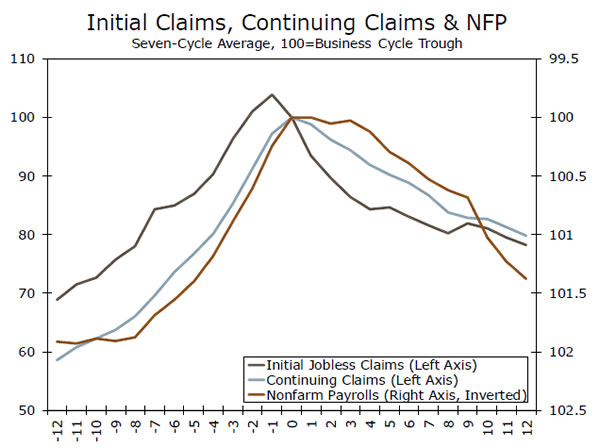
As noted on page 2, there were nearly three million individuals who filed an initial claim for unemployment insurance last week. Initial jobless claims did a good job portending the collapse in non-farm payrolls (NFP) that occurred in March and April. But while initial claims are a good indicator of the number of individuals who are entering into unemployment, they tell us little about the number of people who are exiting the ranks of the jobless. As more states begin to re-open and businesses start to re-employ some of their workers, we need a highfrequency indicator that can tell us something about how the number of unemployed individuals is changing. Continuing claims, which shows us the total number of individuals who are claiming unemployment benefits in any given week, is just that indicator.
We plot the evolution of initial claims, continuing claims and NFP (inverse scale) during the past seven business cycles in the top chart. On average, the number of initial jobless claims has peaked one month before the business cycle trough. The peak in continuing claims and the nadir in NFP have both coincided with the business cycle trough. In the early months of economic recovery, initial jobless claims fall rapidly but continuing claims recede less quickly, which more closely mirrors the rise in NFP.
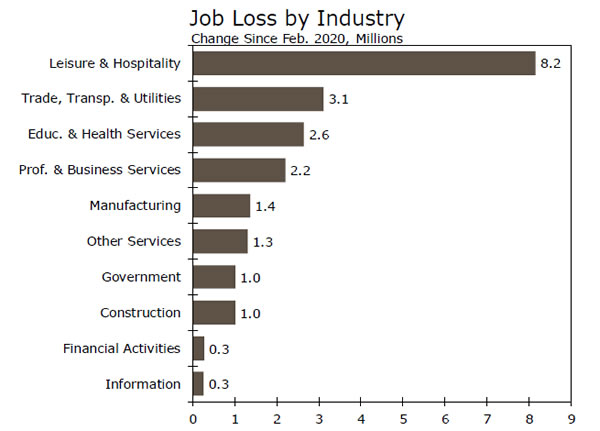
Where should we expect to see employment gains in coming months? Many of the two million worker displaced in the healthcare industry should be recalled as physician and dentist offices re-open, and many of the 400,000 auto workers who have been displaced should also return to work. But establishments in the leisure & hospitality sector (e.g., restaurants, hotels, amusement parks, etc.) probably will be operating at less-than-full capacity for quite some time, so payrolls in this sector, which is down by eight million jobs since February, will recover more slowly. We see the unemployment rate ending this year at roughly 8%.


