
Summary
United States: Supply Problem Derails August Jobs Report
- The 235K jobs added in August was about half a million jobs short of expectations. For financial markets, which were hanging on every indication of the labor market as a clue to eventual Fed tapering, this report did not shout “substantial further progress.” Other economic indicators this week were emblematic of the crosscurrents confronting the U.S. economy as it transitions from the vaccine- & stimulus-fueled surge in activity earlier in the year to a yet-to-be-determined new normal.
- Next week: JOLTS (Wed), PPI (Fri)
International: COVID Shows Up in GDP Data and China PMIs Disappoint
- Both Canadian and Indian GDP data revealed just how much of an economic impact COVID had in the second quarter of this year. The Canadian economy unexpectedly contracted in Q2 on an annualized basis, while the sharp spike in infections resulted in another significant quarterly contraction in India. COVID restrictions also played a role in uninspiring August PMI data in China.
- Next week: Reserve Bank of Australia (Tues), Bank of Canada (Wed), European Central Bank (Thurs)
Interest Rate Watch: Summer Doldrums for U.S. Interest Rates
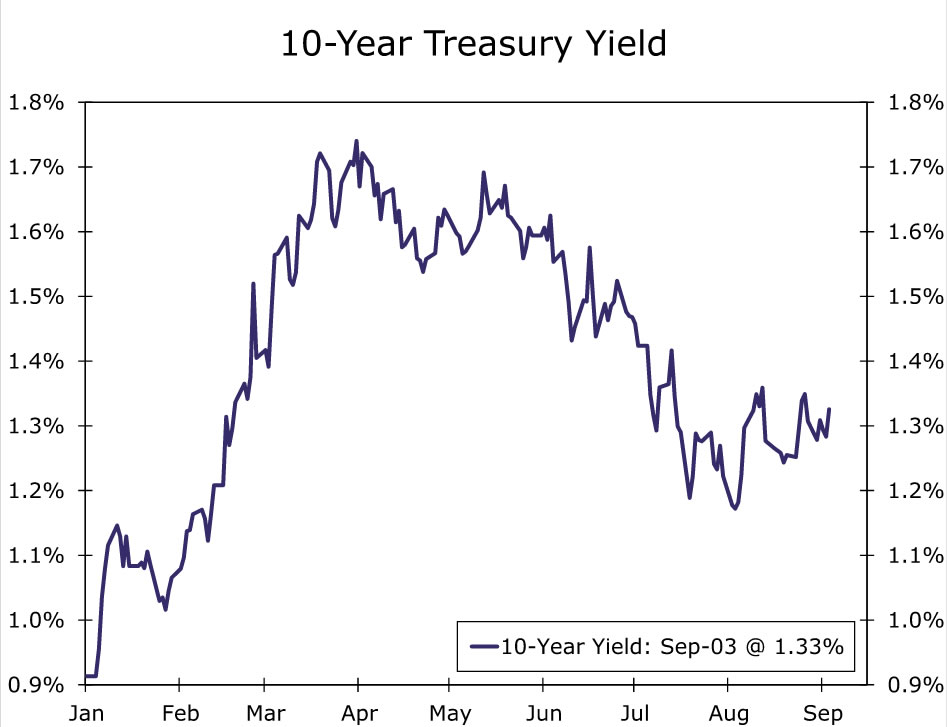
- Despite plenty of headlines related to COVID, monetary and fiscal policy and incoming economic data, U.S. Treasury yields have moved very little over the past month. The 10-year Treasury yield spent most of the month of August anchored around 1.30%, and despite a disappointing nonfarm payrolls number this morning, the 10-year yield is up a few basis points and currently sits at 1.33%.
Topic of the Week: Hurricane Ida Rains Over the East
- The cruel indifference of Mother Nature was on full display this week. While much of the West continues to battle droughts and wildfires, Hurricane Ida dumped massive amounts of rainfall on large swathes of the East. The potential negative economic impacts extend to both the local and broader U.S. economy.
U.S. Review
One Ugly Report Does Not Mean the Job Market Is in Trouble
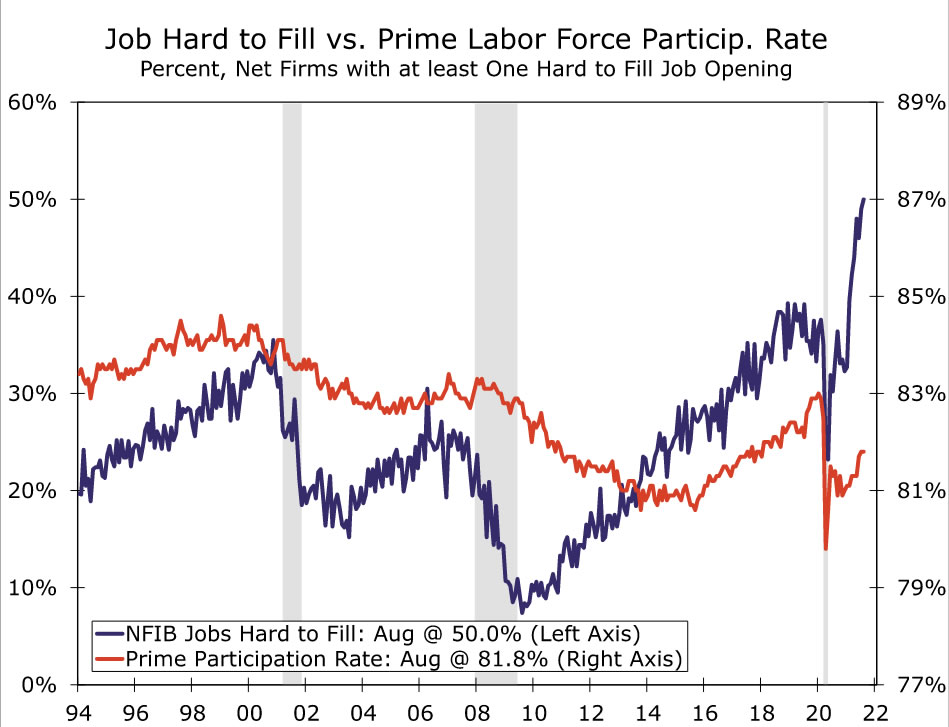
The jobs report for August was a major miss at a critical time. That said, we do not see this as a sign that the job market is in trouble. Like so many things in this pandemic era, this is a supply problem not a demand problem. The NFIB small business survey showed the share of businesses reporting that jobs are hard to fill rose to its highest on record in August. Employers are more than eager to hire, but a variety of factors are keeping would-be workers out of the market. The labor force participation rate did not budge from a still-low 61.7%. It is increasingly a sellers’ market for labor as evidenced by the rising costs for employees: average hourly earnings rose 0.6% in August, which was more than twice the expected monthly gain and lifted the year-over-year rate to 4.3%. Any number of factors could be keeping would-be workers out of the market, from COVID fears and lack of child care to the idea that extended jobless benefits diminish the urgency to find work. Most of these impediments could be removed or diminished by higher pay. For now, the lackluster increase of just 235K makes it very unlikely that the FOMC will announce a taper of its asset purchases at its September 21-22 meeting.
The rest of the economic data we got this week reflect the various crosscurrents confronting the U.S. economy as it transitions from the initial vaccine- & stimulus-fueled surge to a yet-to-be-determined new normal.
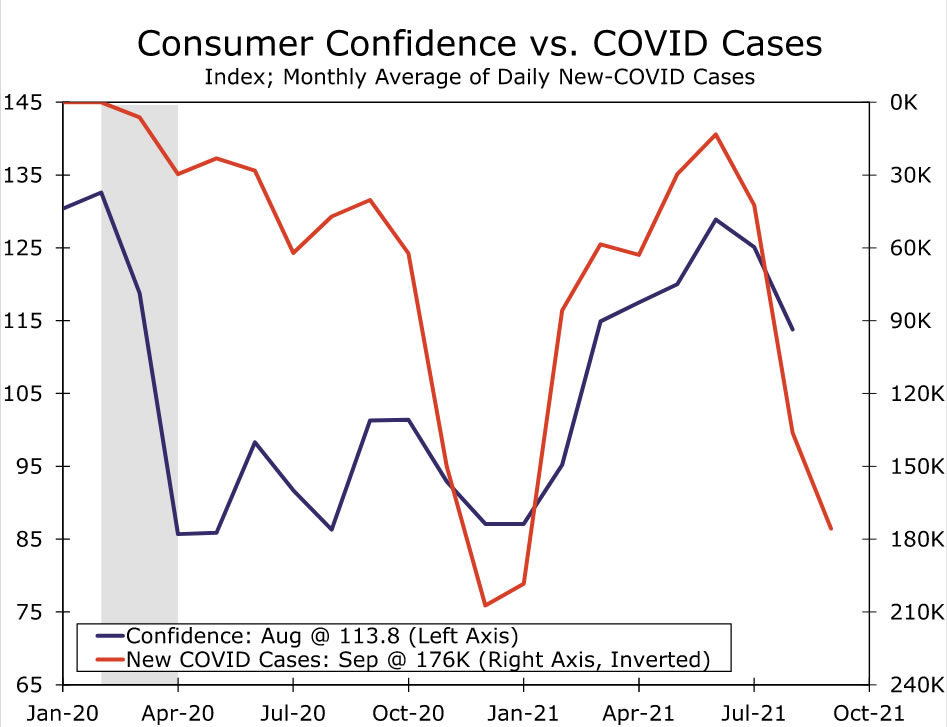
The crosscurrents theme is certainly evident in the consumer data. For the past several months, consumers have been spending some of their accumulated savings, but the categories seeing the biggest gains are in the service sector. The goods-spending boom of last year has largely faded. There is no sign of an immediate turnaround in the consumer confidence report, which showed buying intentions for durable goods, such as autos and appliances, declined in August. Consumer confidence in general fell to its lowest level since last winter, as households take in the latest surge in COVID cases and news about the war in Afghanistan. Still, the share of households reporting that jobs are plentiful remains near its highest levels of the past two decades, even though the share fell slightly in the latest reading. In short, households are worried about the future even though they see strength in the jobs market.
Some Potentially Good News for GDP
Businesses largely agree that the job market is tight. The ISM manufacturing index for August rose to 59.9 and showed that the factory sector is finding ways to thrive even in a very difficult environment. Apart from a notable miss in the employment index, there was incremental improvement in many of the categories that have defined the struggles of the COVID era. The comments section pointed to the difficulty that firms are experiencing matching open positions to viable job candidates.
Two developments this week actually brightened the outlook for Q3 GDP growth somewhat. The first was in the details of the ISM manufacturing report. The two biggest upward moves of the various components were both indicative of a rebuilding of depleted stockpiles. Both inventories and customer inventories shot up more than five points. In the case of the inventories index, that component crossed into expansion territory and rose to its highest level since 2018. This could point to a boost for GDP as even a modest rebuilding of inventories has scope to provide a big boost to the headline growth rate. However, the service sector is still struggling to get needed inputs. Both inventory measures in the ISM services index released this week remained well in contraction territory. The other bright spot was the narrowing in the trade deficit. The July trade report showed the ripple effects of the pandemic-era disruption as the United States and the rest of the world attempt to return to some semblance of normal. The U.S. trade deficit narrowed to $70.1 billion which, if sustained, would boost third quarter GDP growth. That said, the factors driving the narrowing have to do with long wait times at U.S. ports and the re-emergence of foreign travel in July, which may prove fleeting.
U.S. Outlook
JOLTS • Wednesday
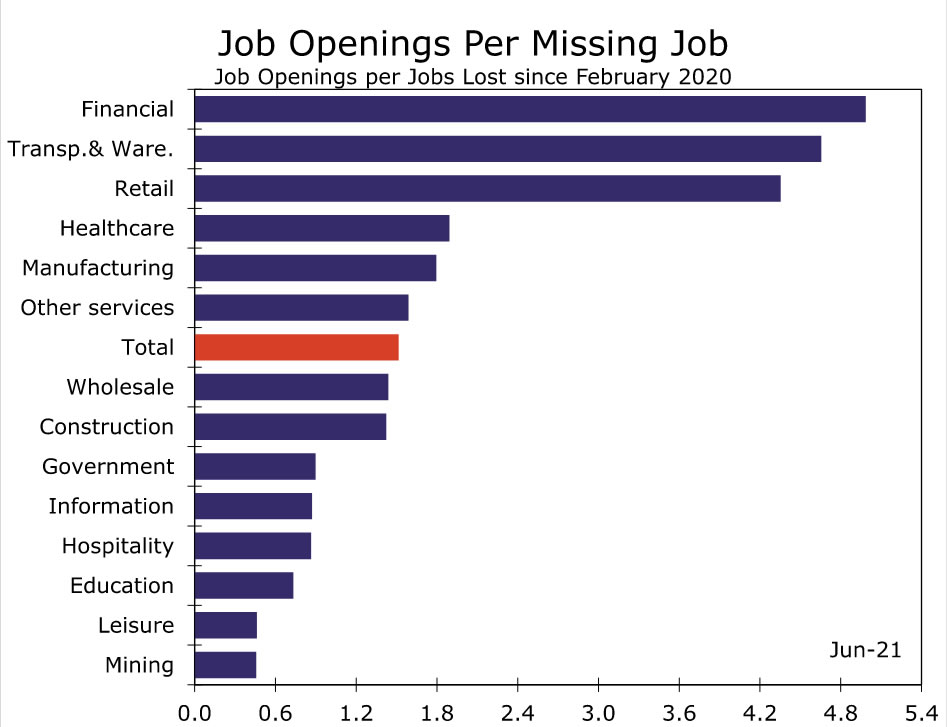
Next week’s Job Opening and Labor Turnover Survey (JOLTS) should provide a deeper dive into the labor market’s underlying dynamics this summer, as we start to look ahead to the fall. The June JOLTS report showed all the signs of a strong job market, with job openings at a series high of 10.1 million and layoffs at a series low of 1.3 million. Quits, which show workers’ willingness or ability to leave their jobs, also picked up in June, only slightly below the April series high. We expect next week’s report to show that July was still a good time to be looking for a job. Indeed job postings continued to trend up in July, and as of August 27, they are at a level consistent with about 10.5 million job openings.
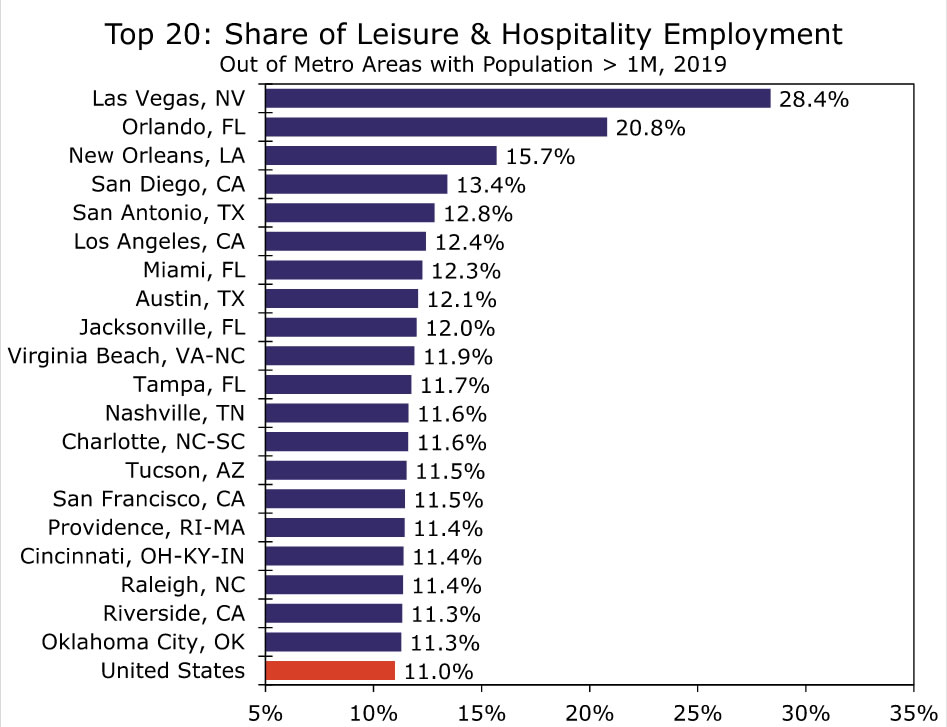
While the surge of labor demand will likely recede at some point, it has remained exceptionally strong through much of the summer. Labor supply, however, has been a bit harder to come by. In fact, there were more job openings than there were unemployed persons in June. Part of the inability to fill open positions is a result of the fact that industries with job openings may not always match those in which jobs were cut last year. High-contact service industries have also had a hard time bringing workers back to the jobsite due to COVID concerns and lower pay, among other reasons. While COVID concerns remain top of mind, leisure & hospitality has seen some of the fastest wage growth of any industry over the past few months and enhanced unemployment insurance programs have started to expire, which may push some workers back into the job market. Despite the labor demand far outstripping labor supply, hiring has been able to maintain a relatively healthy pace. Total hires in June reached their highest level since last year’s reopening, and firms continued to add jobs in July.
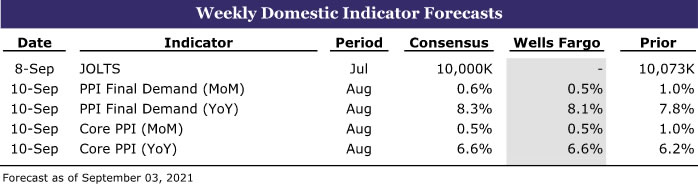
Producer Price Index • Friday
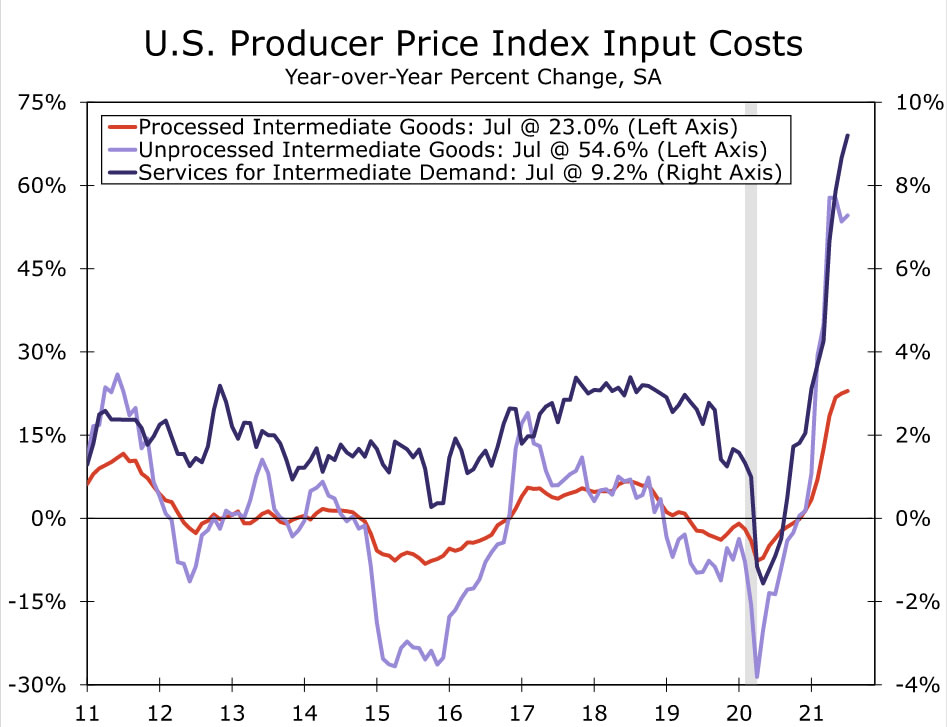
Coming in before the Consumer Price Index during a slow week for economic indicators, August’s Producer Price Index report may get a bit more attention than usual. While we saw monthly growth in the CPI moderate in July, the PPI for final demand increased 1.0% for the second month in a row, bringing the three-month annualized rate up to 11.8%. Further up the pipeline, the PPI for intermediate services demand saw another healthy increase in July, while the PPI for intermediate processed and unprocessed goods slowed slightly. All of these measures, however, remain quite elevated relative to last year, reflecting the broad price pressures that firms are facing.
So far for August, there has been some indication of intermediate price pressures easing at the margin. The prices paid component of the ISM manufacturing survey fell 6.3 points to its first sub-80 reading since December. That said, purchasing managers continued to face difficulty sourcing needed inputs, as every commodity, except wood and lumber, was reported to be up in price. Altogether, we expect that growth in prices received by domestic producers moderated to 0.5% month-over-month in August, but the broad array of cost pressures will keep a healthy floor on the PPI in the months ahead.
International Review
Q2 GDP Data Underwhelms in Canada and India
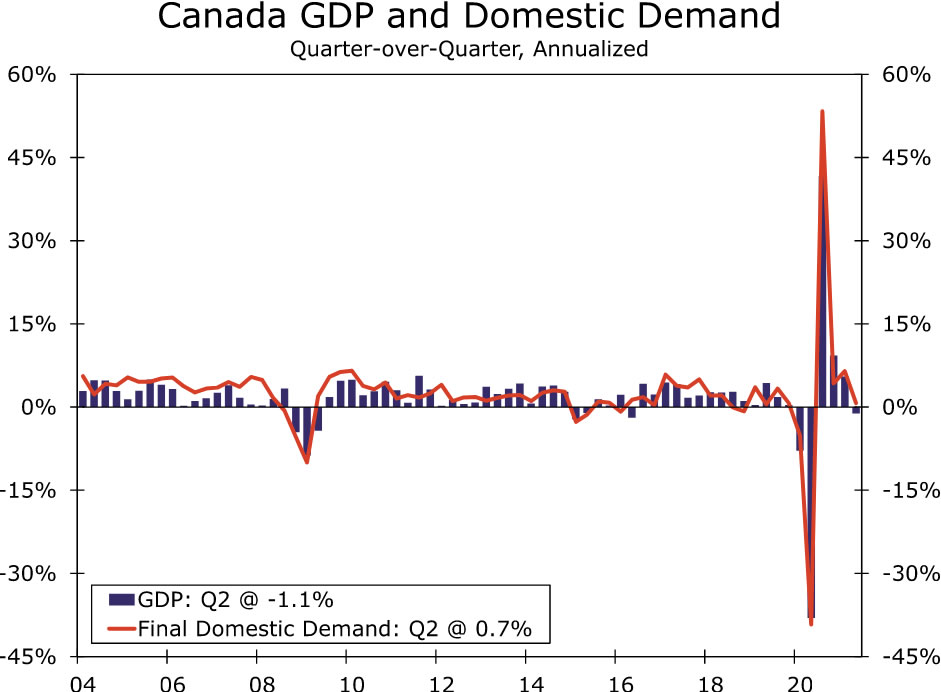
This week, we received Q2 GDP data from Canada as well as India. At a high level, the takeaway from each GDP print is the same: both economies came under more pressure than expected in the second quarter. Starting with Canada, Q2 GDP surprised to the downside, with data revealing the economy contracted 1.1% quarter-over-quarter annualized. Although the decline was a bit of a shock, the underlying details of the data reveal some silver linings. The slowdown in the economy appears to mostly be driven by exports. As a result, after stripping out exports and inventories, final domestic demand rose 0.7% during the second quarter. In addition, household finances remain in good shape, which should place Canada in a position to rebound following a temporary period of soft growth. While the renewed spread of COVID has injected some uncertainty into the path of monetary policy, we continue to believe the Bank of Canada will continue to slow asset purchases and is on pace to raise interest rates in the second half of next year.
Data also revealed the sharp spike in COVID cases earlier this year in India resulted in a significant economic contraction in the second quarter. By our estimates, the economy declined around 12.5% on a seasonally adjusted quarter-over-quarter basis; however, given the base effects associated with the significant decline in the second quarter of last year, the economy expanded a little over 20% year-over-year in Q2-2021. The second quarter of 2021 decline was largely driven by a sizable slowdown in personal consumption. Local government restrictions and an abundance of consumer caution weighed on consumer spending as well as the overall economy. The size of the contraction was more than we expected, and as a result, we revised our 2021 GDP forecast lower. We now expect India’s economy to grow around 8.2% this year. However, the recovery is taking shape, and we believe the rebound will pick up pace in the second half of this year and we look for that momentum to carry forward into 2022. In that context, we revised our 2022 growth forecast higher and expect India’s economy to grow a little under 8% next year.
China PMIs Under Pressure
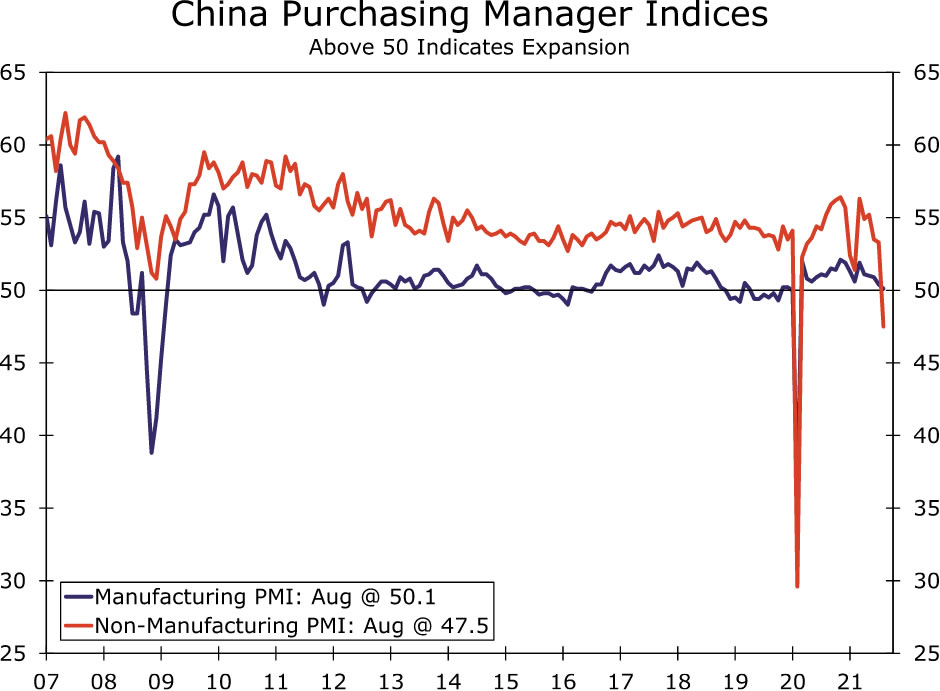
We have commented on the pending slowdown in China’s economy over the past few weeks, and we received even more evidence of the deceleration this week. Purchasing Manager Indices (PMIs) slowed further in August, with the manufacturing PMI dipping to 50.1 and the non-manufacturing PMI falling into contraction territory. COVID-related restrictions are the culprit, which we expected; however, the slowdown was more pronounced than consensus forecasts, especially on the non-manufacturing side. With the non-manufacturing sector now in contraction territory and the manufacturing sector slowing, the short-term outlook for China’s economy remains less than stellar.
Our forecast profile has not changed materially after the release of the PMIs mostly due to the fact that we expected downside surprises to China’s leading economic indicators and already made downward revisions. To that point, we continue to believe the Chinese economy will grow 8.2% this year, down from a prior forecast of 8.5% before the latest round of restrictions went into place. As the economy decelerates, Chinese authorities have suggested more support for small and medium-size businesses as well as local financial markets will be forthcoming. Just recently, People’s Bank of China (PBoC) officials suggested liquidity is likely to remain available and the credit impulse will remain steady, which should support economic growth toward the end of the year and possibly into 2022.
Despite reassurances from the PBoC, uncertainty remains prevalent in China, given the regulatory crackdown currently under way. Local equity markets have declined rather significantly amid President Xi’s push for “common prosperity,” which over time, could result in investors becoming hesitant to deploy capital into China, or outright pulling capital out of the country. The path ahead for the regulatory and legal clampdown remains unclear. For now, Chinese authorities seem to be focused on the technology, education and real estate sectors; however, they could possibly broaden their focus to other industries. Should capital outflows mount or pressure build on China’s economy as a result, the PBoC could look to intervene more aggressively in currency markets and accommodate a weaker renminbi. While we do not think an outright devaluation is likely, a weaker currency could soften the economic impact. Going forward, we will be focused on whether the PBoC turns more aggressive in its intervention methods as well as the overall direction of regulatory focus in China.
International Outlook
Reserve Bank of Australia • Tuesday
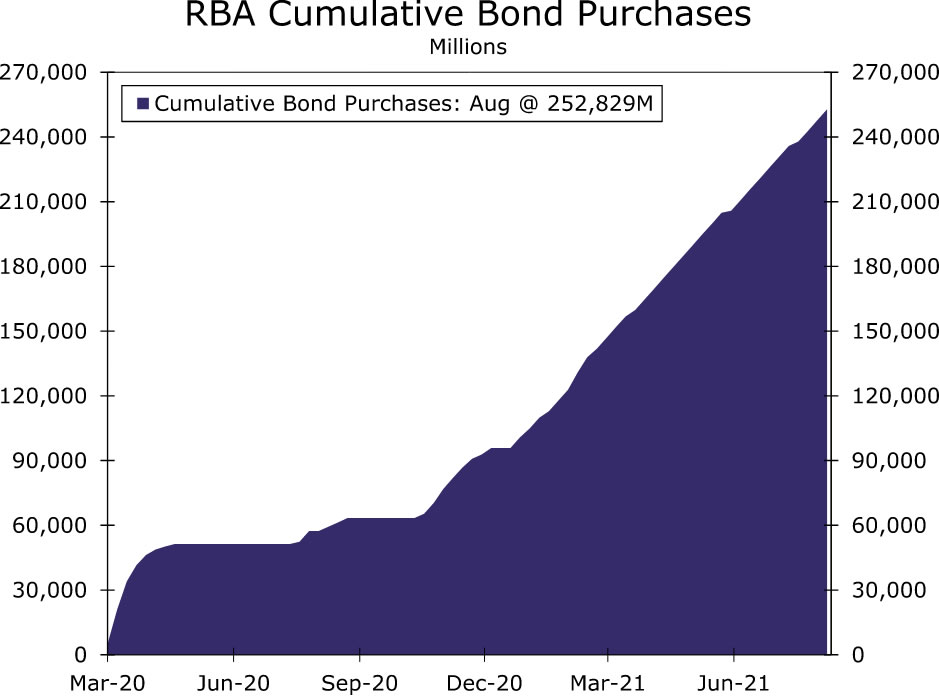
Next week’s RBA meeting could result in some elevated volatility in local Australian financial markets. In August, RBA meeting minutes indicated policymakers considered delaying the tapering of asset purchases. Given the economic uncertainties associated with rising COVID cases and lockdowns, the case for continuing the current pace of purchases has strengthened. To that point, we expect RBA policymakers to indeed delay reducing the pace of asset purchases at its meeting next week and will opt to continue providing policy support to the economy.
As of now, the RBA is purchasing A$5 billion worth of government bonds in an effort to keep yields as low as possible. We expect the current pace of purchases to continue until November, at which time we expect purchases to slow A$4 billion. Further out, we expect another tapering to occur in early 2022; however, interest rate hikes are unlikely for the foreseeable future. Should the RBA signal indeed delay tapering purchases and sound more dovish than markets expect, the Australian dollar could come under modest pressure in the immediate aftermath of the announcement.
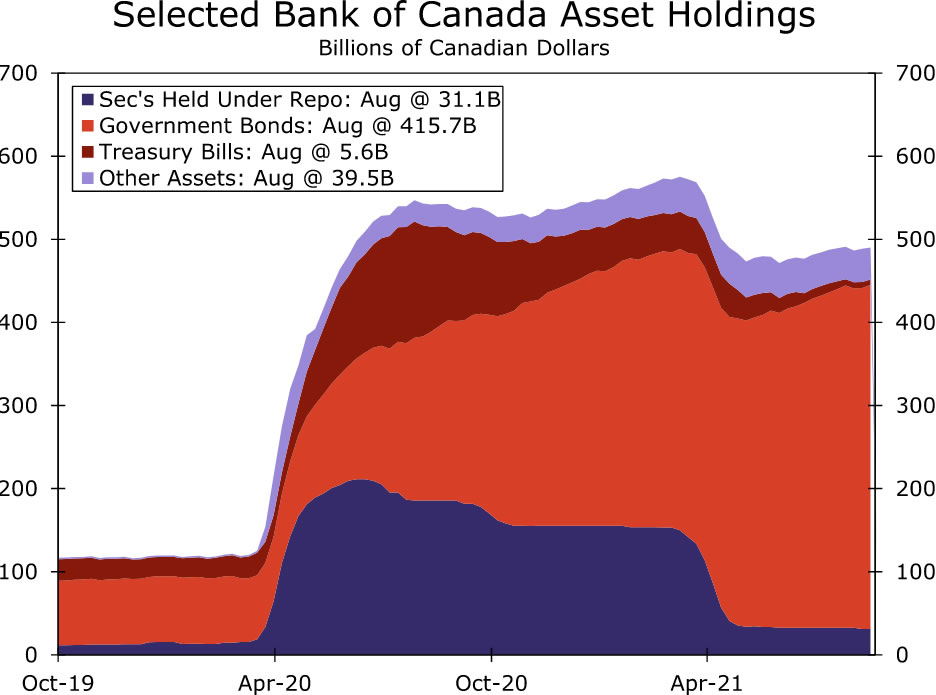
Bank of Canada • Wednesday
The Bank of Canada (BoC) was one of the first major central banks to begin reducing asset purchases, and despite recent shaky economic data, we believe the BoC is still on track to continue removing policy accommodation. Despite underwhelming GDP data, inflation is still relatively elevated, which we believe will be the focus of BoC policymakers for the time being. With that said, we expect the next reduction in asset purchases to take place in October, which would take the weekly pace of purchases down to C$1 billion per week.
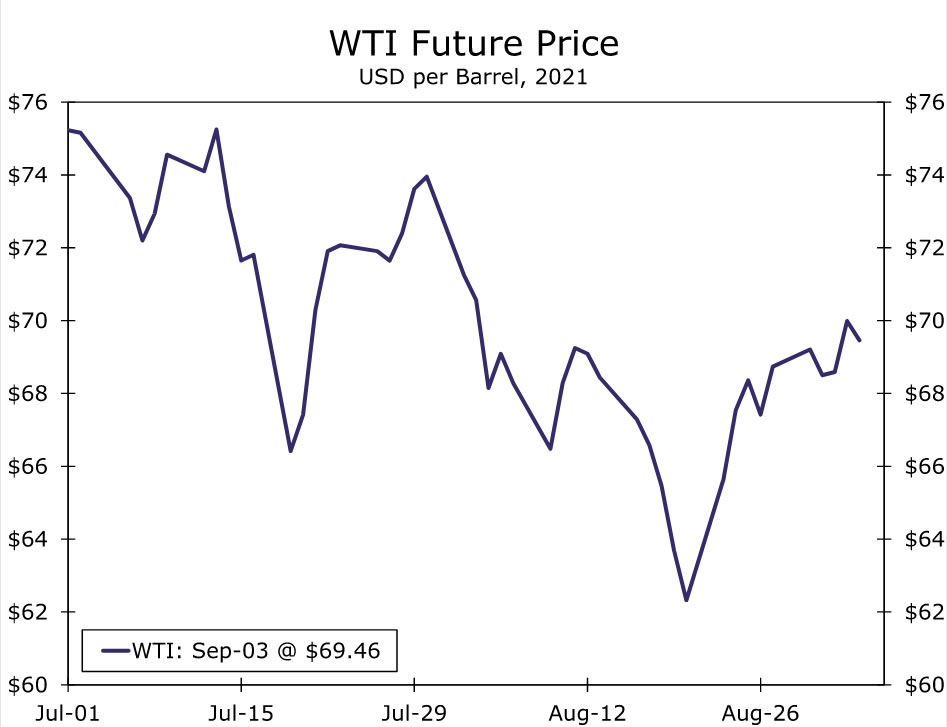
In addition to reducing asset purchases, we believe the BoC will be one of the first major central banks within the G10 to begin lifting interest rates. The medium- to longer-term outlook for the Canadian economy remains, in our view, promising. Household spending power remains elevated, which should bode well for consumption once the current wave of COVID cases abates. In addition, oil prices remain supported for the time being and should also contribute to a solid economic recovery over the coming quarters. We believe this combination should allow BoC policymakers to lift interest rates starting in Q3-2022.
European Central Bank • Thursday
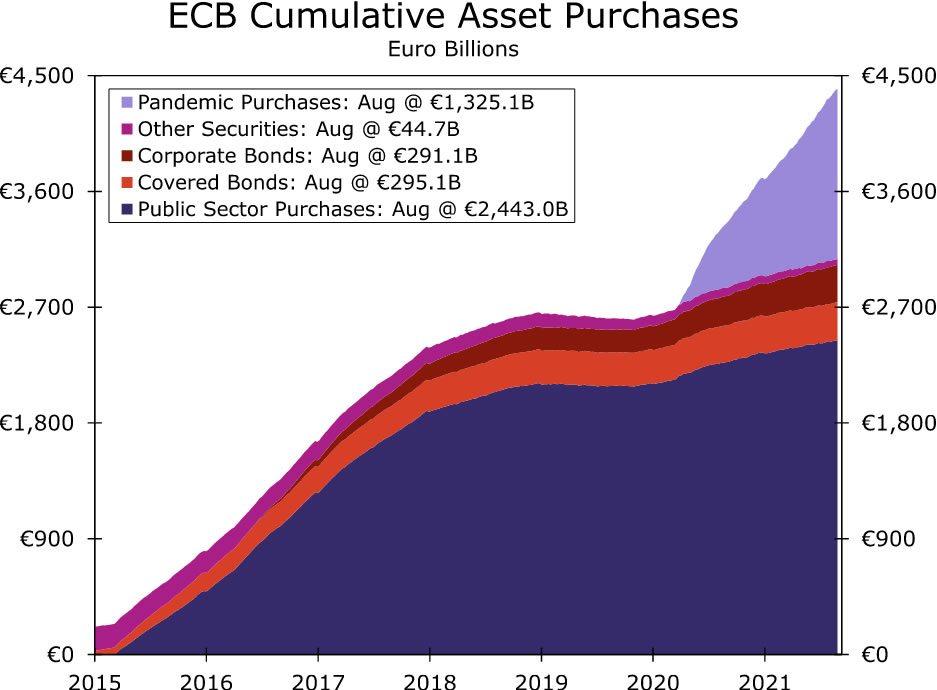
Given the ECB’s recent shift to a symmetric inflation target and mixed messages on the direction of monetary policy, next week’s monetary policy meeting should garner attention. In our view, we believe ECB policymakers will opt to keep policy unchanged next week; however, we continue to believe the central bank is on pace to ease monetary policy again before the end of this year. A higher inflation target should result in ECB policymakers opting to ease in asset purchases, picking up pace in Q4. In addition, we expect the ECB to announce a further increase in its Pandemic Emergency Purchase Program at its December meeting, possibly signaling this easing next week.
The mixed messages, however, stem from relatively less dovish commentary from select ECB members this week. Multiple members suggested the central bank should begin to consider removing policy accommodation as the Eurozone economy recovers and demonstrates the economic rebound can be sustained going forward. In addition, Eurozone inflation jumped to a recent high in August, rising 3% year-over-year. Higher-than-expected inflation could provide rationale for ECB policymakers to consider an early removal of accommodative policy; however, we remain unconvinced as of now.
Interest Rate Watch
Summer Doldrums for U.S. Interest Rates
Despite plenty of headlines related to COVID, monetary and fiscal policy and incoming economic data, U.S. Treasury yields have moved very little over the past month. The 10-year Treasury yield spent most of the month of August anchored around 1.30%, and despite a disappointing nonfarm payrolls number this morning, the 10-year yield is up a few basis points and currently sits at 1.33% (see chart). Markets appear conflicted about where rates will head next. On the one hand, the rise of the Delta variant has pulled down forecasts for economic growth in the near term and raised new questions about the Federal Reserve’s plans for tapering its asset purchases later this year. Additional uncertainty is also present in fiscal policy as policymakers in Washington D.C. are grappling with the prospects for a potential government shutdown, a debt ceiling showdown and a Democratic intraparty fight over several trillion dollars of new taxes and spending.
All that said, we continue to believe there is a case for yields to head higher from here, albeit to a still-low level by historical standards. There have been bumps in the reopening road before, and we believe the slowdown we are experiencing now is no different. GDP growth remains above potential and even August’s disappointing jobs numbers were enough to whittle down the unemployment rate a bit further. Inflation continues to run hotter than many expected earlier this year, and the FOMC still appears poised to begin slowly removing monetary policy accommodation later this year despite the challenges associated with the Delta variant.
Pulling it all together, we look for the 10-year yield to rise to 1.75% by year-end, roughly matching the 2021 high reached in late March. This economic recovery continues to be a bumpy ride, but through the bumps, progress is being made and economic policy is normalizing. We believe this should correspond with Treasury yields normalizing as well. Of course, what “normal” looks like for interest rates in a post-COVID world is a difficult question to answer. Although we believe directionally higher is the answer, we also think the magnitude will be modest relative to the historic level of yields. Many structural factors that put downward pressure on interest rates are unlikely to abate anytime soon, and subsequently we have the 10-year yield finishing 2022 at just 2.15%.
Topic of the Week
Hurricane Ida Rains Over the East
The cruel indifference of Mother Nature was on full display this week. While much of the West continues to battle droughts and wildfires, Hurricane Ida dumped massive amounts of rainfall on large swathes of the East. On Sunday, Hurricane Ida arrived in southeast Louisiana as a Category 4 hurricane with over 150-mile-an-hour winds registered in some locations. Ida, which was the fifth most powerful hurricane to hit the United States, dumped between 10 and 15 inches of rain near its landfall location and brought a storm surge of 5 to 12 feet. After making landfall, the intensity of the storm lessened, and Ida was downgraded to a tropical storm as it coursed up through the Eastern Heartland and into the Northeast. While wind speeds died down, the rain did not, bringing flooding, agricultural ruin, infrastructure damage and general destruction for areas in the storm’s path.
While many major metro areas in the East are currently dealing with the aftermath of Ida, Louisiana appears to have been hit the hardest by the storm. Hurricane Ida made landfall exactly 16 years to the day that Hurricane Katrina devastated New Orleans. Fortunately, a $15 billion investment has been made in revamping the region’s flood walls, levees, canals and barriers, which likely prevented a repeat of Katrina’s destruction. The flooding that occurred during Katrina was largely the result of engineering flaws in the region’s flood protection system. After the levees broke, approximately 80% of New Orleans and the surrounding neighborhoods and parishes were flooded. The storm also temporarily left tens of thousands without food or water, caused over 1,800 deaths and permanently displaced an estimated 1.5 million people from Louisiana, Mississippi and Alabama.
The good news is that Hurricane Ida’s damages do not appear to be of the same magnitude of Hurricane Katrina. That said, the storm prompted evacuations of about 580,000 residents and the intense winds knocked out power for over one million households in Louisiana and Mississippi. Initial estimates of the damages currently range from $50 billion to $80 billion, but Ida’s full impact will not likely to be known for some time. For context, Hurricane Katrina caused $125 billion in damage, mostly in the New Orleans area. What’s more, these estimates do not include the overall economic impact to the local economies that have essentially been shut down by power outages and flooding.
Source: U.S. Department of Labor and Wells Fargo Securities
Source: Bloomberg LP and Wells Fargo Securities
While power has been restored for some households in New Orleans, many businesses remain shuttered due to the power outages, and repairs are expected to take weeks. The tourism industry, which is still battling pandemic-related challenges and is one of the metro’s key economic drivers, will likely be sidelined for an extended period. Most hotels, bars and restaurants remain shuttered, and live events that were scheduled to take place in the city have been canceled, postponed or relocated. Notably, the New Orleans Saints will now play their home opener in Jacksonville, Florida.
The potential negative economic impacts extend to the broader U.S. economy. For one, the Port of New Orleans (Port NOLA) is a key access point for the Mississippi River. Freight movement came to a standstill as the port closed down on Monday. Port NOLA has since reopened, but the disruption at the port could add to the pressures generated by ongoing supply-chain bottlenecks across the county. Furthermore, the storm temporarily shut-in almost all Gulf Coast oil production. Louisiana’s onshore refineries appear to be back up and running after temporarily shutting down, but Hurricane Ida badly damaged Port Fourchon, which supports an estimated 16% of U.S. crude oil production and 4% of U.S. natural gas production. The Colonial Pipeline, which is the largest pipeline system for refined oil products in the U.S., was also shut down, but now is fully operational. West Texas Intermediate oil prices did not spike as a result of Hurricane Ida, but did end September 2nd at almost $70 a barrel, the highest level since early August.


