HomeContributorsTechnical AnalysisElliott Wave View: S&P 500 (SPX) Ending Wave 5

Elliott Wave View: S&P 500 (SPX) Ending Wave 5

Cycle from Dec 26, 2018 low in S&P 500 (SPX) remains in progress as an impulse Elliott Wave structure. In the 1 hour chart below, we can see wave (4) of this impulsive move ended at 2722.27. The Index has resumed higher in wave (5) with subdivision also as an impulse of lesser degree. Up from 2722.27, wave 1 ended at 2852.42 and wave 2 ended at 2785.02.

Wave 1 subdivides as an impulse where wave ((i)) ended at 2736.25 and wave ((ii)) ended at 2723.02. Up from there, wave ((iii)) ended at 2821.24, wave ((iv)) ended at 2803.46, and wave ((v)) of 1 ended at 2852.42. Wave 2 pullback unfolded as double three Elliott Wave structure where wave ((w)) ended at 2802.13, wave ((x)) ended at 2823.28, and wave ((y)) of 2 ended at 2785.02. Wave 3 rally is currently in progress as an impulse. Near term, while dips stay above 2784.94, expect Index to extend higher. We don’t like selling the proposed pullback.

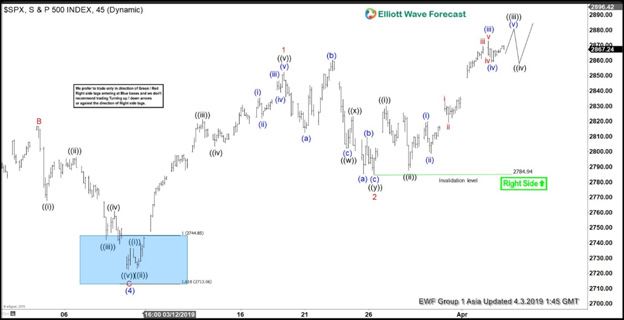
1 Hour SPX Elliott Wave Chart

Elliott Wave Forecast
Elliott Wave Forecasthttps://elliottwave-forecast.com
ElliottWave-Forecast has built its reputation on accurate technical analysis and a winning attitude. By successfully incorporating the Elliott Wave Theory with Market Correlation, Cycles, Proprietary Pivot System, we provide precise forecasts with up-to-date analysis for 52 instruments including Forex majors & crosses, Commodities and a number of Equity Indices from around the World. Our clients also have immediate access to our proprietary Actionable Trade Setups, Market Overview, 1 Hour, 4 Hour, Daily & Weekly Wave Counts. Weekend Webinar, Live Screen Sharing Sessions, Daily Technical Videos, Elliott Wave Setup videos, Educational Resources, and 24 Hour chat room where they are provided live updates and given answers to their questions.

Featured Analysis

Learn Forex Trading