
The US 500 stock index has rebounded somewhat after falling to a three-month low of 2728.50 and the momentum indicators suggest that the market sentiment might get better as the RSI is reversing back to the upside and the MACD also looks to be changing direction, moving down to meet its red signal line in the negative zone.
Should bullish dynamics dominate, the market might revisit the lower surface of the Ichimoku cloud and the flat Kijun-sen line currently at 2840. Above that, the area around the 50-day moving average near 2870 which halted upside movements, could be another potential barrier in focus, while steeper increases may overcome that point to test 2893.
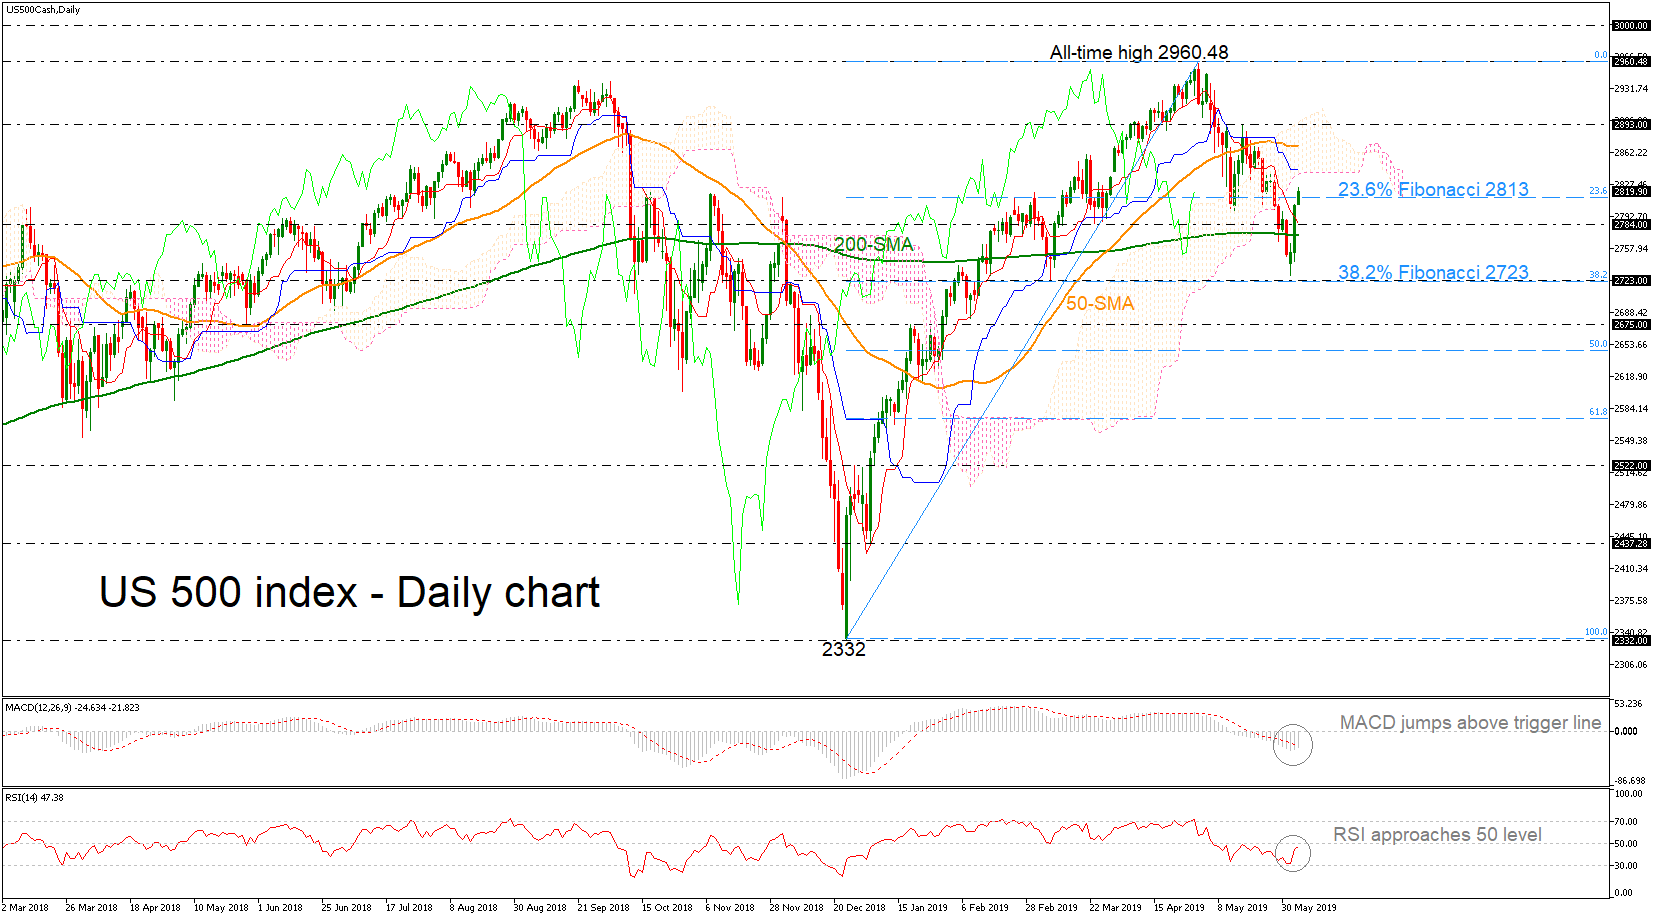
Alternatively, if the price manages to fall below the 23.6% Fibonacci of the upleg from 2332 to 2960.48 of 2813, nearby support could come from the previous low around the 38.2% Fibonacci of 2723. Further down, the index could rest around the 2675 support level.
In the short-term picture, the downfall from 2960.48 is still active and hence the outlook remains negative. However, if the price jumps above the 50-day SMA, it could shift the bias back to strong bullish.


