
The EUR/USD currency pair
Technical indicators of the currency pair:
Prev Open: 1.10715
Open: 1.11242
% chg. over the last day: +0.47
Day’s range: 1.11190 – 1.11310
52 wk range: 1.0884 – 1.1623
The single currency continued its growth relative to the greenback. EUR/USD quotes updated two-month highs. The trading tool found resistance at 1.11350. Round level 1.11000 is the immediate support. Today, investors will be focused on the summit of EU leaders. We also recommend that you keep track of up-to-date information regarding the settlement of the trade conflict between the US and China. The EUR/USD currency pair has the potential for further growth. Positions must be opened from key levels.
Pay attention to the speeches of FOMC representatives.
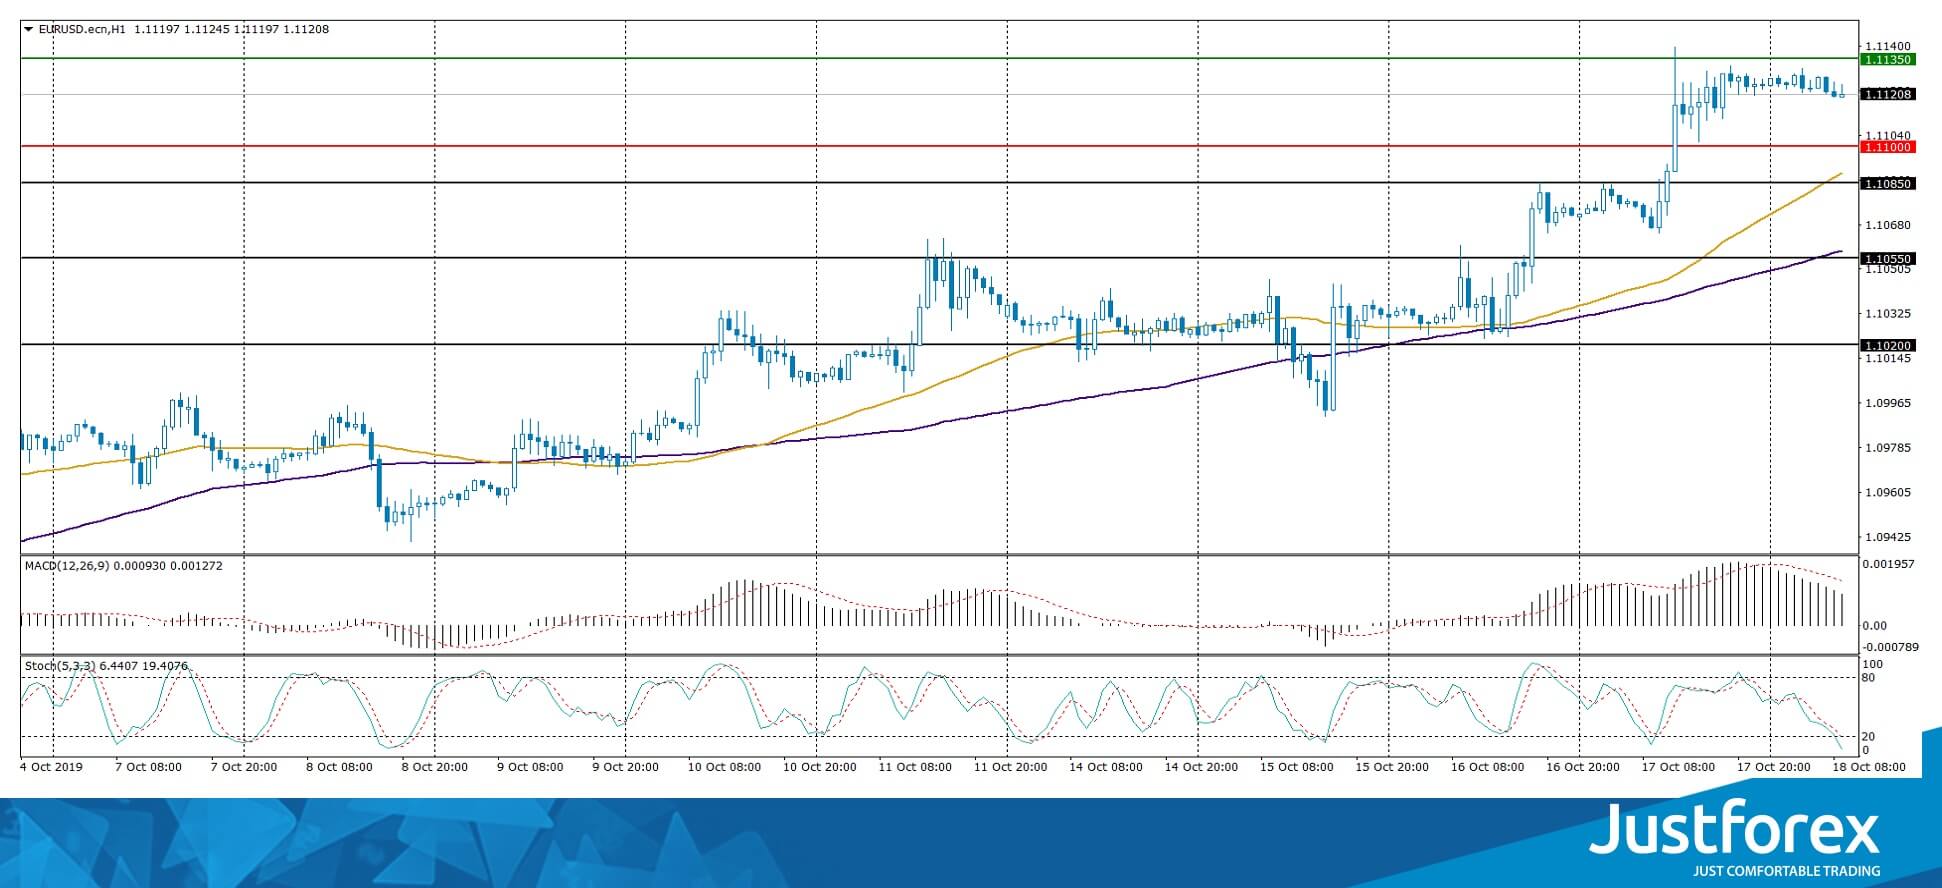
The price fixed above 50 MA and 100 MA, which signals the strength of buyers.
The MACD histogram is in the positive zone, but below the signal line, which gives a weak signal to buy EUR/USD.
The Stochastic Oscillator is in the neutral zone, the %K line is below the %D line, which indicates a bearish sentiment.
Trading recommendations
Support levels: 1.11000, 1.10850, 1.10550
Resistance levels: 1.11350, 1.11500, 1.11800
If the price consolidates above 1.11350, expect further growth toward 1.11600-1.11800.
Alternatively, the quotes could decrease toward 1.10700-1.10500.
The GBP/USD currency pair
Technical indicators of the currency pair:
Prev Open: 1.28255
Open: 1.28907
% chg. over the last day: +0.26
Day’s range: 1.28395 – 1.28909
52 wk range: 1.1959 – 1.3385
The GBP/USD currency pair continues to consolidate. Unidirectional trends are not observed. At the moment, the trading instrument is consolidating in the range 1.27800-1.29000. EU representatives and UK parliamentarians agreed on a deal on Brexit. This compromise avoids the hard Brexit scenario. Investors are waiting for the EU summit, at which lawmakers must approve this agreement. We recommend opening positions from key levels.
The Economic News Feed for 18.10.2019 is calm.
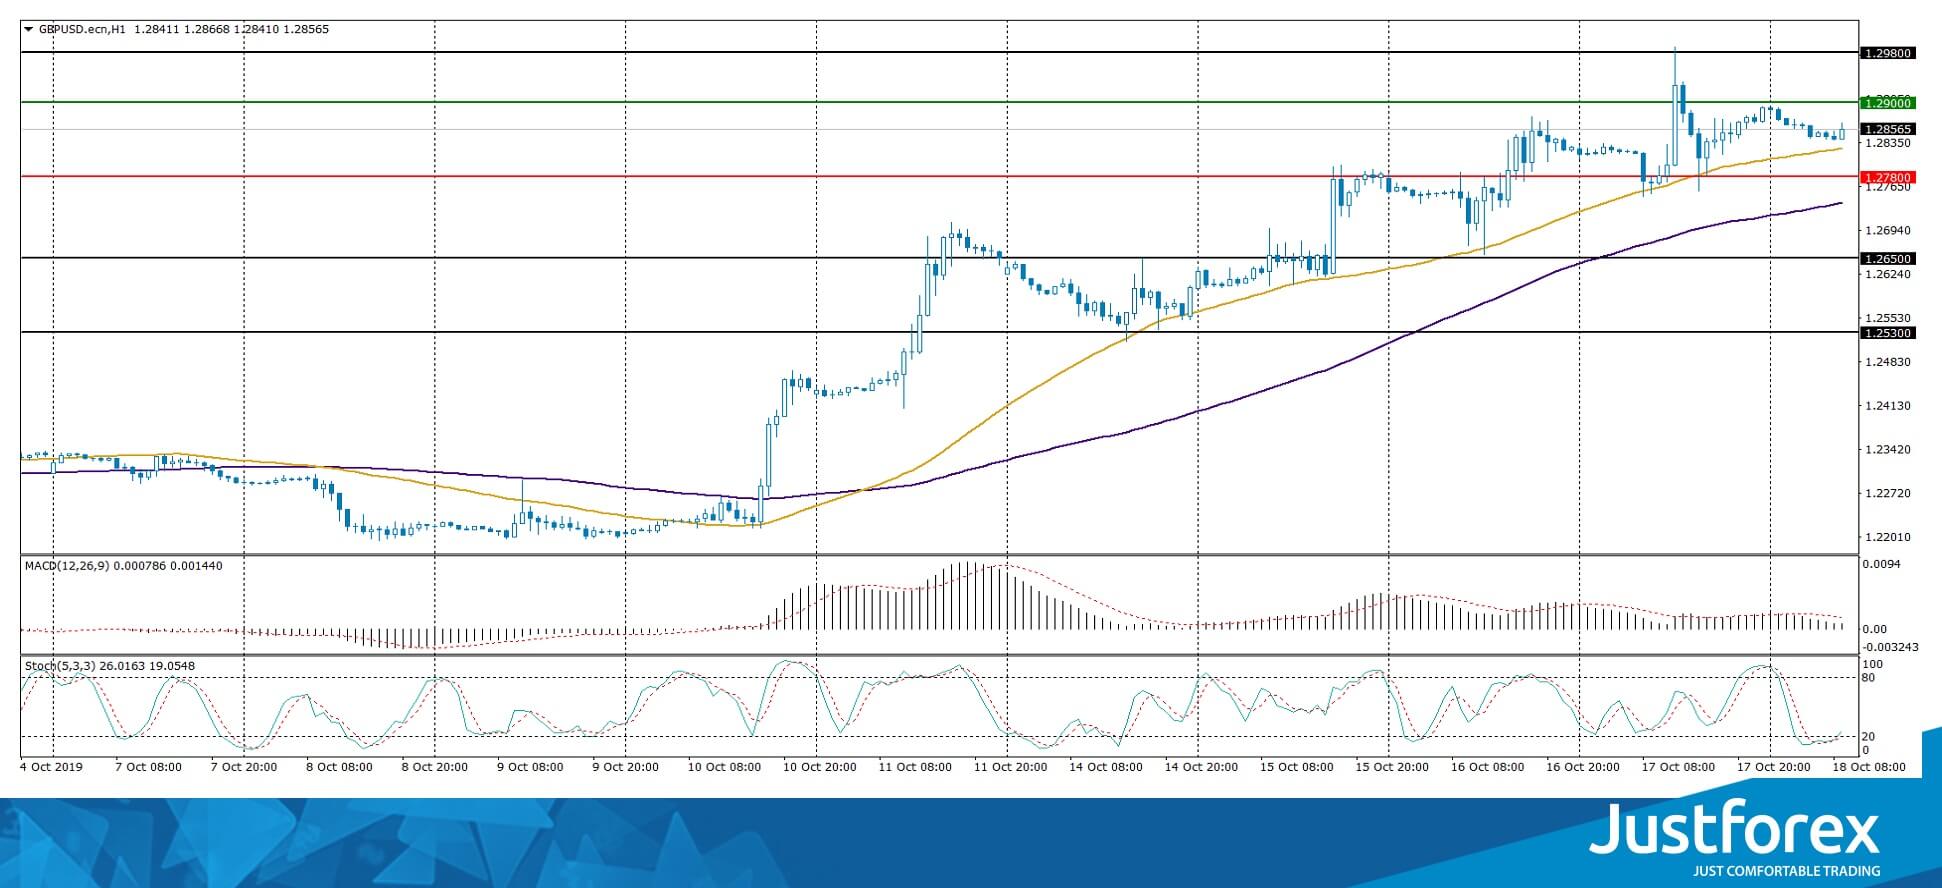
Indicators do not give accurate signals: the price is testing 50 MA.
The MACD histogram has approached the 0 mark.
The Stochastic Oscillator is in the oversold zone, the %K line crossed the %D line. There are no signals at the moment.
Trading recommendations
Support levels: 1.27800, 1.26500, 1.25300
Resistance levels: 1.29000, 1.29800
If the price consolidates above 1.29000, expect further growth toward 1.29800-1.30500.
Alternatively, expect a decrease toward 1.27000-1.26500.
The USD/CAD currency pair
Technical indicators of the currency pair:
Prev Open: 1.31997
Open: 1.31352
% chg. over the last day: -0.50
Day’s range: 1.31314 – 1.31448
52 wk range: 1.2727 – 1.3664
The USD/CAD currency pair again went down. The trading instrument has set new local lows. Looney is currently consolidating in the range 1.31300-1.31600. The technical picture signals a further fall in the USD/CAD quotes. The Canadian dollar is further supported by the positive dynamics of oil quotes. We recommend opening positions from key levels.
The Economic News Feed for 18.10.2019 is calm.
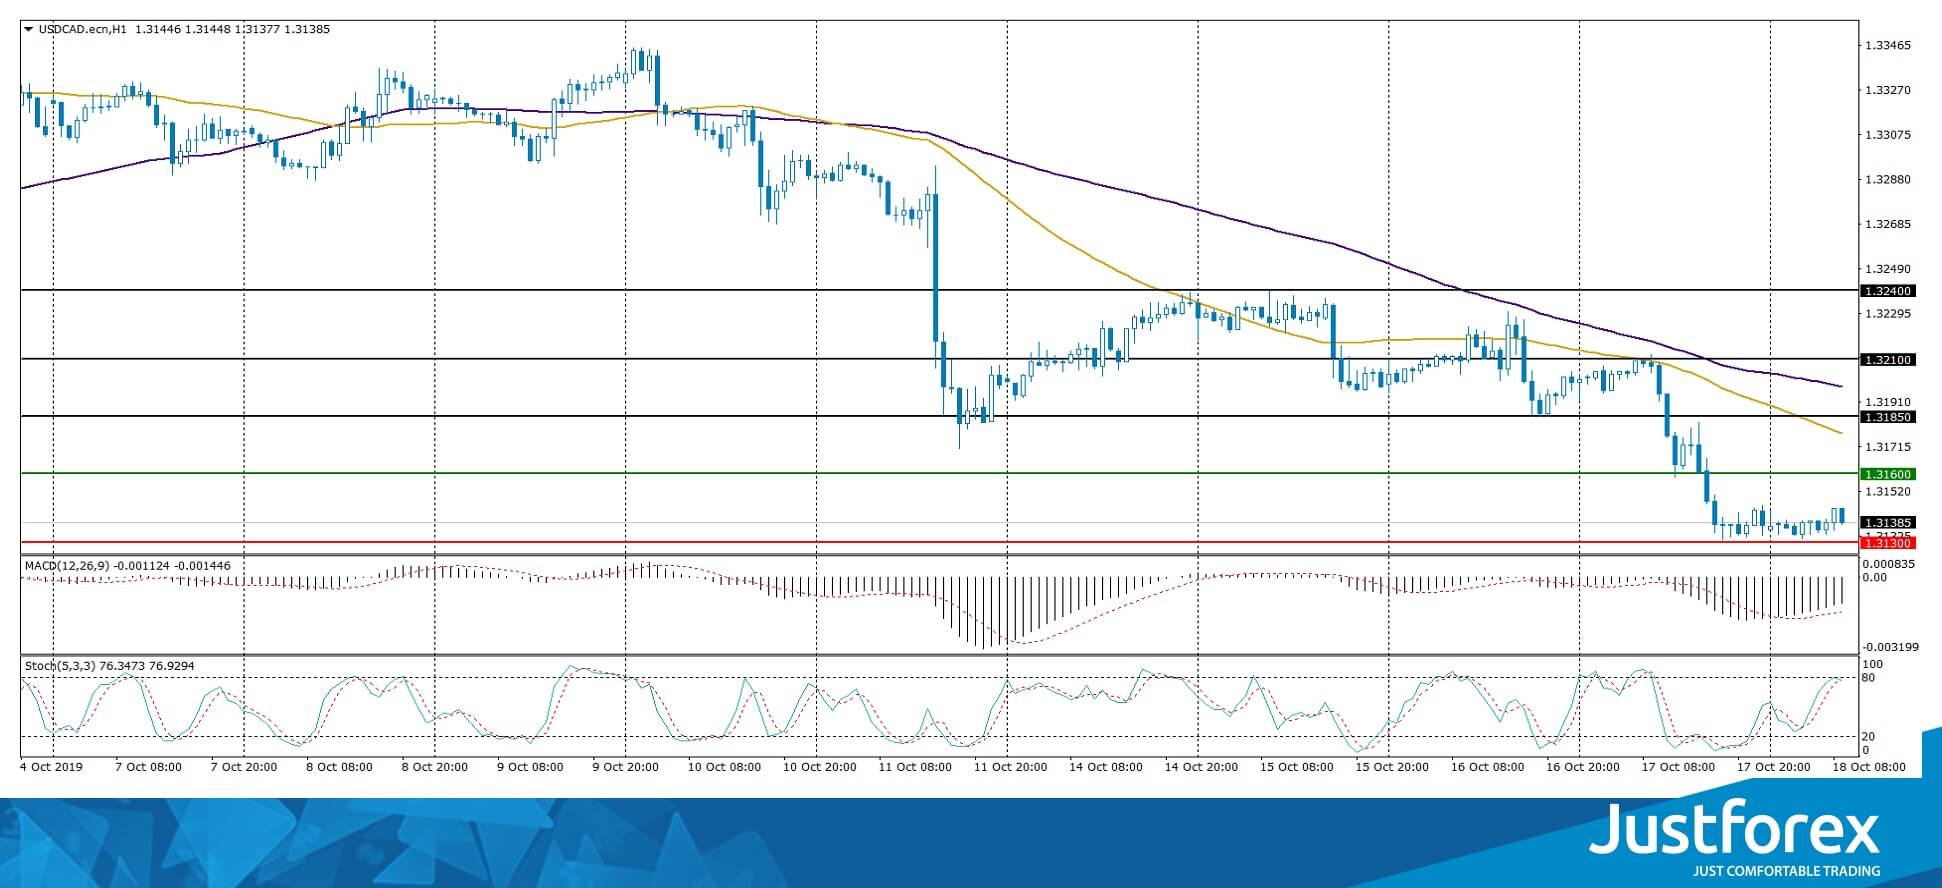
Indicators point to the strength of sellers: the price has fixed below 50 MA and 100 MA.
The MACD histogram is in the negative zone, but above the signal line, which gives a weak signal to sell USD/CAD.
The Stochastic Oscillator is near the overbought zone, the %K line crossed the %D line. There are no signals at the moment.
Trading recommendations
Support levels: 1.31300, 1.31000
Resistance levels: 1.31600, 1.31850, 1.32100
If the price consolidates below 1.31300, expect a further drop toward 1.31000-1.30800.
Alternatively, expect the quotes to grow toward 1.31900-1.32100.
The USD/JPY currency pair
Technical indicators of the currency pair:
Prev Open: 108.751
Open: 108.648
% chg. over the last day: -0.17
Day’s range: 108.516 – 108.685
52 wk range: 104.97 – 114.56
The USD/JPY currency pair continues to trade flat. Unidirectional trends are not observed. At the moment, the following key support and resistance levels can be identified: 108.450 and 108.900, respectively. In the near future, the technical correction of the USD/JPY quotes is not ruled out. Market participants expect up-to-date information regarding trade negotiations between Washington and Beijing. Positions must be opened from key levels.
The Economic News Feed for 18.10.2019 is calm.
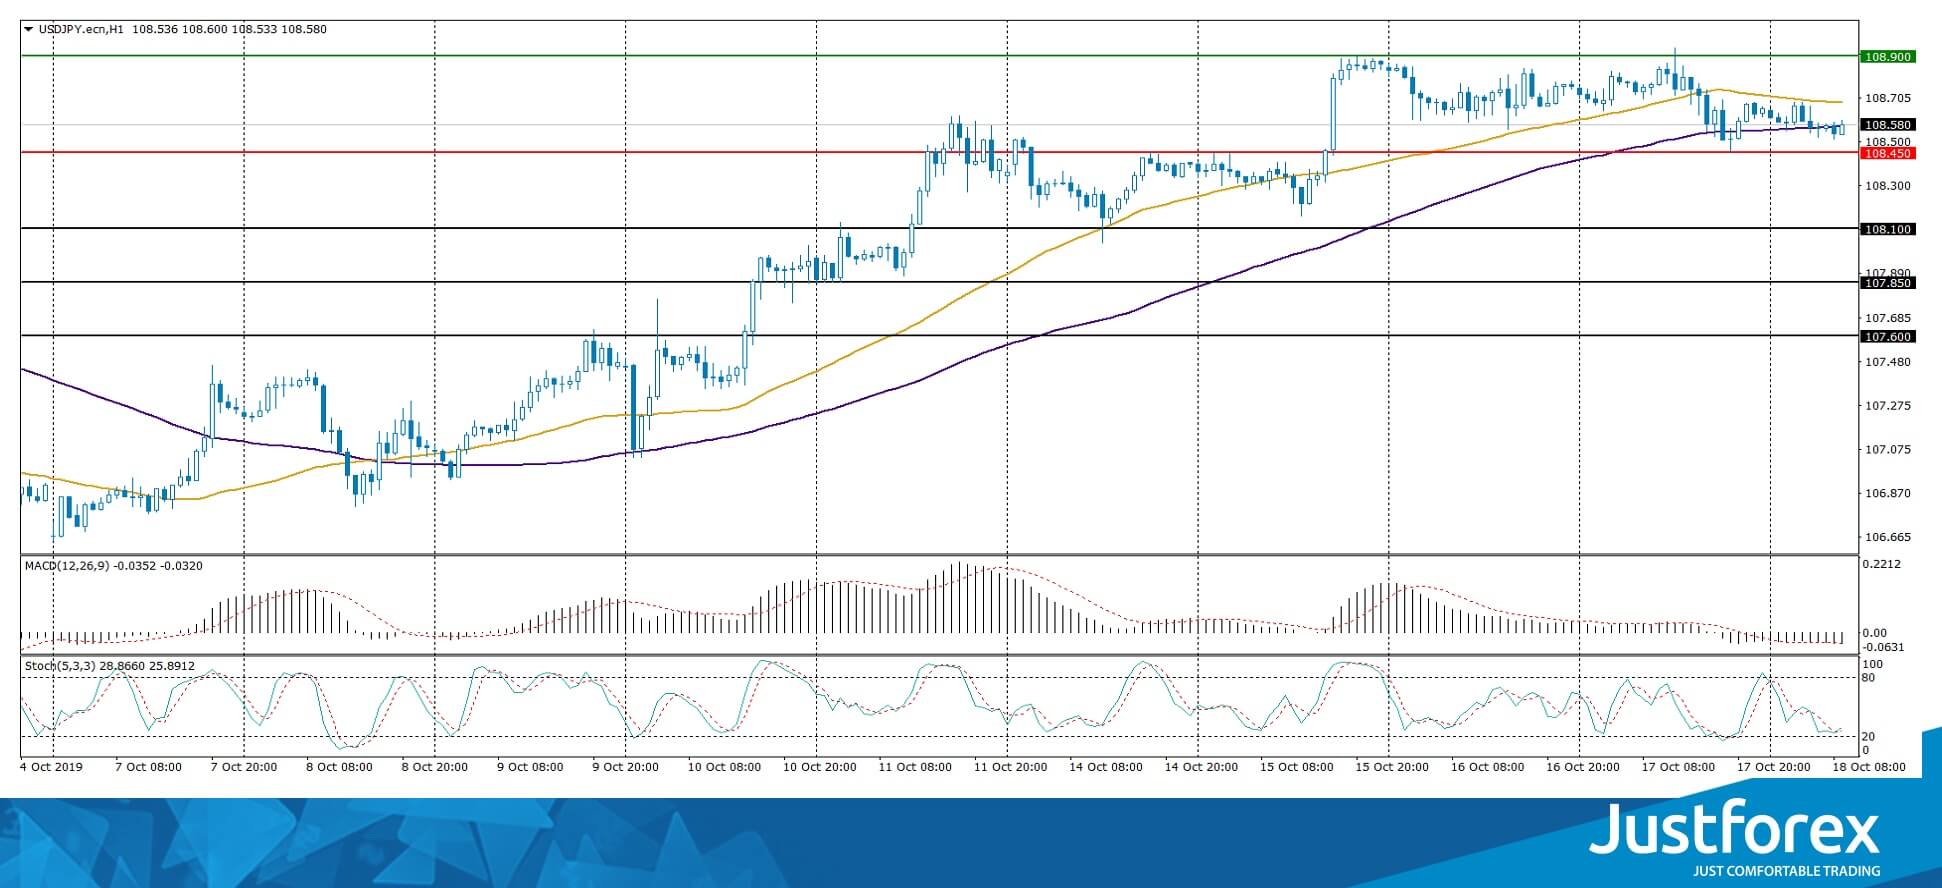
Indicators do not give accurate signals: the price crossed 50 MA and 100 MA.
The MACD histogram has moved into the negative zone, which indicates the strength of sellers.
The Stochastic Oscillator is in the neutral zone, the %K line crossed the %D line. There are no signals at the moment.
Trading recommendations
Support levels: 108.450, 108.100, 107.850
Resistance levels: 108.900, 109.300, 109.600
If the price consolidates above 108.900, expect further growth toward 109.300-109.500.
Alternatively, expect them quotes to decrease toward 108.100-107.800.


