Sample Category Title
US-Iran Deal Paves Way to Reopen Hormuz – BoJ Hikes to 1.0%
In Focus Today
The US-Iran deal is in the spotlight after a series of overnight updates. The agreement has effectively been signed, ending the US naval blockade of Iranian ports, reopening the Strait of Hormuz and launching 60 days of nuclear talks. Trump said ships are already moving and Hormuz will be fully open by Friday, though mine clearance will take time. Passage is expected to be toll-free for at least 60 days, with Iran and Oman managing the strait thereafter. Details remain unclear, and Israel's leadership and Hezbollah's ongoing attacks underscore persistent regional tensions.
In Sweden, the NIER releases its economic forecast, providing an update on consumer and business sentiment and, crucially, new information on price plans, which are highly important for the Riksbank.
In Germany, the ZEW survey is released and will provide a first assessment of sentiment in June. Though it remains at low historical levels, the May survey was slightly better than expected as expectations improved.
Economic and Market News
What Happened Overnight
In Japan, the Bank of Japan (BoJ) raised its policy rate by 25bps to 1.0%, the highest level since 1995. The vote split was 7-1, with Governor Ueda absent due to hospitalization. The BoJ signaled further rate hikes and outlined a gradual reduction in JGB purchases, effectively pausing quantitative tightening from 2027. Market reaction was modest, leaving USD/JPY just above 160 and keeping intervention risk alive ahead of tomorrow's FOMC meeting, with Deputy Governor Uchida now in focus.
China's latest monthly releases underscored a deepening two-speed economy. Retail sales fell from 0.2% y/y in April to -0.6% y/y in May, while property investment slumped further and new home prices continued to decline, although sales appear to be stabilizing. In contrast, industrial production accelerated to 4.5% y/y from 4.1% y/y. The figures argue for more consumer stimulus, but Beijing may refrain as external demand and technology continue to underpin growth and deflationary pressures have eased.
In Australia, the RBA left its policy rate unchanged at 4.35%, in line with market expectations. This follows a 25bp hike in May, the third increase in 2026, as the RBA responds to persistent inflationary pressures. Higher energy prices linked to the Middle East conflict and broader capacity pressures are key drivers. The unemployment rate rose in April, although other labour market indicators remain relatively resilient, while growth in consumer spending is slowing.
What Happened Yesterday
ECB speeches: Lagarde described the US-Iran ceasefire as "good news" if confirmed, potentially easing energy tensions, but warned that key issues remained unresolved. Nagel saw no near-term relief for euro area inflation, noting that oil supply normalization would take months and keeping all rate options open. Kazimir stressed that oil-related damage could not be reversed quickly and signaled that further monetary tightening was likely.
In Sweden, unemployment measured by the Labour Force Survey rose to 8.8% in May from 8.5% in April. The survey has become increasingly volatile, and Statistics Sweden has noted that non-response composition may have led to overestimated unemployment in March and underestimated employment in March and April. By contrast, the Public Employment Service's less volatile statistics have shown unchanged unemployment for five consecutive months.
Equities: Who would have imagined European equities underperforming on the day of the Iran peace headlines? However, that is exactly what happened. European equities started strongly only to grind lower throughout the session. By the closing bell, the Stoxx 600 was only 0.2% higher. Rate-sensitive sectors and styles underperformed; banks outperformed real estate, large caps outperformed small caps, and so on. This was not the textbook reversal where companies most negatively affected by higher energy prices or rates staged the strongest rebound. Instead, the sector rotation was more consistent with cyclical outperformance funded by defensives, reflecting the surprisingly limited reaction in bond markets.
The limited reaction in European equities stands out even more in contrast to the much stronger move in US markets. There, equities ended sharply higher with the S&P 500 gaining 1.7%, helped by a rebound in technology shares, while consumer discretionary, materials and industrial stocks also advanced around 1%. Memory and semiconductor names rallied strongly, with Micron, AMD and Lam Research gaining around 10% in a single session.
FI and FX: The BoJ hiked rates by 25bps to 1.00% as expected, the highest policy rate since 1995, and signaled further hikes ahead. USD/JPY showed very little reaction and continues to trade above the 160 threshold, as the move was widely anticipated. Brent crude is trading broadly unchanged around USD 83/bbl. European rates stabilized yesterday after the initial rally, while US Treasury yields have started to move higher again this morning, with the 10-year yield back near Friday's closing levels. China published a batch of data showing a concerning picture of weakening consumer demand. Trump and JD Vance have signed an electronic copy of the memorandum of understanding, although very few details of the agreement have been released.
Elliott Wave View: Dow Futures (YM) Breakout Signals Start of New Bullish Phase
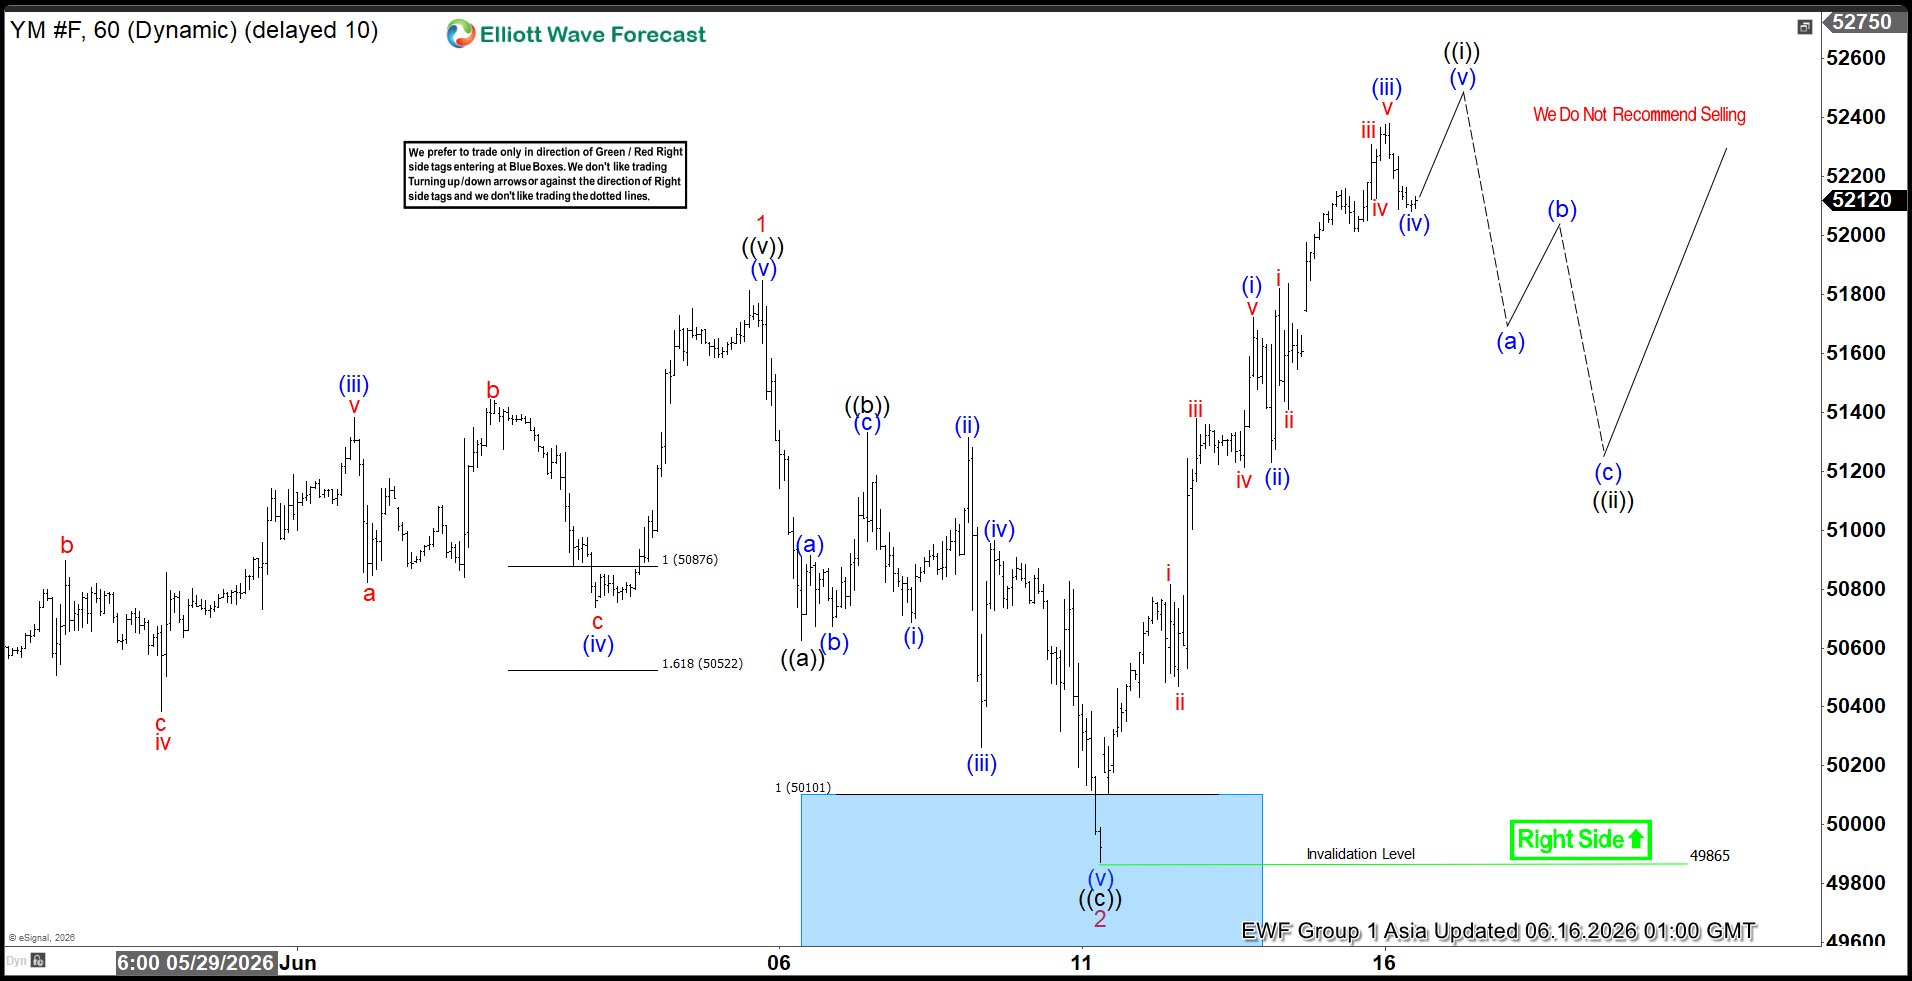
Dow Futures (YM_F) ended their correction against the cycle from the March 30, 2026 low and extended higher. The rally from that low completed wave 1. The pullback in wave 2 unfolded as a zigzag Elliott Wave structure. Within this correction, wave ((a)) ended at 50624, wave ((b)) concluded at 51331, and wave ((c)) finished at 49865. This sequence confirmed the completion of wave 2 at a higher degree.
The Index has since resumed higher in wave 3. From the end of wave 2, wave (i) reached 51723, while the pullback in wave (ii) ended at 51230. The advance continued with wave (iii) finishing at 52380. The subsequent pullback in wave (iv) is proposed complete at 52080. Near term, expectations favor another leg higher in wave (v). That move should complete wave ((i)) of the larger degree. Afterward, a corrective phase in wave ((ii)) is anticipated. This correction will address the cycle from the June 11, 2026 low before the broader rally resumes.
As long as price remains above 49865, pullbacks should attract buyers. Corrective phases are expected to resolve within 3, 7, or 11 swings. This reinforces the bullish outlook and supports further upside potential.
Dow Futures (YM_F) 60-Minute Elliott Wave Chart
YM_F Elliott Wave Video:
https://www.youtube.com/watch?v=K1xiAKuAZlk
AUD/JPY Weakens After BoJ Hike and RBA Hold, Risks Build Towards 112 and Below
The Bank of Japan hiked. The Reserve Bank of Australia paused. Neither decision surprised markets. Yet the reaction in AUD/JPY may be telling a more important story.
The cross drifted lower after the BoJ raised rates by 25 basis points to 1.00%, the highest level since 1995, while the RBA kept rates unchanged at 4.35%. On paper, neither outcome represented a major policy surprise. But traders appear to have come away more convinced that Japan's normalization cycle still has room to run than that Australia is preparing another near-term rate increase. That subtle shift in expectations is beginning to work against AUD/JPY.
The BoJ's message was straightforward. Inflation risks are still tilted to the upside, helped by higher energy costs and a weak Yen. However, the 7-1 vote also highlighted ongoing caution within the Board, with one member arguing that risks to growth and employment outweighed inflation concerns. There was no strong signal that policymakers are preparing to accelerate tightening. Instead, the market's base case remains another rate increase by the end of the year. Even so, that is enough to keep the Yen supported.
The RBA, meanwhile, delivered what can best be described as a hawkish hold. Officials warned that inflation remains too high and acknowledged that higher fuel costs are feeding into broader prices. But they also pointed to slowing consumer spending, softer housing activity and signs that tighter policy is gaining traction. The statement kept the door open to another hike if needed, yet stopped well short of signaling that August is the likely timing. For traders hoping for a stronger tightening signal, that was a disappointment.
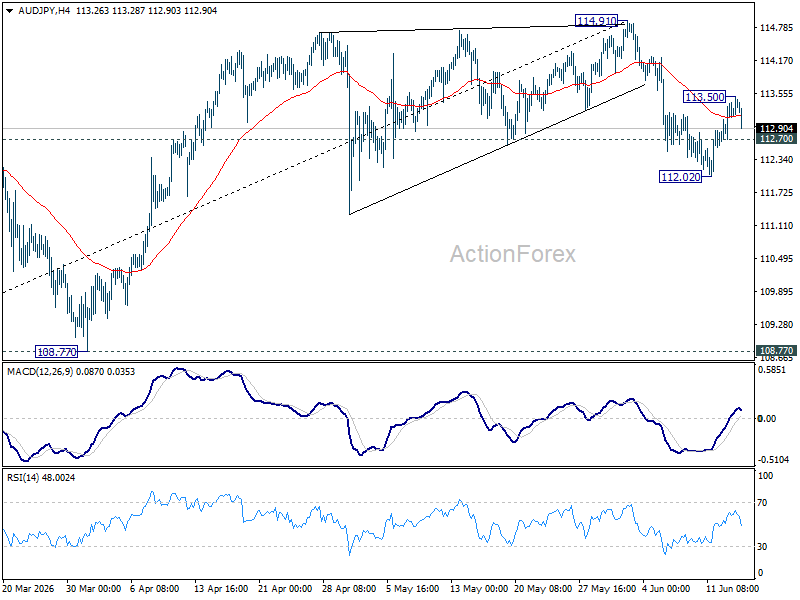
Technically, the picture is becoming more interesting. AUD/JPY has slipped below its 55 4H EMA, raising the possibility that the recovery from 112.02 to 113.50 has already run its course. A break of 112.70 would expose the 112.02 low, while a decisive move below that support would confirm that the decline from 114.91 is resuming.
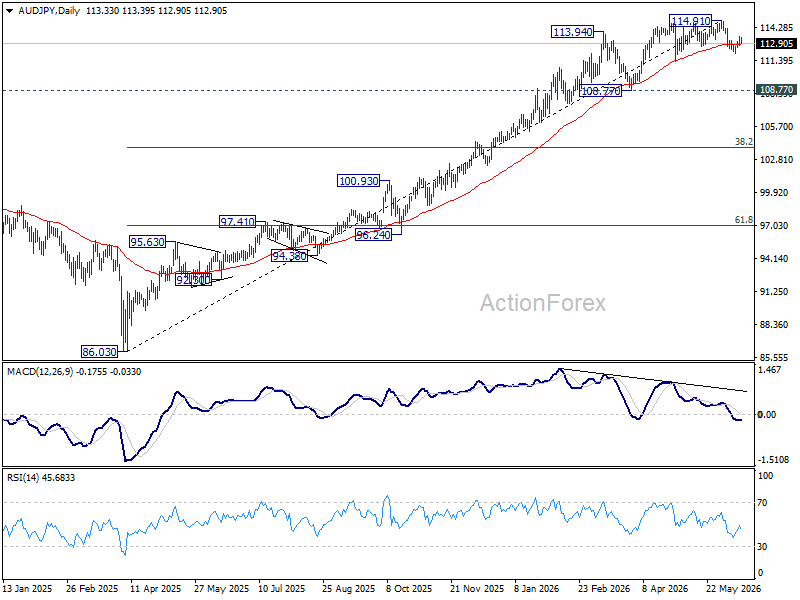
The bigger risk lies beyond the short-term charts. Bearish divergence on D MACD is visible. If AUD/JPY breaks 112.02 and establishes itself below 55 D EMA (now at 112.83) sustainably, the case for a medium-term correction would strengthen considerably. In that scenario, a move back toward 108.77 becomes increasingly plausible.
The policy gap between Australia and Japan remains wide, but it is no longer moving decisively in Australia's favor. That may be the first warning sign that AUD/JPY's powerful rally is finally running out of steam.
RBA Holds at 4.35% but Keeps Tightening Bias Alive
The Reserve Bank of Australia left the cash rate unchanged at 4.35% as widely expected, with the accompanying statement carried a distinctly hawkish tone. While policymakers acknowledged that financial conditions have tightened following three rate hikes this year and that the economy is slowing as expected, they repeatedly stressed that inflation remains a problem. The Board noted that "headline and underlying inflation are still too high" and warned that "inflation is likely to remain high for some time."
A key focus of the statement was the impact of the Middle East energy shock. The RBA said that "higher fuel prices have added directly to inflation" and that there are signs these costs are now "passing through to the prices of other goods and services." It also cautioned that the resolution of the conflict remains "at an early stage" and that global oil supply issues "will take some time to resolve," suggesting policymakers are not yet ready to assume a rapid easing in inflation pressures.
Still, the statement stopped short of signaling that another rate hike is imminent. The Board highlighted slowing consumer spending, softer housing market conditions and a higher-than-expected unemployment rate as evidence that tighter policy is gaining traction. The overall message is more hawkish than a simple hold, but not hawkish enough to make an August hike the base case.
Instead, the RBA appears content to wait for additional data while retaining an explicit tightening bias, reiterating that "it will do what it considers necessary to achieve that outcome, including increasing the cash rate target further if required".
(RBA) Statement by the Reserve Bank Board: Monetary Policy Decisions
At its meeting today, the Board decided to leave the cash rate target unchanged at 4.35 per cent.
Inflation picked up materially in the second half of 2025, and information since the beginning of this year confirms that some of the increase reflected greater capacity pressures. The latest data show that headline and underlying inflation are still too high. Oil prices have eased in recent weeks, although energy and most related commodity prices remain higher than they were prior to the conflict in the Middle East. There are signs that some firms experiencing cost pressures are increasing the prices of their goods and services and others are looking to do so. Short-term measures of inflation expectations have eased but remain higher than earlier in the year.
Financial conditions have tightened this year in response to three increases in the cash rate target. Money market interest rates and government bond yields have risen, and the exchange rate has appreciated. There are signs that growth in consumer spending is slowing as expected and momentum in the housing market has shifted, with housing prices falling in some capital cities. The unemployment rate was higher than expected in April, but other measures of labour market conditions have been more resilient. Growth in business investment is strong and credit is readily available to both households and businesses.
There continue to be heightened uncertainties about the outlook for domestic economic activity and inflation. Resolution of the conflict in the Middle East is at an early stage, and there are plausible scenarios where inflation is higher and activity lower than envisaged under the May baseline forecasts. Global oil supply issues will take some time to resolve, maintaining upward pressure on global energy prices and inflation. At the same time, a period of prolonged uncertainty may also cause growth to be lower in Australia’s major trading partners and in Australia.
Decision
As expected, the disruption to global oil supply is having an impact on inflation. Higher fuel prices have added directly to inflation and there are indications that this is passing through to the prices of other goods and services, so inflation is likely to remain high for some time. This inflation impulse is in addition to the high inflation recorded around the start of 2026, reflecting capacity pressures in the economy.
The Board remains focused on ensuring that inflation does not become embedded once the impulse from higher oil prices has passed through. To achieve this, growth in demand needs to slow to reduce capacity pressures and help bring inflation back to target. Following the three increases in the cash rate target since the beginning of the year, financial conditions are now tighter than they were, and there are signs that the economy is slowing as expected. But inflation is still too high and the Board judged that it was appropriate to leave the cash rate target unchanged while it assesses the response to previous interest rate rises and the impact of the oil supply disruption.
The Board will be attentive to the data and the evolving assessment of the outlook and risks to guide its decisions. In doing so, it will pay close attention to developments in the global economy and financial markets, trends in domestic demand and the outlook for inflation and the labour market. Monetary policy is well placed to respond to developments and the Board is focused on its mandate to deliver price stability and full employment. It will do what it considers necessary to achieve that outcome, including increasing the cash rate target further if required.
Today’s policy decision was unanimous.
BoJ Reaches Key Milestone With First 1% Interest Rate Since 1995
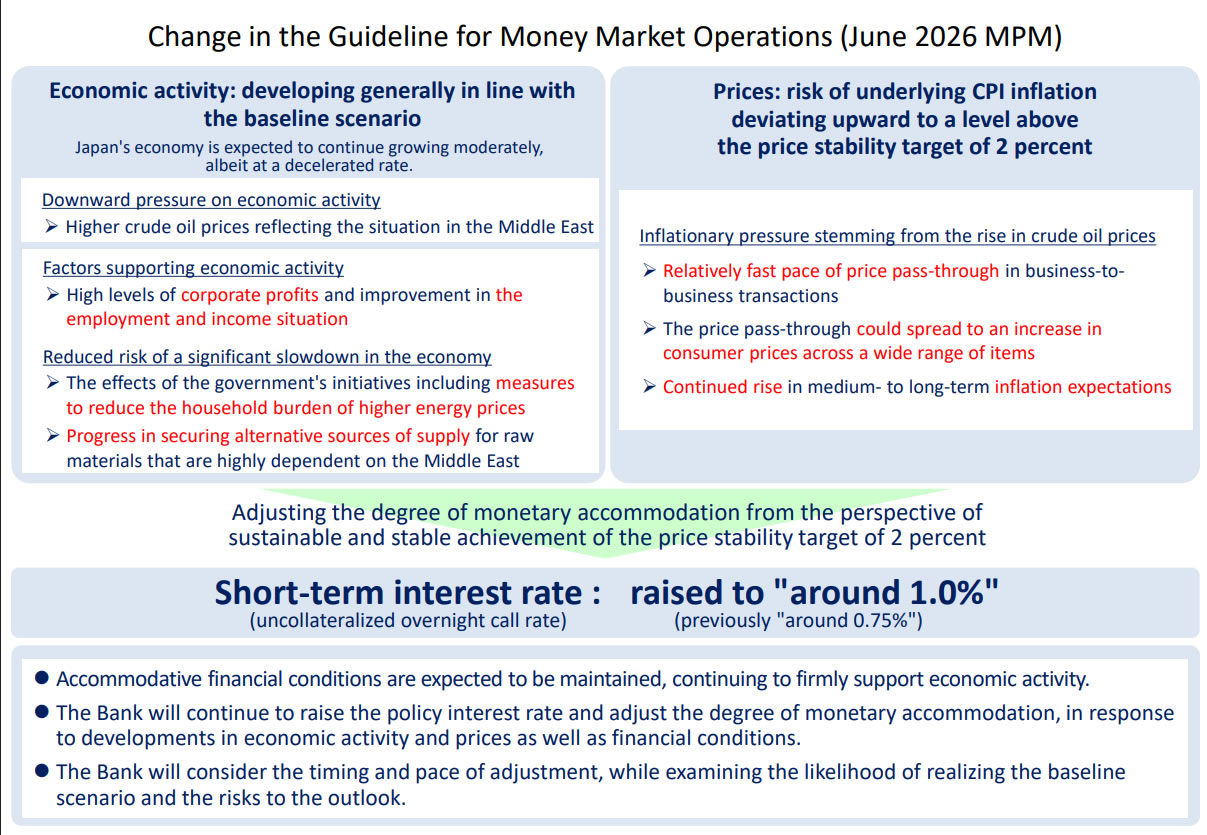
The Bank of Japan raised its policy rate by 25 basis points to 1.00%, as widely expected, marking the highest interest rate level in 31 years and the first time since 1995 that rates have reached 1%. The move follows December's increase from 0.50% to 0.75% and represents another step in the central bank's gradual normalization process after decades of ultra-loose monetary policy.
The decision was approved by a 7-1 majority vote. Board member Toichiro Asada dissented, arguing that downside risks to production and employment stemming from the Middle East situation outweighed upside risks to inflation. He therefore favored leaving policy unchanged. The meeting was also notable for the absence of Governor Kazuo Ueda, who is currently hospitalized for treatment of a hepatic cyst infection, leaving other policymakers to guide communications around the decision.
Alongside the rate increase, the BoJ announced adjustments to its government bond purchase program. The central bank will continue reducing Japanese government bond purchases by around JPY 200bn per quarter through March 2027, maintaining its current pace of quantitative tightening. However, from April 2027 onward, it plans to slow the pace of reductions, a move that comes as long-term Japanese bond yields have risen sharply in recent months.
Under the revised plan, monthly bond purchases will decline to around JPY 2.1tn by the January-March quarter of 2027. The combination of a rate hike and a more cautious approach to future balance-sheet reduction suggests the BoJ remains committed to policy normalization, while also seeking to avoid excessive volatility in the government bond market. Markets will now look to July's updated projections and the eventual return of Ueda for clearer guidance on how far rates could rise from here.
China’s Retail Sales Fall for First Time Since 2022 as Domestic Demand Slumps
China's latest activity data painted a mixed picture of the economy in May, with stronger factory output masking a sharp deterioration in domestic demand. Industrial production accelerated from 4.1% yoy to 4.5% yoy, beating market expectations of 4.2%y yoy and suggesting manufacturers continued to expand output despite slowing conditions elsewhere in the economy.
The more concerning developments came from consumption and investment. Retail sales dropped from 0.2% yoy to -0.6% yoy, marking the first year-on-year decline in more than three years.
Fixed-asset investment also weakened significantly, falling from -1.6% ytd yoy to -4.1% ytd yoy. The property sector remained a major drag, with real estate investment inflows down -16.2% in the first five months of the year. Manufacturing investment slipped into contraction for the first time since late 2020, while infrastructure spending also declined.
The divergence reinforces concerns that China's growth model remains heavily reliant on production while domestic demand struggles to gain traction. In an unusually direct assessment, the statistics bureau described the imbalance between strong supply and weak demand as "acute." The comments suggest policymakers may face increasing pressure to introduce measures aimed at supporting employment and household spending, particularly as investment activity continues to lose momentum.
| Indicator | Apr | May | Expected |
|---|---|---|---|
| Industrial Production Y/Y | 4.1% | 4.5% | 4.2% |
| Retail Sales Y/Y | 0.2% | -0.6% | 0.0% |
| Fixed Asset Investment YTD Y/Y | -1.6% | -4.1% | -2.0% |
Bitcoin Climbs Off the Lows, Facing a Wall of Resistance Ahead
Key Highlights
- Bitcoin tested $60,000 before it started a recovery wave.
- BTC/USD traded above a bearish trend line with resistance at $62,500 on the 4-hour chart.
- Ethereum recovered by over 10% and climbed above $1,750.
- WTI Crude Oil prices extended losses and traded below $82.00.
Bitcoin Price Technical Analysis
Bitcoin price extended losses and tested $60,000 against the US Dollar. BTC formed a base above $60,000 and recently recovered some losses.
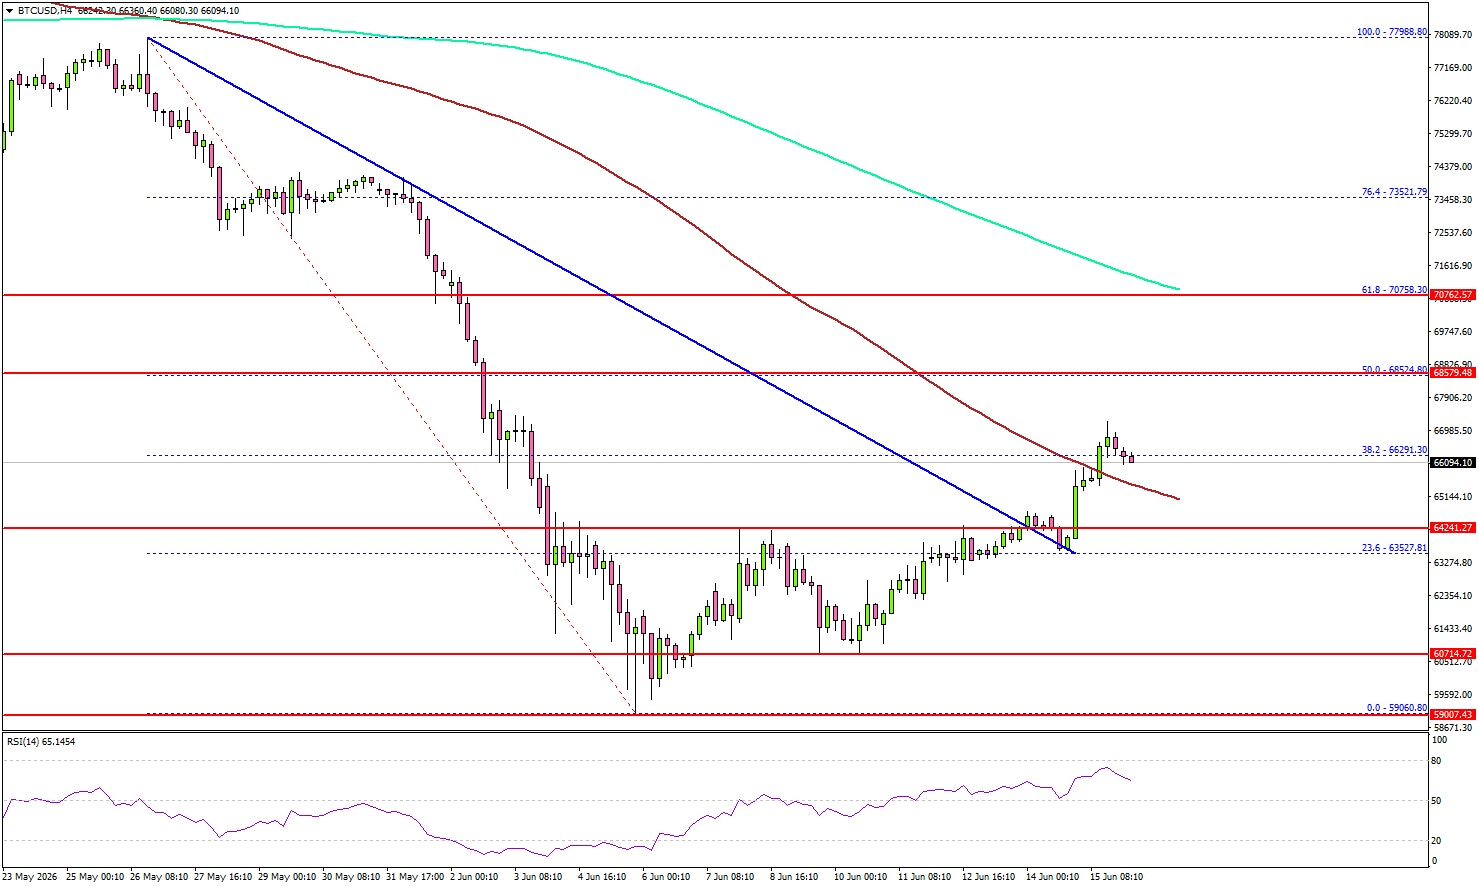
Looking at the 4-hour chart, the price climbed above the $62,500 and $63,500 resistance levels. The price traded above a bearish trend line with resistance at $62,500. It opened the doors for a move above the 38.2% Fib retracement level of the downward move from the $77,988 swing high to the $59,060 low.
Moreover, the price surpassed the $65,000 level and the 100 simple moving average (red, 4-hour). If the price extends gain, there could be a test of the 50% Fib retracement level at $68,500.
The main resistance sits near $70,000 and the 200 simple moving average (green, 4-hour). A close above $70,000 could send the price toward $73,200. Any more gain might call for a test of $75,000.
If there is a fresh decline, immediate support might be $65,000 and the 100 simple moving average (red, 4-hour). The first key support could be $64,200. The main breakdown support could be $63,500. A downside break below $63,500 might start another decline. The next major support might be $60,000, below which BTC could decline toward $58,000.
Looking at Ethereum, the price also started a recovery wave and was able to surpass the $1,750 resistance zone.
Today’s Key Economic Releases
- US Import Price Index for May 2026 (MoM) – Forecast +1.0%, versus +1.9% previous.
- US Export Price Index for May 2026 (MoM) – Forecast +1.2%, versus +3.3% previous.
- US Housing Starts for May 2026 (MoM) – Forecast 1.430M, versus 1.465M previous.
- US Building Permits for May 2026 (MoM) – Forecast 1.420M, versus 1.423M previous.
SPX Short Term Analysis Forecasts Bullish Path to 8500
The S&P500 SPX appears to have completed a short term bearish cycle that corrected the rallies from late March 2026. The short term path continues to favor more upside. What are the next targets to take note of. How should intraday and short-term traders approach it?
The SPX completed the intermediate degree wave (2) on March 30, 2026. Since hitting this low, the index has trended higher, consistently attracting fresh buying interest. The broader bullish wave ((3)) began in April 2025 and concluded in February 2026, with the February peak identified as wave (1) of ((3)). A subsequent wave (2) pullback completed a 7-swing structure within the 6508-6298 blue box zone in late March 2026. Members successfully entered long positions at this blue box and achieved all major targets. This post outlines the setup for educational purposes.
SPX Elliott Wave Analysis – Short term, 13th June Update
Starting from the March 2026 low, a new bullish cycle initiated for wave 1 of (3), which peaked in early June. Following this, we observed a pullback for wave 2 of (3). Although we typically anticipate a 3, 7, or 11-swing structure for such corrections, this particular pullback was shallow. We identified the end of this wave based on proprietary signals shared during our live sessions, allowing us to pivot and encourage members to enter long positions within our blue box zones—a strategy that proved successful, as seen in our setup for the Dow_100 ($YM_F) HERE. While the SPX wave 2 pullback did not reach the typical extreme, we chose not to force the count and instead shared the updated analysis with members on June 13, 2026.
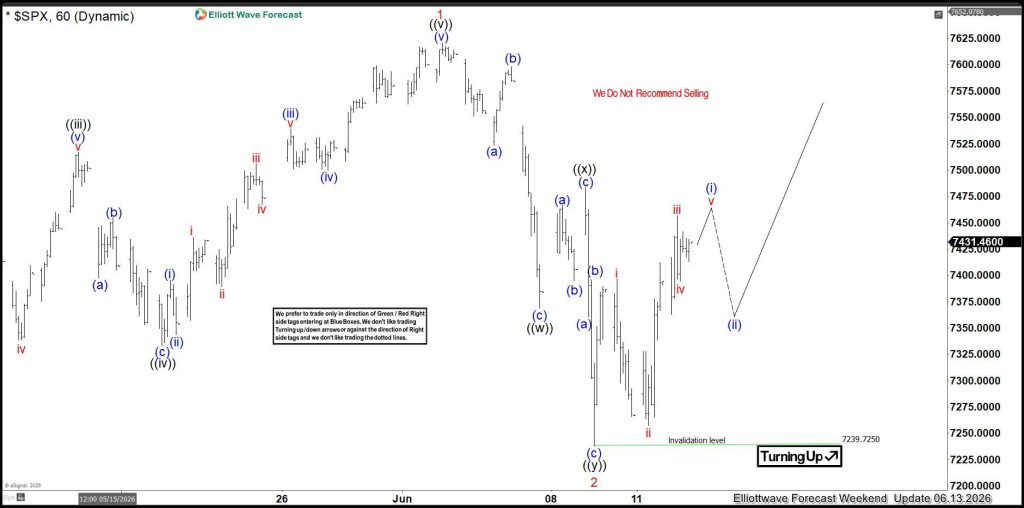
The 60-minute chart above confirms that wave 2 has concluded, signaling an expected bullish reversal. Consequently, we projected a five-wave rally from the 7239 pivot to complete wave (i) of ((i)) of 3. As the new week commenced, the market delivered the anticipated upside burst, which we have detailed in the chart below shared with our members.
SPX Elliott Wave Analysis – Short term, 16th June Update
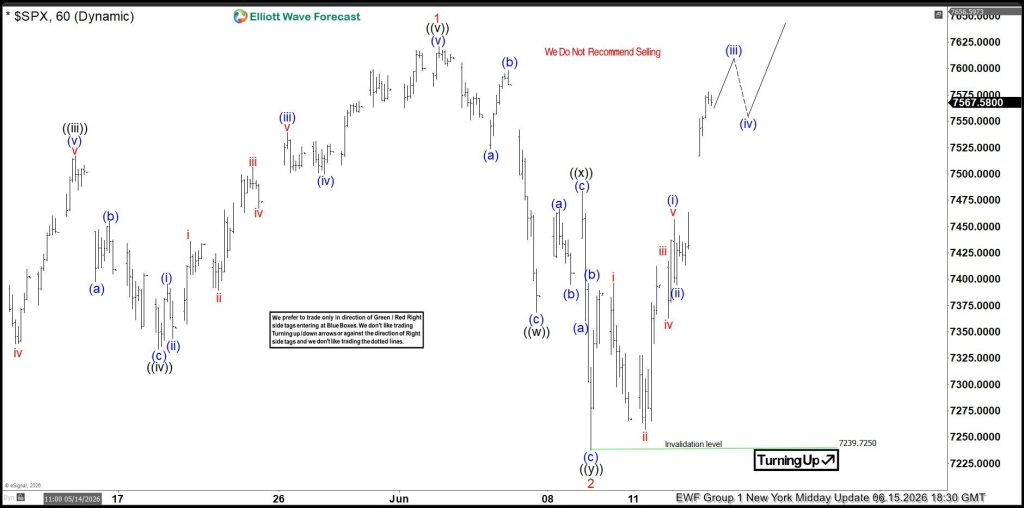
The latest chart indicates that the price is currently advancing within wave (iii) of ((i)), with the potential for wave ((i)) to establish a new high. Following this, we anticipate a pullback for wave ((ii)) before the broader bullish trend resumes. The target for wave 3 is set at a minimum of 8540, with an ideal range of 8846–9344. Once a new high is reached in June, we will look for 3, 7, or 11-swing pullbacks to identify long opportunities in the SPX, as well as in other US indices, the Nikkei, and various other markets we track. We will provide our members with updated “blue box” entry zones when the time is right. Furthermore, our daily technical videos, live analysis sessions, and 24-hour members-only chat room ensure that traders are kept informed of any market shifts and have direct access to our analysts for real-time support.
About Elliott Wave Forecast
At www.elliottwave-forecast.com, we update one-hour charts four times daily and four-hour charts once daily for all 78 instruments. We also conduct daily live sessions to guide clients on the right side of the market. Additionally, we have a chat room where moderators answer market-related questions. Experience our service with a 14-day trial for only $0.99. Cancel anytime.
Cable Remains Constructive Ahead UK CPI Data, BoE Policy Meeting
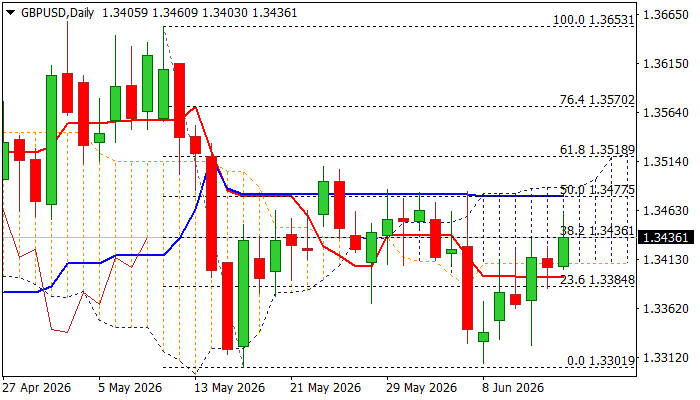
Near-term recovery from 1.3300 zone higher base has received fresh boost from improving geopolitical picture that sparked risk appetite and deflated dollar.
Although today’s action was limited, Cable remains at the front foot as traders await release of May inflation data on Wednesday (3.0% f/c vs Apr 2.8%), with CPI at/above forecast to add to expectations of BoE rate hike in the near future (the central bank MPC meets on Thursday and is widely expected to keep rates unchanged at 3.75%.
Overall near-term structure is expected to remain biased higher while the price holds above important supports at 1.3415 (200DMA) and 1.3408 (daily cloud base) and keep focus at 1.3477 (50% retracement of 1.3653/1.3301 descend)) and more significant 1.3486 barrier (cloud top), violation of which to add to upside prospects and validate base at 1.3300 zone.
Daily studies are still mixed, but 14-d momentum is about to emerge from negative territory and RSI rises above 50 zone, contributing to positive scenario.
Res: 1.3477; 1.3486; 1.3508; 1.3521
Sup: 1.3415; 1.3408; 1.3362; 1.3341