Sample Category Title
GBP/JPY Daily Outlook
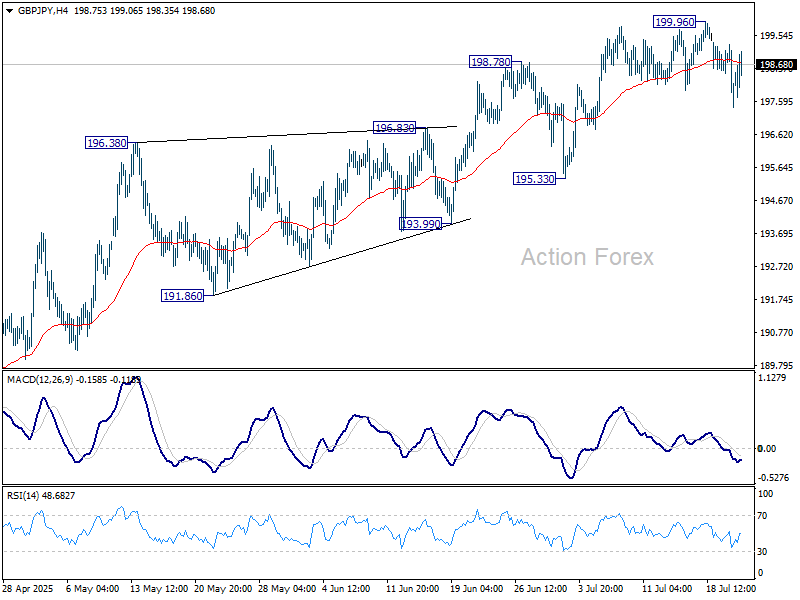
Daily Pivots: (S1) 197.51; (P) 198.40; (R1) 199.36; More...
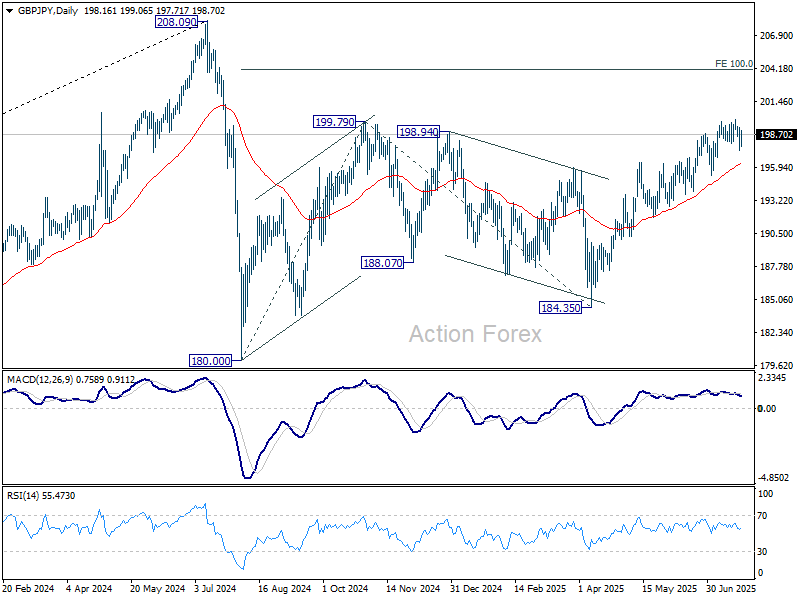
GBP/JPY is staying in consolidations below 199.96 and intraday bias remains neutral. While deeper pullback cannot be ruled out, further rally will remain in favor as long as 195.33 support holds. Above 199.96 will resume the rise from 184.35 to 100% projection of 180.00 to 199.79 from 184.35 at 204.14.
In the bigger picture, price actions from 208.09 (2024 high) are seen as a correction to rally from 123.94 (2020 low). The pattern might still extend with another falling leg. But in that case, strong support should be seen from 38.2% retracement of 123.94 to 208.09 at 175.94 to contain downside. Meanwhile, decisive break of 208.09 will confirm long term up trend resumption.
EUR/JPY Daily Outlook
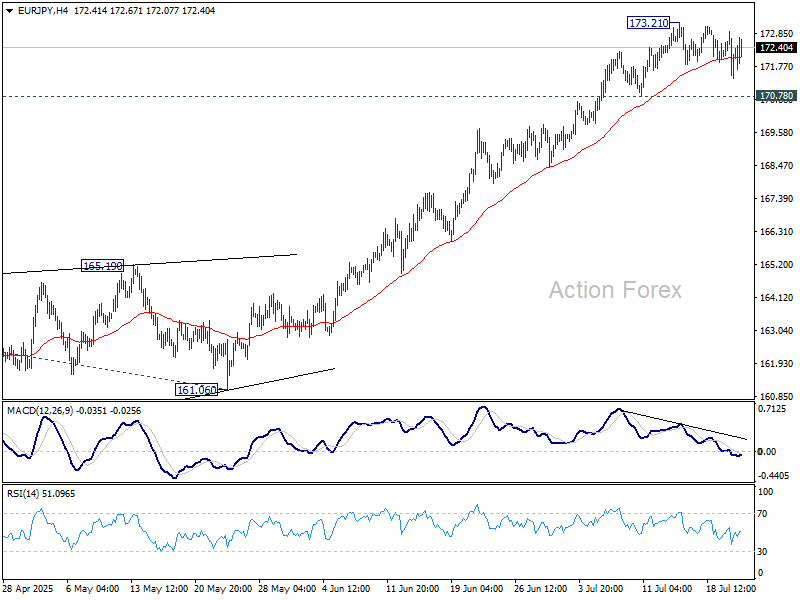
Daily Pivots: (S1) 171.52; (P) 172.23; (R1) 173.09; More...
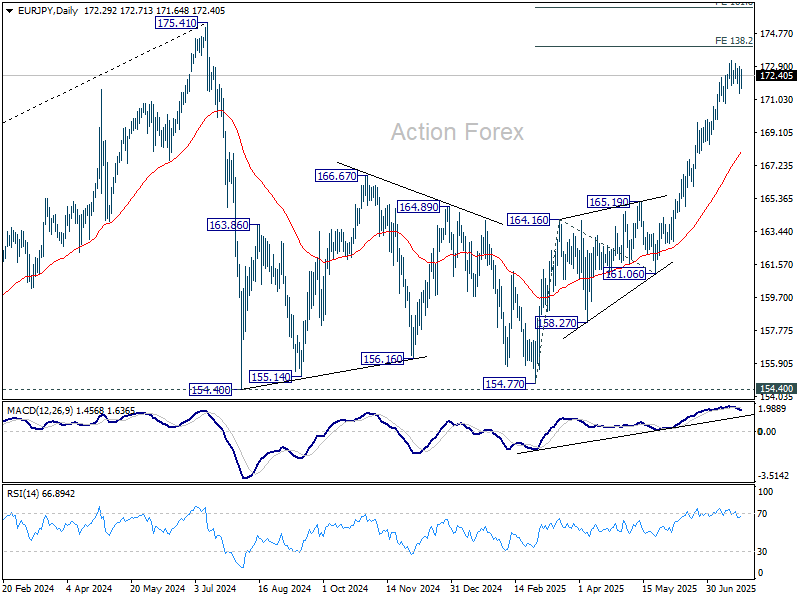
EUR/JPY is staying in consolidations below 173.21 and intraday bias remains neutral for the moment. With 170.78 support intact, further rally is expected. On the upside, break of 173.21 will target 138.2% projection of 154.77 to 164.16 from 161.06 at 174.03. Break there will bring retest of 175.41 high. Nevertheless, considering bearish divergence condition in 4H MACD, break of 170.78 will indicate short term topping, and turn bias to the downside for deeper pullback.
In the bigger picture, price actions from 175.41 (2024 high) are seen as correction to up trend from 114.42 (2020 low). The pattern might still extend with another falling leg. But in that case, strong support should be seen from 38.2% retracement of 114.42 to 175.41 at 152.11 to contain downside. Meanwhile, decisive break of 175.41 will confirm long term up trend resumption.
EUR/GBP Daily Outlook
Daily Pivots: (S1) 0.8667; (P) 0.8681; (R1) 0.8698; More...
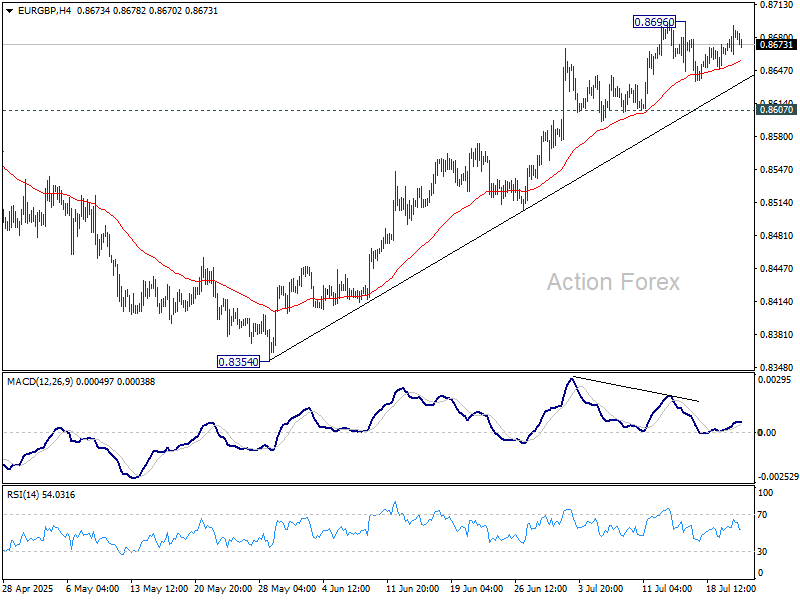
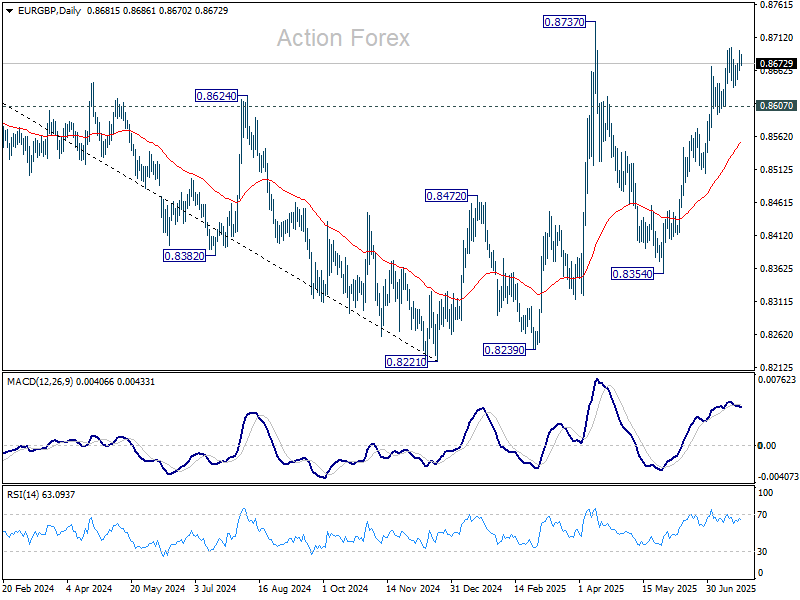
EUR/GBP is staying in consolidations below 0.8696 and intraday bias remains neutral. Further rally is expected with 0.8607 support intact. On the upside, above 0.8696 will bring retest of 0.8737 high. However, firm break of 0.8607 will confirm short term topping, on bearish divergence condition in 4H MACD. Deeper fall should be seen back to 55 D EMA (now at 0.8555).
In the bigger picture, the structure from 0.8221 medium term bottom are not impulsive enough to suggest that it's reversing the down trend from 0.9267 (2022 high). But even if it's a correction, firm break of 0.8737 will still pave the way to 61.8% retracement of 0.9267 to 0.8221 at 0.8867. For now, further rise will remain in favor as long as 55 W EMA (now at 0.8474) holds.
EUR/AUD Daily Outlook
Daily Pivots: (S1) 1.7882; (P) 1.7929; (R1) 1.7977; More...
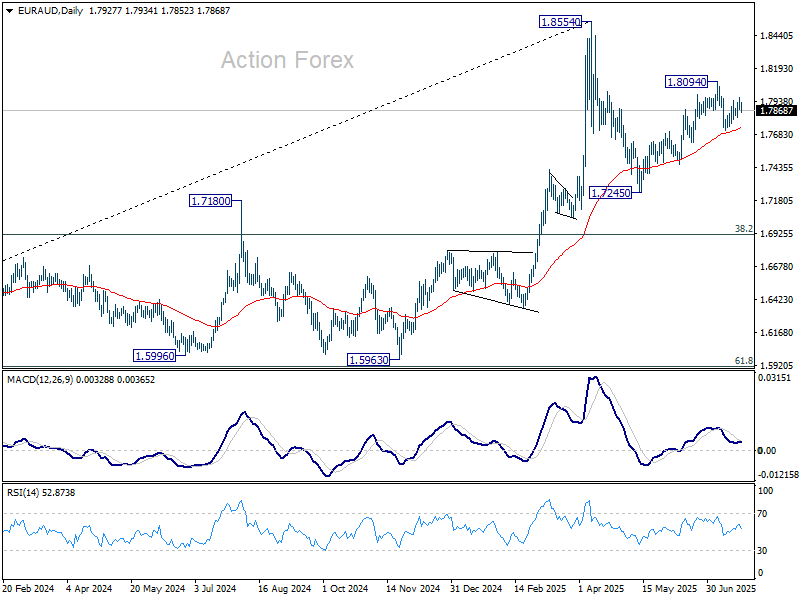
Intraday bias in EUR/AUD remains neutral at this point. On the upside, break of 1.8094 will resume the choppy rise from 1.7245 towards 1.8554 high. However, break of 1.7717 support will revive the case that rise from 1.7245 has completed, and turn bias back to the downside for 1.7459 support instead.
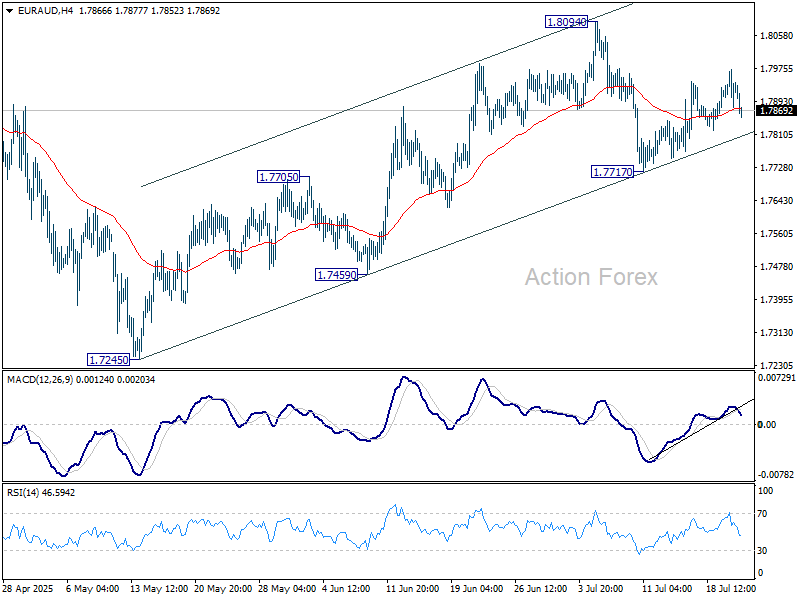
In the bigger picture, price actions from 1.8554 medium term top are seen as a corrective pattern. While deeper pullback might be seen, downside should be contained by 38.2% retracement of 1.4281 (2022 low) to 1.8554 at 1.6922 to bring rebound. Up trend from 1.4281 is expected to resume at a later stage.
EUR/CHF Daily Outlook
Daily Pivots: (S1) 0.9300; (P) 0.9319; (R1) 0.9331; More....
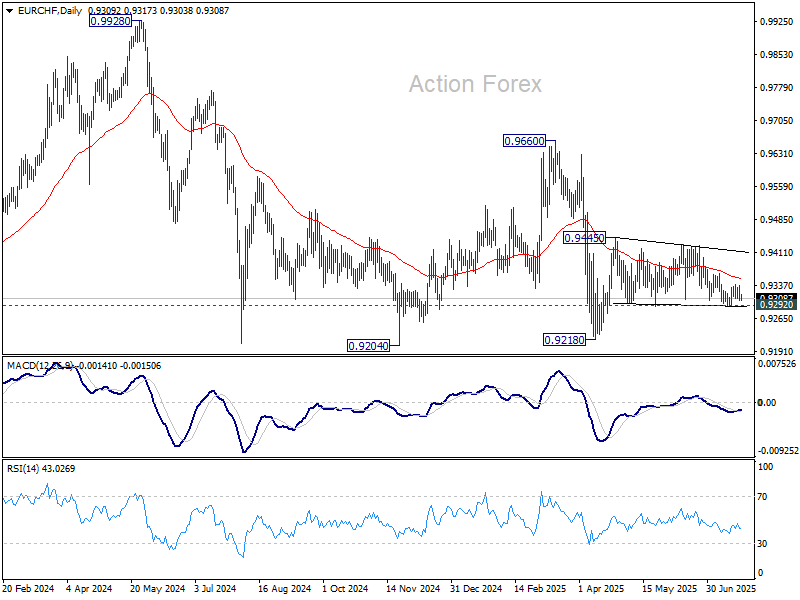
EUR/CHF is still bounded in sideway trading and intraday bias remains neutral. On the upside, firm break of 0.9365 resistance will be the first sign that corrective pattern from 0.9445 has already completed. Further rise should then be seen to 0.9428/45 resistance zone. Firm break there will resume the rebound from 0.9218 low. However, firm break of 0.9292 will bring retest of 0.9218 instead.
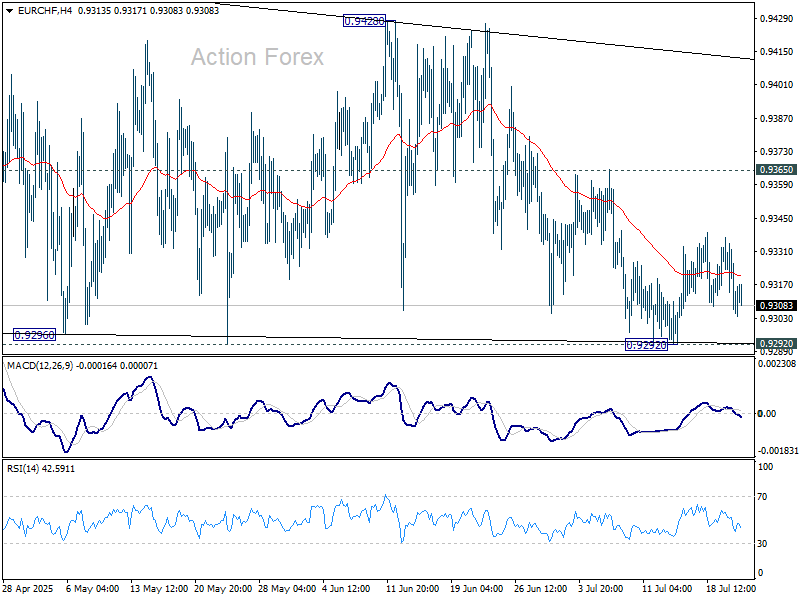
In the bigger picture, while downside momentum has been diminishing as seen in W MACD, there is no sign of bottoming yet. EUR/CHF is still staying below 55 W EMA (now at 0.9424) and well inside long term falling channel. Outlook will stay bearish as long as 0.9660 resistance holds. Break of 0.9204 (2024 low) will confirm resumption of down trend from 1.2004 (2018 high).
Trump Announced a Trade Deal With Japan With 15% Tariff
Markets
In a session devoid of key data markets yesterday kept a cautious bias awaiting news from trade talks between the US and its major trading partners ahead of the August 1 deadline. Recent indications suggested that the ‘final’ tariff level from those negotiations might be higher than the 10% rate that some (e.g. the EU) hoped for. The US trade deal with the Philippines (19%) announced confirmed this pattern. At the same time, US Treasury Secretary Bessent showed optimism on negotiations with China as he announced a new round of talks next week in Stockholm. He suggested that an extension of current truce was likely. Interest rate markets didn’t show a clear pattern. In the end both US (2-3 bps) and German yields (1-2.5 bps) again ceded modest ground. US equities finished little changed. The Eurostoxx50 underperformed probably as investors pondered the potential impact of a less favourable trade deal. The dollar on Monday changed course after a guarded comeback earlier this month and this continued yesterday. DXY dropped from 97.86 to close near 97.40. EUR/USD regained the 1.17 barrier (close 1.1754). Even the yen gained against the US currency (USD/JPY close 146.63) even as political and budgetary uncertainty remains elevated as the Japanese government lost its majority in this weekend’s Upper House election.
This morning, president Trump announced a trade deal with Japan with a 15% tariff on US imports from country, including the key automobile sector. The deal also includes a $550 bln fund for (Japanese) investments in the US. The agreement also stipulates Japan buying US products including Boeing aircrafts, rice and agricultural products, amongst others. In a first reaction, the Nikkei index jumps 3.75 %, probably as an important factor of uncertainty has been removed. US equity futures show modest gains. The dollar gains marginally on this broader risk-on (DXY 97.55; EUR/USD 1.173). The yen underperforms (USD/JPY 147.15). However, aside from the trade deal other factors are still in play for Japanese markets. Political (and budgetary) uncertainty remains elevated. Press reports this morning suggest that PM Ishiba will soon announce to resign. In this respect, a poor 40-y Japanese bond auction this morning lifts Japanese yields across the curve (10-y +8.0 bps to 1.6%; 40-y + 9.0 bps to 3.465%). Later today, the eco calendar is extremely thin. Markets will tried to find out whether the deal with Japan provides a template for the outcome of the US-EU trade negotiations (15%? 20%?). Despite the risk-on this morning, we also still keep a close eye at the long end of the yields curves outside Japan, with US 20y bond tap ($13 bln) later today.
News & Views
The Hungarian central bank maintained the policy rate at 6.5% yesterday. “A careful and patient approach to monetary policy remains necessary due to risks to the inflation environment as well as trade policy and geopolitical tensions”, it said. The tight monetary conditions are necessary to bring inflation back to target while preserving the current relative constructive attitude vs the Hungarian forint. Inflation rose to 4.6% in June and a core measure came in at 4.4%. Both are well above the 3% +1 ppt upper bound of the MNB in spite of government efforts. The MNB noted strong corporate repricings in areas outside those affected by the Orban administration’s profit-margin caps. Inflation is expected to remain above the tolerance range throughout the year while only reaching the 3% mid-point in early 2027 amid buoyant consumption, volatile commodity prices and strong wage dynamics. Economic growth should accelerate next year, starting from a gradual recovery in the second half of this year as strong consumption dynamics get complemented with a faster expansion of exports.
The IMF in its annual External Sector Report said that global current account balances have widened sharply in 2024, reversing a trend of narrowing that was under way since 2008-2009. This widening was due largely to increased excess balances in the three biggest economies: the US deficit widened by $228bn (to $1.13tn) while Chinese and Euro area surpluses expanded $161bn (to $424bn) and $198bn (to $461bn) respectively. IMF chief economist Gourinchas said such large surpluses or deficits stemmed from domestic distortions (eg. overly loose fiscal policy or insufficient safety nets that prompt precautionary savings). Addressing these imbalances required policy changes at home, not tariffs, he added. China should focus on boosting consumption, Europe should spend more on infrastructure and the US needed to reduce large public deficits.
EUR/USD Daily Outlook
Daily Pivots: (S1) 1.1702; (P) 1.1731; (R1) 1.1784; More...
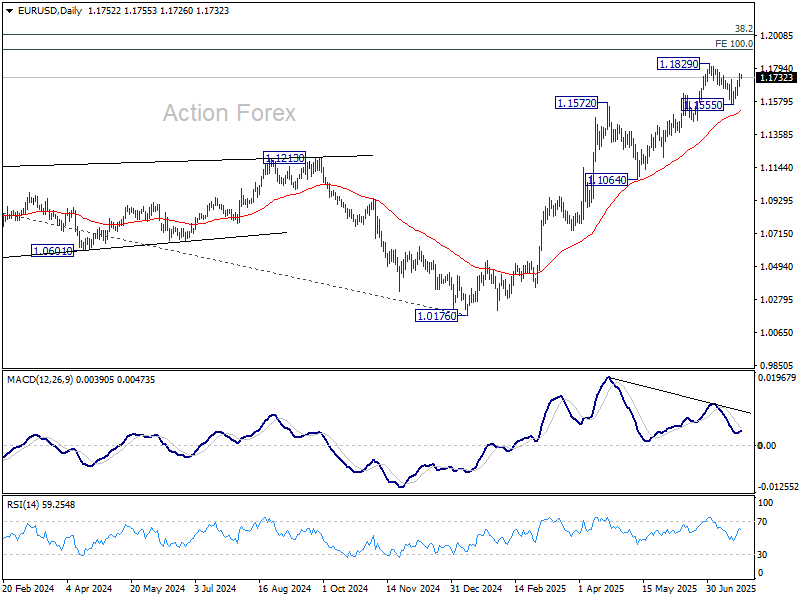
EUR/USD's break of 1.1720 minor resistance suggests that correction fro 1.1829 has completed at 1.1555, well ahead of 55 D EMA. Intraday bias is back on the upside for retesting 1.1829 first. Firm break there will resume whole rally from 1.0176. For now, risk will stay on the upside as long as 1.1555 support holds, in case of retreat.
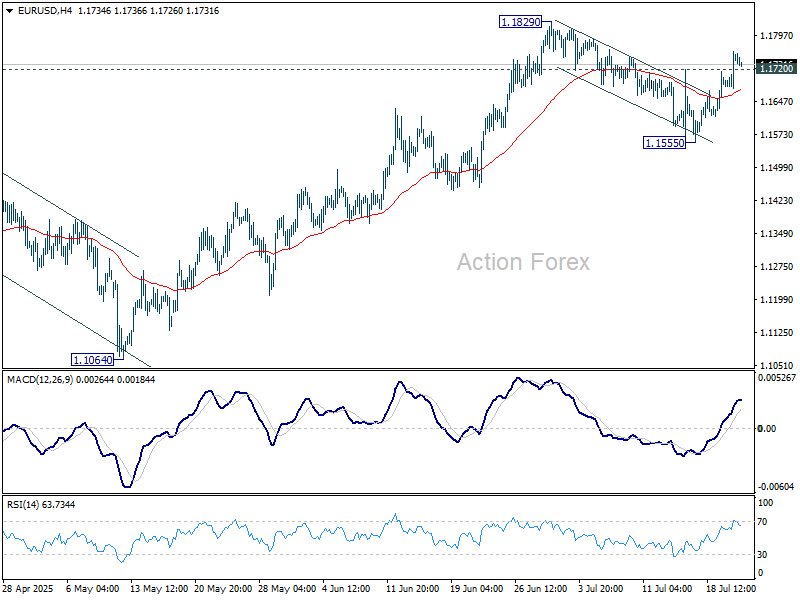
In the bigger picture, rise from 0.9534 long term bottom could be correcting the multi-decade downtrend or the start of a long term up trend. In either case, further rise should be seen to 100% projection of 0.9534 to 1.1274 from 1.0176 at 1.1916. This will remain the favored case as long as 1.1604 support holds.
USD/JPY Daily Outlook
Daily Pivots: (S1) 145.99; (P) 146.96; (R1) 147.62; More...
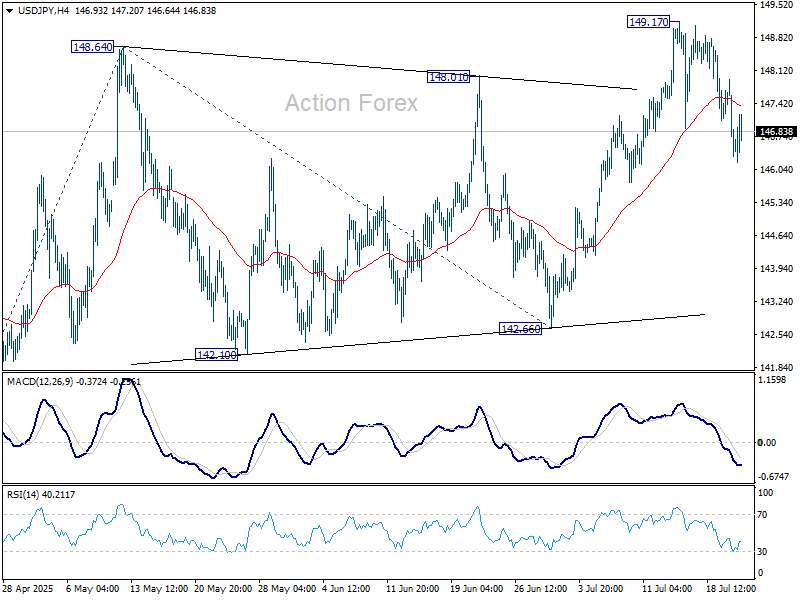
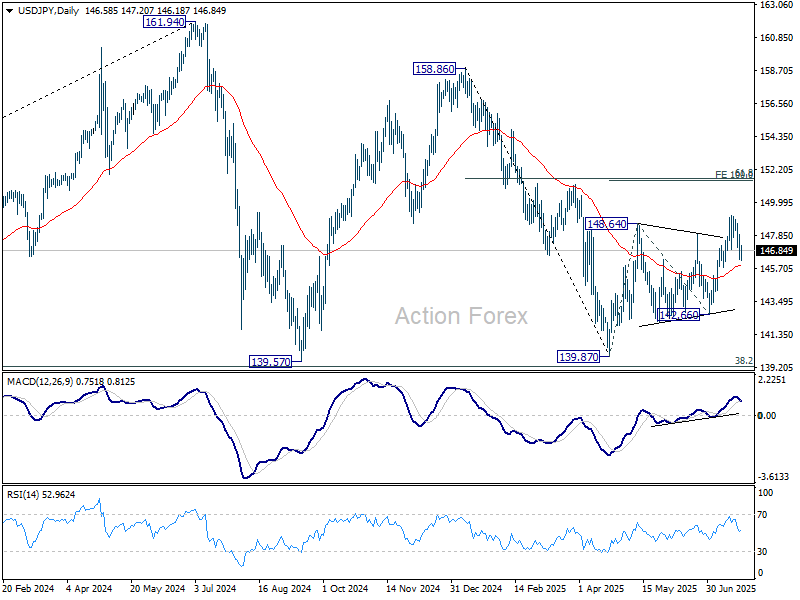
Intraday bias in USD/JPY stays neutral for the moment. Further rally is expected as long as 55 D EMA (now at 145.91) holds. On the upside, break of 149.17 will target 100% projection of 139.87 to 148.64 from 142.66 at 151.43. That is close to 61.8% retracement of 158.86 to 139.87 at 151.22. However, sustained trading below 55 D EMA will argue that the whole rebound from 139.87 might have completed and target 142.66 support for confirmation.
In the bigger picture, price actions from 161.94 (2024 high) are seen as a corrective pattern to rise from 102.58 (2021 low). There is no clear sign that the pattern has completed yet. But still, strong support is expected from 38.2% retracement of 102.58 to 161.94 at 139.26 to bring rebound. in case of another fall.
GBP/USD Daily Outlook
Daily Pivots: (S1) 1.3486; (P) 1.3510; (R1) 1.3558; More...
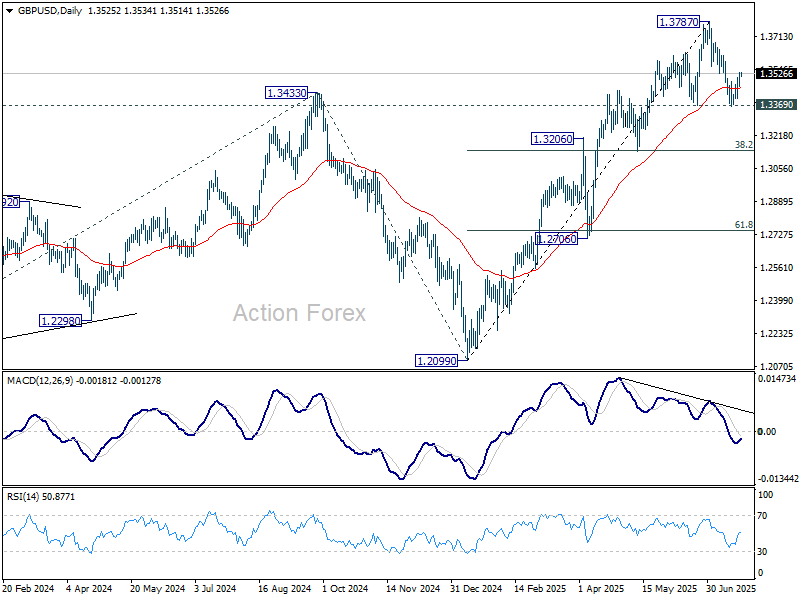
Intraday bias in GBP/USD remains neutral at this point. On the upside, firm break of 1.3561 support turned resistance will argue that correction from 1.3787 has already completed after hitting 1.3369 support. Intraday bias will be back on the upside for retesting 1.3787. Nevertheless, firm break of 1.3363/9 will bring deeper correction to 1.3138 cluster support (38.2% retracement of 1.2099 to 1.3787 at 1.3142).
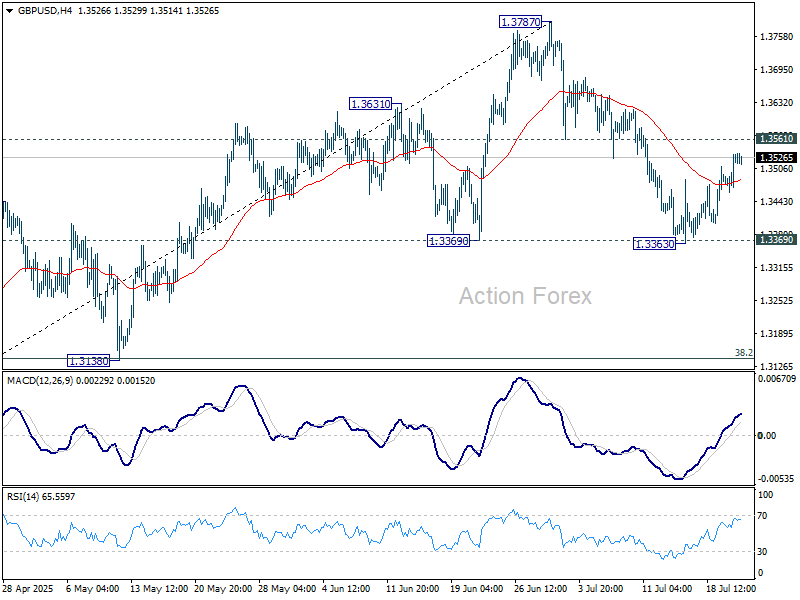
In the bigger picture, up trend from 1.3051 (2022 low) is in progress. Next medium term target is 61.8% projection of 1.0351 to 1.3433 from 1.2099 at 1.4004. Outlook will now stay bullish as long as 55 W EMA (now at 1.3017) holds, even in case of deep pullback.
USD/CHF Daily Outlook
Daily Pivots: (S1) 0.7897; (P) 0.7945; (R1) 0.7969; More….
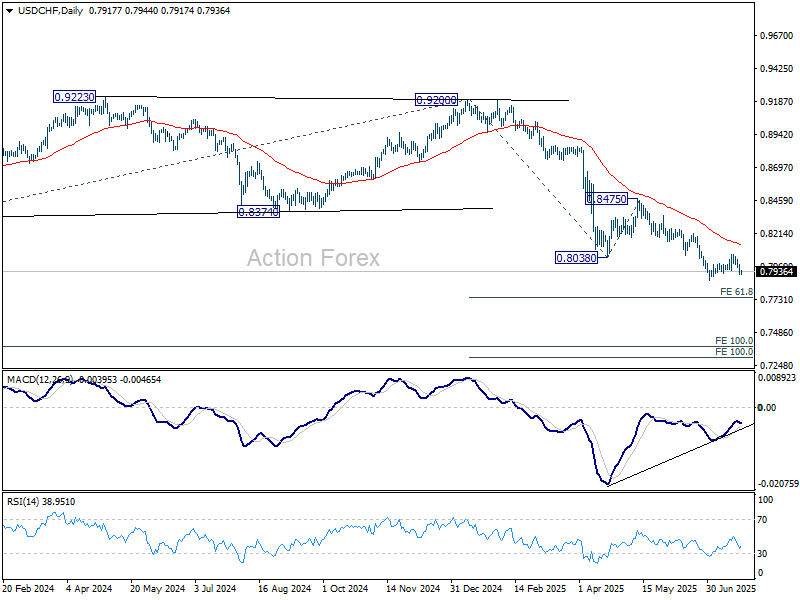
USD/CHF's break of 0.7946 minor support suggests that corrective recovery from 0.7871 has already completed at 0.8064, after rejection by 0.8054 support turned resistance. Intraday bias is back on the downside for retesting 0.7871 first. Firm break there will resume larger down trend. For now, risk will stay on the downside as long as 0.8063 resistance holds, in case of recovery.
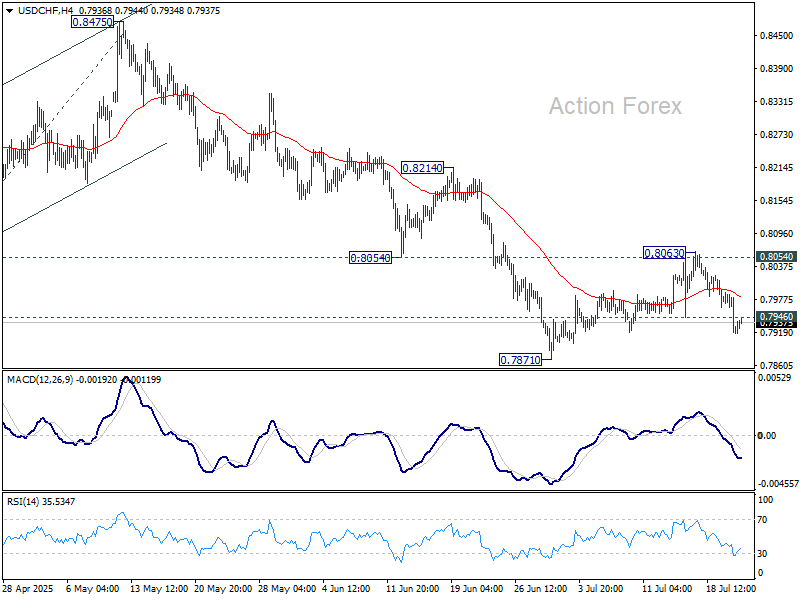
In the bigger picture, long term down trend from 1.0342 (2017 high) is still in progress. Next target is 100% projection of 1.0146 (2022 high) to 0.8332 from 0.9200 at 0.7382. In any case, outlook will stay bearish as long as 0.8475 resistance holds.