
Sample Category Title
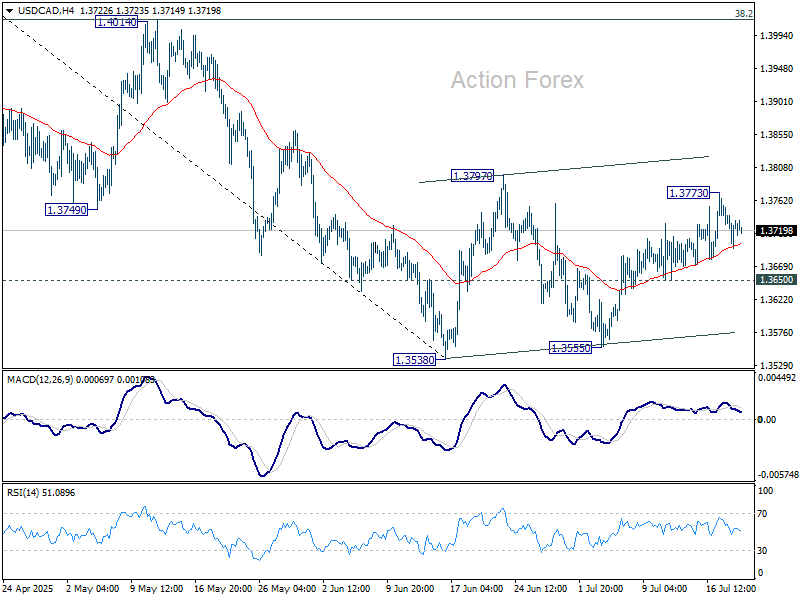
USD/CAD Daily Outlook
Daily Pivots: (S1) 1.3693; (P) 1.3726; (R1) 1.3755; More...
Intraday bias in USD/CAD stays neutral for the moment. Corrective pattern from 1.3538 could extend further. On the upside, above 1.3773 will target 1.3797 and possibly above. On the downside, break of 1.3650 support will bring retest of 1.3538/55 support zone.
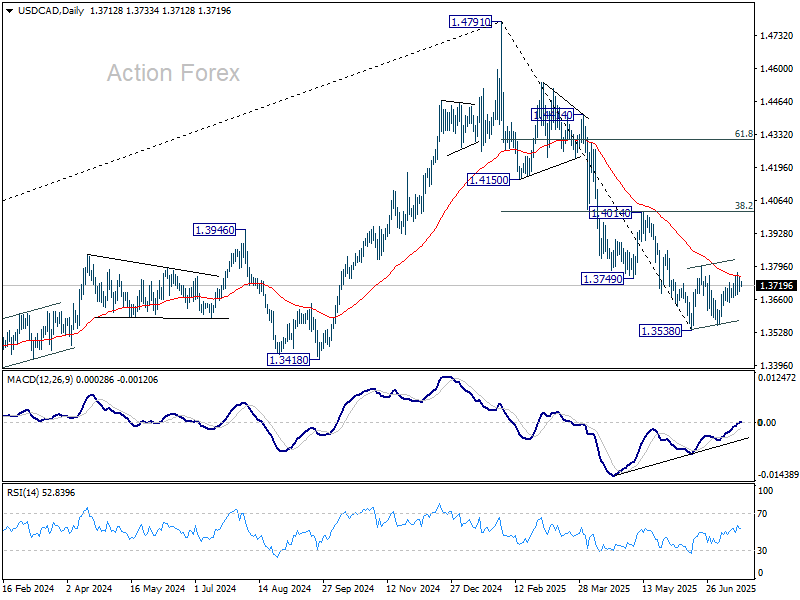
In the bigger picture, price actions from 1.4791 medium term top could either be a correction to rise from 1.2005 (2021 low), or trend reversal. In either case, further decline is expected as long as 1.4014 resistance holds. Next target is 61.8% retracement of 1.2005 (2021 low) to 1.4791 at 1.3069.
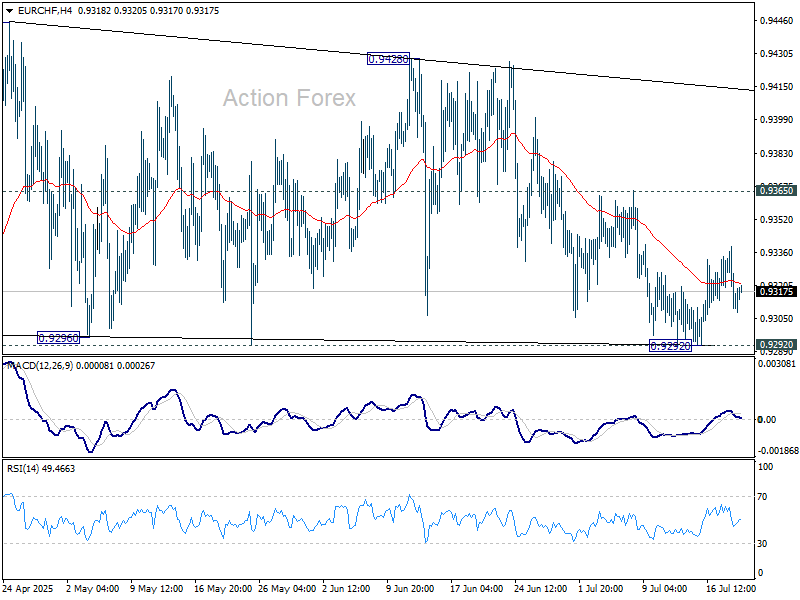
EUR/CHF Daily Outlook
Daily Pivots: (S1) 0.9307; (P) 0.9324; (R1) 0.9338; More....
Intraday bias in EUR/CHF remains neutral for the moment. On the upside, firm break of 0.9365 resistance will be the first sign that corrective pattern from 0.9445 has already completed. Further rise should then be seen to 0.9428/45 resistance zone. Firm break there will resume the rebound from 0.9218 low. However, firm break of 0.9292 will bring retest of 0.9218 instead.
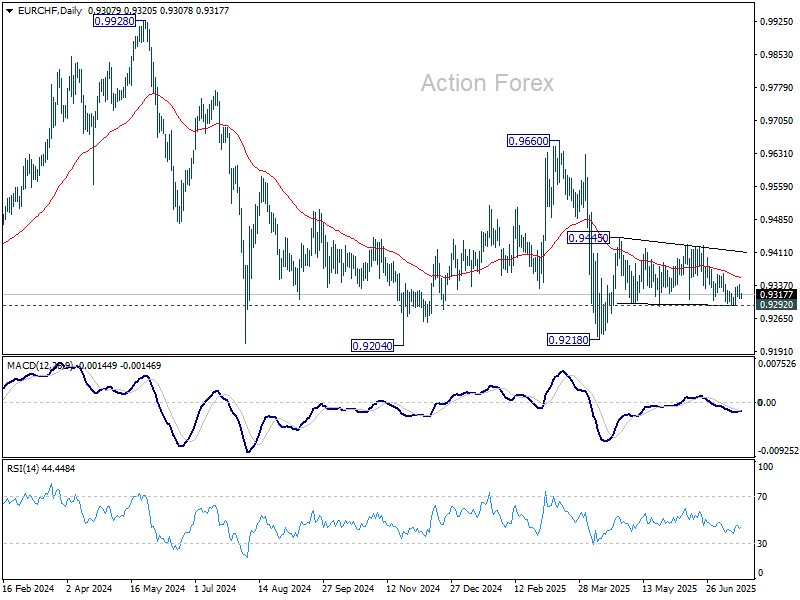
In the bigger picture, while downside momentum has been diminishing as seen in W MACD, there is no sign of bottoming yet. EUR/CHF is still staying below 55 W EMA (now at 0.9424) and well inside long term falling channel. Outlook will stay bearish as long as 0.9660 resistance holds. Break of 0.9204 (2024 low) will confirm resumption of down trend from 1.2004 (2018 high).
EUR/GBP Daily Outlook
Daily Pivots: (S1) 0.8649; (P) 0.8661; (R1) 0.8680; More...
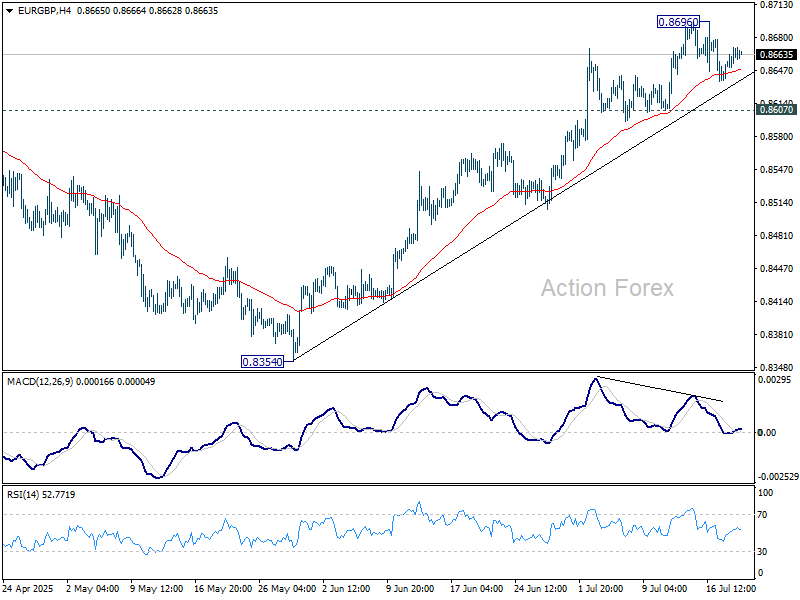
Intraday bias in EUR/GBP stays neutral and more consolidations could be seen below 0.8696. As long as 0.8607 support holds, further rally is expected. On the upside, above 0.8696 will bring retest of 0.8737 high. However, firm break of 0.8607 will confirm short term topping, on bearish divergence condition in 4H MACD. Deeper fall should be seen back to 55 D EMA (now at 0.8546).
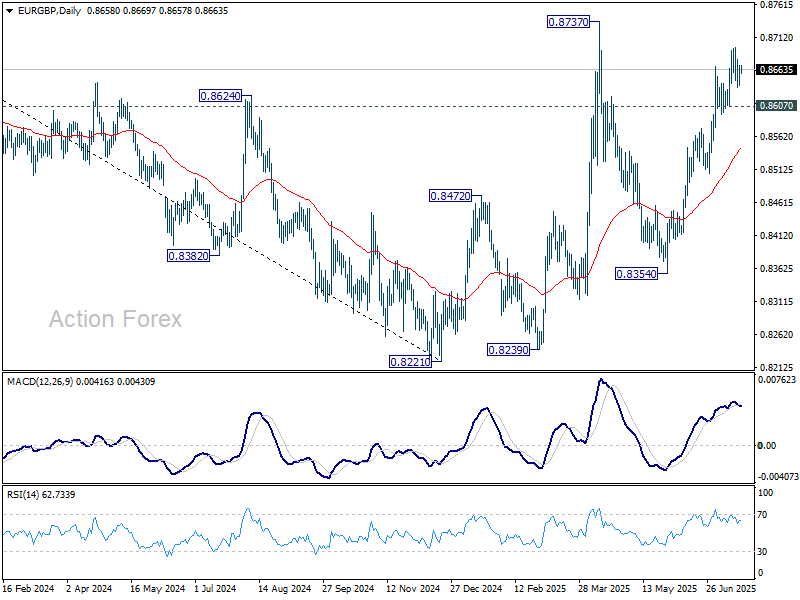
In the bigger picture, the structure from 0.8221 medium term bottom are not impulsive enough to suggest that it's reversing the down trend from 0.9267 (2022 high). But even if it's a correction, firm break of 0.8737 will still pave the way to 61.8% retracement of 0.9267 to 0.8221 at 0.8867. For now, further rise will remain in favor as long as 55 W EMA (now at 0.8474) holds.
EUR/AUD Daily Outlook
Daily Pivots: (S1) 1.7836; (P) 1.7862; (R1) 1.7892; More...
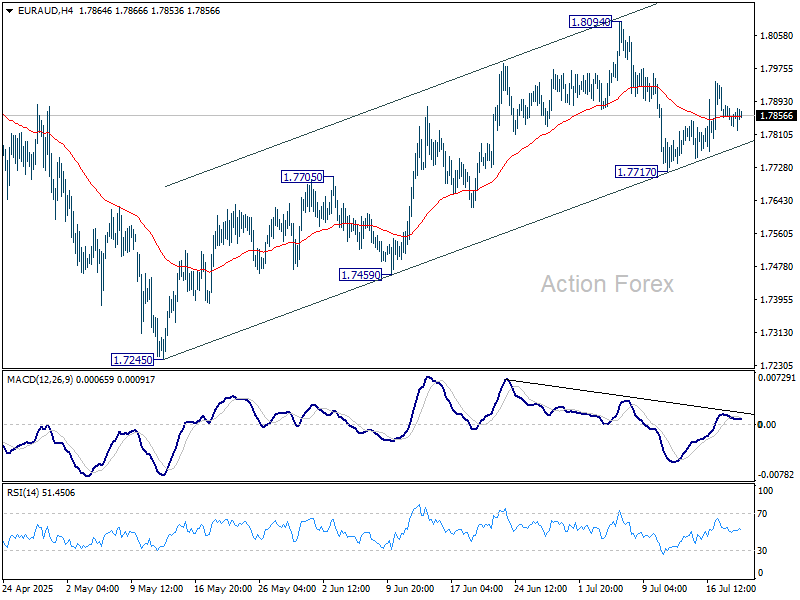
Intraday bias in EUR/AUD remains neutral for the moment. On the upside, break of 1.8094 will resume the choppy rise from 1.7245 towards 1.8554 high. However, break of 1.7717 support will revive the case that rise from 1.7245 has completed, and turn bias back to the downside for 1.7459 support instead.
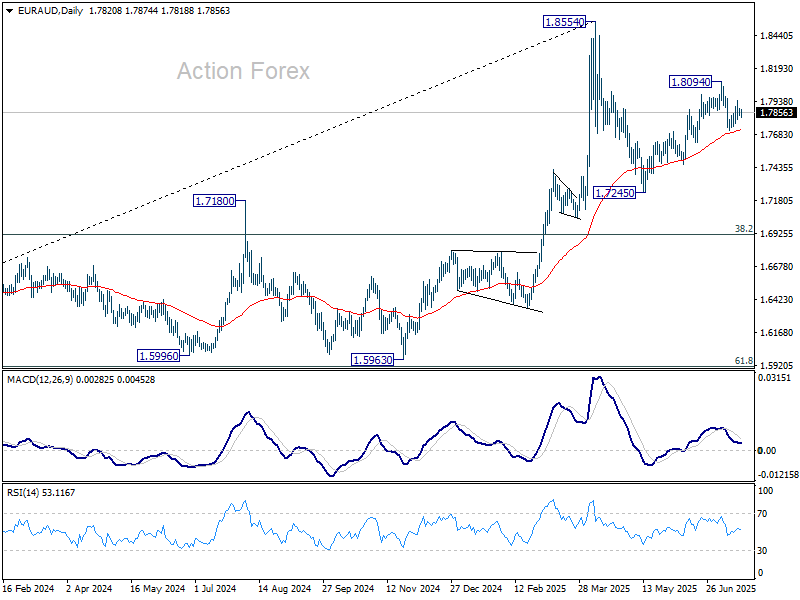
In the bigger picture, price actions from 1.8554 medium term top are seen as a corrective pattern. While deeper pullback might be seen, downside should be contained by 38.2% retracement of 1.4281 (2022 low) to 1.8554 at 1.6922 to bring rebound. Up trend from 1.4281 is expected to resume at a later stage.
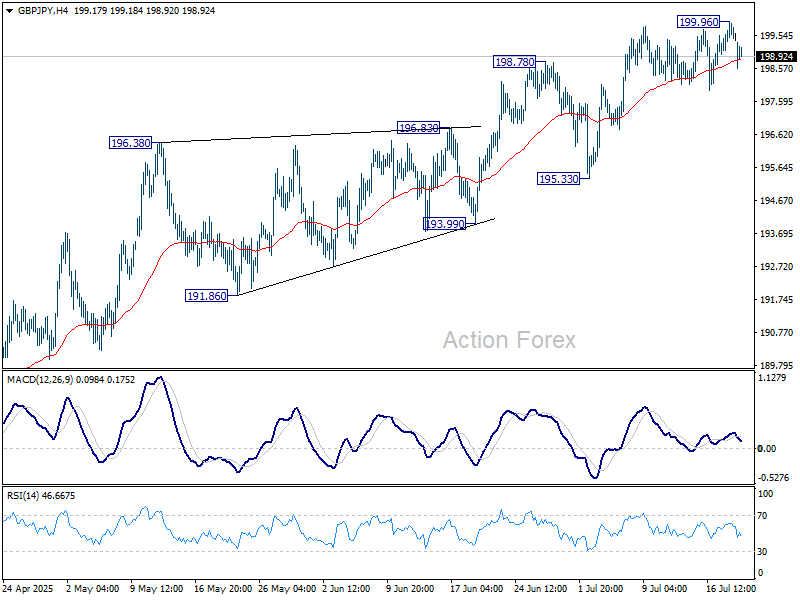
GBP/JPY Daily Outlook
Daily Pivots: (S1) 199.11; (P) 199.54; (R1) 200.00; More...
Intraday bias in GBP/JPY is turned neutral again with current retreat. Some consolidations would be seen first. Further rally will remain in favor as long as 195.33 support holds. Above 199.96 will resume the rise from 184.35 to 100% projection of 180.00 to 199.79 from 184.35 at 204.14.
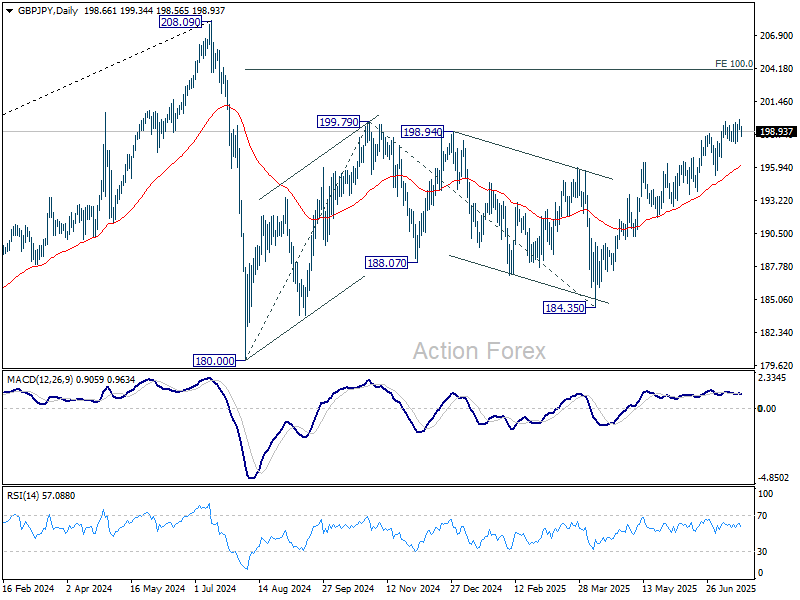
In the bigger picture, price actions from 208.09 (2024 high) are seen as a correction to rally from 123.94 (2020 low). The pattern might still extend with another falling leg. But in that case, strong support should be seen from 38.2% retracement of 123.94 to 208.09 at 175.94 to contain downside. Meanwhile, decisive break of 208.09 will confirm long term up trend resumption.
EUR/USD Extends Losses, Can Bulls Step In?
Key Highlights
- EUR/USD started a downward move from the 1.1820 resistance zone.
- A key bearish trend line is forming with resistance at 1.1660 on the 4-hour chart.
- GBP/USD is showing bearish signs below the 1.3500 level.
- USD/JPY could aim for more gains above the 149.20 resistance.
EUR/USD Technical Analysis
The Euro failed to clear the 1.1820 resistance and declined against the US Dollar. EUR/USD traded below the 1.1780 and 1.1720 support levels.
Looking at the 4-hour chart, the pair settled below the 1.1720 zone and the 100 simple moving average (red, 4-hour). However, it managed to stay above the 200 simple moving average (green, 4-hour).
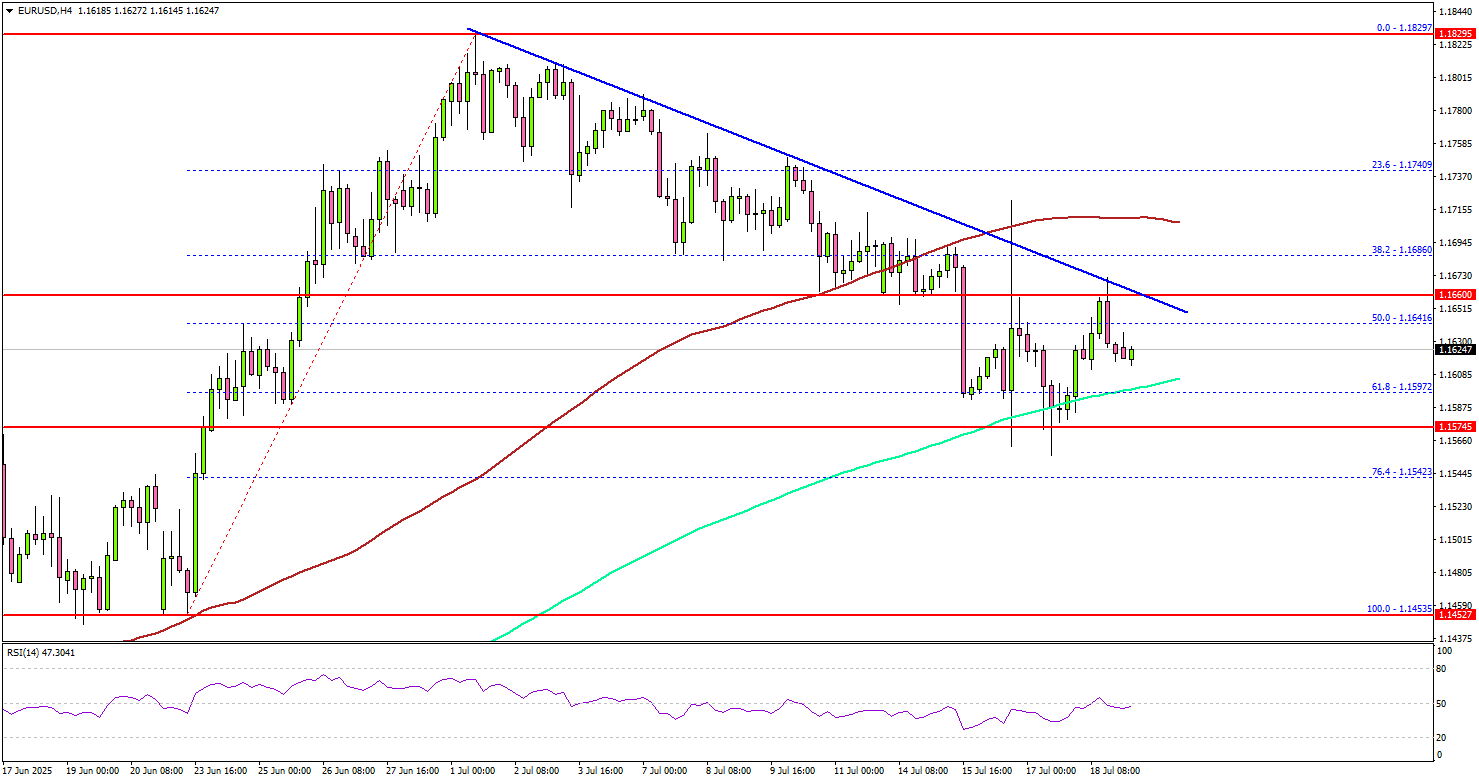
On the downside, immediate support is near the 1.1600 level and the 200 simple moving average (green, 4-hour). The next key support sits near 1.1575. Any more losses could send the pair toward the 1.1520 support zone.
On the upside, the pair could face resistance near the 1.1660 level. There is also a key bearish trend line forming with resistance at 1.1660 on the same chart. The next key resistance sits near the 1.1720 level. A close above the 1.1720 level could set the pace for another increase.
In the stated case, the pair could rise toward the 1.1780 resistance. The next major stop for the bulls could be near the 1.1820 resistance.
Looking at GBP/USD, the pair is struggling to start a fresh increase and might decline further below the 1.3400 level.
Upcoming Economic Events:
- Bank of Canada Business Outlook Survey.
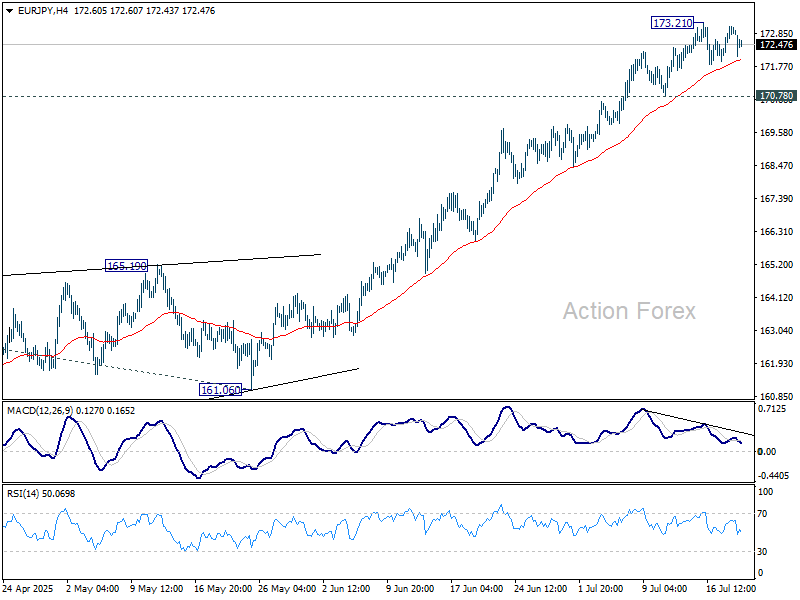
EUR/JPY Daily Outlook
Daily Pivots: (S1) 172.26; (P) 172.69; (R1) 173.39; More...
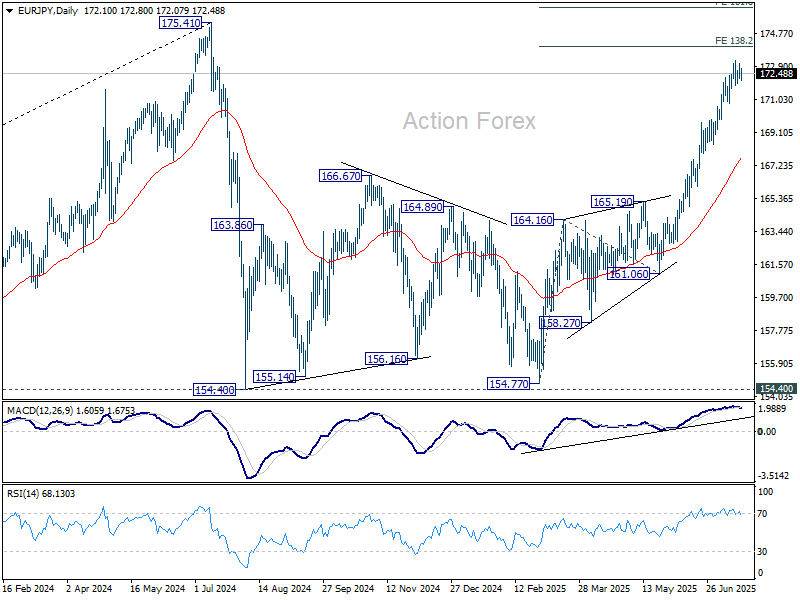
EUR/JPY dips mildly today as consolidations from 173.21 extends. Intraday bias stays neutral for the moment. Further rise is expected as long as 170.78 support holds. On the upside, break of 173.21 will target 138.2% projection of 154.77 to 164.16 from 161.06 at 174.03. Break there will bring retest of 175.41 high. Nevertheless, considering bearish divergence condition in 4H MACD, break of 170.78 will indicate short term topping, and turn bias to the downside for deeper pullback.
In the bigger picture, price actions from 175.41 (2024 high) are seen as correction to up trend from 114.42 (2020 low). The pattern might still extend with another falling leg. But in that case, strong support should be seen from 38.2% retracement of 114.42 to 175.41 at 152.11 to contain downside. Meanwhile, decisive break of 175.41 will confirm long term up trend resumption.
Yen Stabilizes Post-Election, But BoJ Hike Could Be Further Away
Yen showed modest gains to start the week, but the broader forex markets stayed quiet with all major pairs and crosses confined to Friday’s ranges. Traders were largely unfazed by Japan’s upper house election, which delivered no shocks. The muted reaction suggests markets had priced in the LDP’s setback and are now shifting focus to what comes next politically and economically.
The LDP’s failure to retain a majority marks the first time since 1955 that the ruling coalition has lost control of the chamber. That further weakened Prime Minister Shigeru Ishiba’s political footing following October’s lower house loss. Despite the setback, Ishiba has expressed his intention to stay in office and govern by seeking limited cooperation from opposition parties. One likely consequence is a move toward looser fiscal policy, as Ishiba courts centrist or left-leaning support. That path would likely pressure to Yen.
Also, historically, periods of political instability in Japan have discouraged the BoJ from taking aggressive policy steps. That tradition is likely to continue, pushing the timeline for any rate hikes further into the future.
On the trade front, US Commerce Secretary Howard Lutnick reiterated Sunday that new tariffs will go into effect on the hard deadline August 1. He added that countries could still engage diplomatically in negotiation, but only after paying the tariffs.
Meanwhile, Lutnick also said that some smaller countries in Latin America, Caribbean, and Africa will have a low baseline tariffs of 10%. However, “the bigger economies will either open themselves up or they’ll pay a fair tariff to America," he added.
Overall in the currency markets, Yen is currently the strongest for the day, followed by Sterling, and then Euro. Kiwi is the worst after CPI miss, followed by Loonie and Aussie. Dollar and Swiss Franc are in the middle.
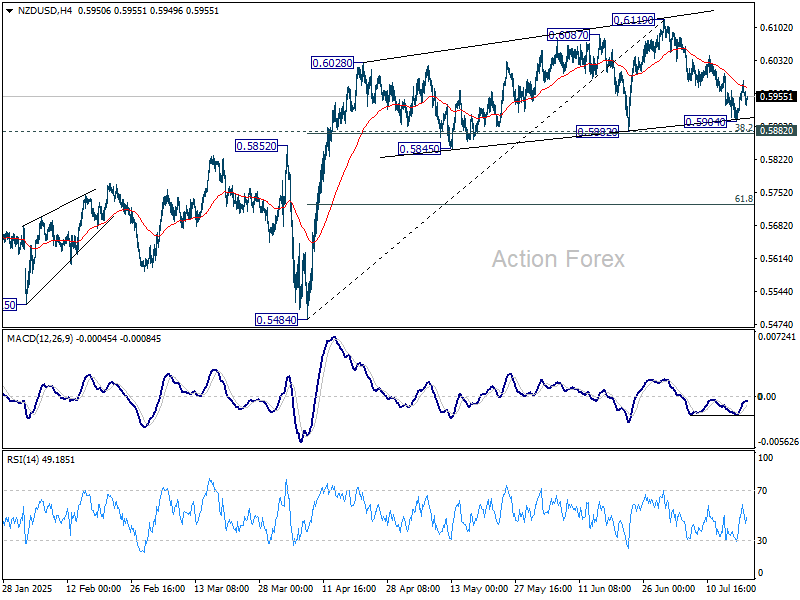
Technically, NSD/USD's corrective pullback from 0.6119 is losing momentum as seen in 4H MACD. While another fall cannot be ruled out, downside should be contained by 0.5882 cluster support (38.2% retracement of 0.5484 to 0.7119 at 0.5876) and bring rebound. Meanwhile, sustained trading above 55 4H EMA (now at 0.5975) will suggest that the correction has completed, and bring stronger rise back to retest 0.6119 high.
In Asia, at the time of writing, Japan is on holiday. Hong Kong HSI is up 0.23%. China Shanghai SSE is up 0.46%. Singapore Strait Times is up 0.40%.
NZ CPI rises to 2.7% yoy in Q2, tradeabales jump
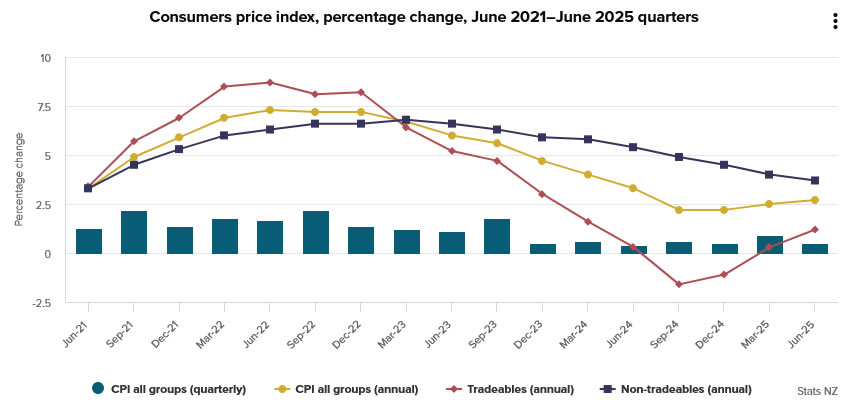
New Zealand’s CPI rose 0.5% qoq in Q2, slightly below expectations for 0.6% qoq. Annual inflation ticked up to 2.7% yoy from 2.5% yoy but still undershot 2.8% yoy forecast. Headline inflation remained comfortably within the RBNZ’s target range of 1-3%. Tradeables inflation climbed sharply to 1.2% yoy from 0.3% yoy. Non-tradeables eased to 3.7% yoy from 4.0% yoy, indicating moderating domestic pressures.
The quarterly print showed notable increases in cultural services (+9.5% qoq), electricity (+4.9% qoq), and vegetables (+10.0% qoq), which together accounted for over 70% of the total quarterly CPI rise. However, these gains were partially offset by a -4.8% qoq drop in petrol prices and -9.2% qoq decline in domestic accommodation services.
ECB to hold fire, RBA minutes and global PMIs anchor light data week
This week’s spotlight is on the ECB, with little else on the calendar likely to drive significant volatility. The central bank is widely expected to leave the deposit rate unchanged at 2.00%, pausing after a steady sequence of cuts since June 2024. The July meeting is not expected to bring major shifts in tone, but attention will turn to September, where updated projections could set the stage for the final rate move of this cycle.
According to a recent Reuters poll, 58% of economists—49 out of 84 surveyed—expect the ECB to deliver one final 25bp cut in September to complete its easing. Twenty respondents believe the current level is already the floor, while only 15 foresee two or more additional reductions. That slim majority suggests consensus is forming around one more move, but much hinges on developments in global trade and inflation dynamics.
With US tariff policy still evolving and the EU weighing possible retaliation, ECB President Christine Lagarde is unlikely to provide definitive forward guidance this week. September’s decision will depend heavily on how the tariff situation unfolds and what it implies for inflation, growth, and confidence. Those factors will be incorporated into the ECB’s updated macroeconomic projections, which should give more clarity about the path forward.
Meanwhile, the RBA’s July meeting minutes are also due and could offer some clarification on the central bank’s surprise decision to hold rates at 3.85%. With the vote split 6-3, the minutes might reveal whether the pause was tactical—a brief wait for more data before an August cut—or part of a deeper internal disagreement. Still, the broader tone is expected to remain cautiously dovish.
The rest of the week features July PMIs from the US, Eurozone, UK, and Japan—key data to assess how global economies are absorbing the impact of tariffs. Retail sales from Canada and the UK will offer insights into consumer resilience, while Germany’s Ifo business climate and Japan’s Tokyo CPI provide a check on sentiment and inflation.
Here are some highlights for the week:
- Monday: New Zealand CPI; China rate decision; Canada IPPI and RMPI, BoC business outlook survey.
- Tuesday: New Zealand trade balance; RBA minutes; UK public sector net borrowing.
- Wednesday: Canada new housing price index; US existing home sales.
- Thursday: Australia PMIs; Japan PMIs; Germany Gfk consumer climate; Eurozone PMIs, ECB rate decision; UK PMIs; Canada retail sales; US jonless claims, PMIs, new home sales.
- Friday: UK Gfk consumer sentiment; Japan Tokyo CPI; UK retail sales; Germany Ifo business climate; US durable goods orders.
EUR/JPY Daily Outlook
Daily Pivots: (S1) 172.26; (P) 172.69; (R1) 173.39; More...
EUR/JPY dips mildly today as consolidations from 173.21 extends. Intraday bias stays neutral for the moment. Further rise is expected as long as 170.78 support holds. On the upside, break of 173.21 will target 138.2% projection of 154.77 to 164.16 from 161.06 at 174.03. Break there will bring retest of 175.41 high. Nevertheless, considering bearish divergence condition in 4H MACD, break of 170.78 will indicate short term topping, and turn bias to the downside for deeper pullback.
In the bigger picture, price actions from 175.41 (2024 high) are seen as correction to up trend from 114.42 (2020 low). The pattern might still extend with another falling leg. But in that case, strong support should be seen from 38.2% retracement of 114.42 to 175.41 at 152.11 to contain downside. Meanwhile, decisive break of 175.41 will confirm long term up trend resumption.
NZ CPI rises to 2.7% yoy in Q2, tradeabales jump
New Zealand’s CPI rose 0.5% qoq in Q2, slightly below expectations for 0.6% qoq. Annual inflation ticked up to 2.7% yoy from 2.5% yoy but still undershot 2.8% yoy forecast. Headline inflation remained comfortably within the RBNZ’s target range of 1-3%. Tradeables inflation climbed sharply to 1.2% yoy from 0.3% yoy. Non-tradeables eased to 3.7% yoy from 4.0% yoy, indicating moderating domestic pressures.
The quarterly print showed notable increases in cultural services (+9.5% qoq), electricity (+4.9% qoq), and vegetables (+10.0% qoq), which together accounted for over 70% of the total quarterly CPI rise. However, these gains were partially offset by a -4.8% qoq drop in petrol prices and -9.2% qoq decline in domestic accommodation services.
First Impressions: NZ Consumers Price Index, June Quarter 2025
Inflation was slightly softer than expected in the June quarter. Prices rose by 0.5% over the past three months. Annual inflation rose to 2.7%, up from 2.5% previously.
Consumers Price Index, June quarter 2025 – key stats
Headline inflation
- Quarterly change: +0.5% (prev: +0.9%)
- Westpac forecast: +0.6%, RBNZ (May MPS): +0.5%
- Market median: +0.6%, range +0.5% to +0.8%
Annual change: +2.7% (prev: +2.5%)
- Westpac forecast: +2.8%, RBNZ (May MPS): +2.6%, Market: +2.8%
Non-tradables
- Quarterly change: +0.7% (prev: +1.1%)
- Westpac forecast: +0.7%, RBNZ (May MPS): +0.7%
- Annual change: +3.7% (prev: +4.0%)
Tradables
- Quarterly change: +0.3% (prev: +0.8%)
- Westpac forecast: +0.4%, RBNZ (May MPS): +0.1%
- Annual change: +1.2% (prev: +0.3%)
Consumer prices rose 0.5% in the June quarter. That saw the annual inflation rate rising slightly to 2.7%, up from 2.5% in the year to March.
The June quarter inflation result was a little below the 0.6% rise we expected.
While today’s result was in line with the RBNZ’s last published forecast from May, their July policy statement indicated that they were braced for a stronger result. We suspect today’s result was actually a little on the low side of what the RBNZ had anticipated.
Looking through the normal quarter-to-quarter volatility in prices, core inflation remains contained in the RBNZ’s target band. However, it isn’t dropping like it did last year and remains a little above 2%.
Today’s result won’t have done much to change the RBNZ’s mind relative to the cautious easing bias it signalled at its recent policy review. We continue to expect another 25bp cut in August. Going forward, we’ll be watching core inflation measures closely to see how strong the underling trend in prices is.
What contributed to inflation in the June quarter?
Underpinning June’s rise in consumer prices were large increases in two specific areas:
- Food prices (19% of the CPI) were the largest upside contributors to quarterly inflation, with prices up 1.6% over the quarter. That was mainly due to a large seasonal increase in vegetable prices. There have also been large increases in the prices of dairy products and other grocery items.
- There has also been a large increase in household energy prices (3% of the CPI), with electricity prices up 4.7% over the quarter. That’s in part due to increases in lines and transmission charges.
On the downside, petrol prices (4% of the CPI) fell around 5% over the past few months.
There were a couple of other notable price movements:
We’re continuing to see softness in housing rents, which are the largest component of the CPI. The past three months saw rents rising by just 0.8%. In annual terms, rental inflation has slowed to 3.2%, the lowest it’s been since 2021. There’s been particular softness in Auckland and Wellington. Auckland’s rental market in particular is feeling the impacts of the downturn in net migration and the increases in the housing stock in recent years.
The cost of purchasing a newly built home was down -0.1% in June quarter, and is up just 0.8% over the past year. That’s the smallest annual increase since 2009 and reflects the protracted downturn in building activity over the past year and related competitive pressures in the construction sector.
There were also large movements in specific areas – audiovisual and computer prices fell 13%, while charges for streaming services were up nearly 10%. There was also a fall in the cost of pharmaceutical products reflecting the impact of subsidies.
Annual inflation has risen to 2.7%
Annual inflation rose to 2.7% in the June quarter, up from 2.5% in the year to March. Looking under the surface, we’re seeing some notable changes in some key areas.
Looking first at tradables (which relates mainly to the prices of imported goods), prices were up 0.3% in the March quarter, leaving them up 1.2% over the past year. That was a slightly smaller rise than we or the RBNZ expected.
While we have seen large increases for prices of some items like food tradables prices more generally have remained subdued. That’s consistent with sluggish household spending that has been weighing on the prices for items like furnishings and apparel.
Balanced against that pickup in imported costs, domestic prices (aka non-tradables) rose 0.7% in the June quarter (as expected). That saw annual non-tradables inflation slowing to 3.7%, down from 4.0% in the year to March and the lowest it’s been since 2021.
Underlying that easing in domestic inflation has been the softness in domestic activity which has seen muted growth in wages and service sector prices. We’ve also seen an easing in rents and subdued increases in the cost of new housing.
But even with that softness in domestic activity, overall non-tradables inflation has been easing only gradually over the past year due to continued increases in administered costs, like household energy.
Core inflation contained, but not dropping
While increases in the prices of volatile items like food have pushed inflation higher in recent months, the longer-term trend in inflation looks better contained. Most measures of core inflation (which smooth through volatile quarter-to-quarter movements in prices and instead track the underlying trend in inflation) remained well-contained within the RBNZ target band.
Notably, however, the decline in core inflation that we saw over the past year has come to a halt this quarter, with some measures actually nudging higher this quarter. And with most measures remaining a little above 2%, that will be worth watching over the coming months.
In terms of specifics:
- Trimmed mean inflation remained at 2.5%.
- Weighted median inflation fell to remained 2.2%.
- Inflation excluding food, fuel and energy costs nudged higher to 2.7% from 2.6% previously.