Sample Category Title
GBPUSD Finding Buyers in a Dollar Index Top
Yesterday's reaction to a mixed UK Employment data had been confusing for the most part before taking a look at the bigger picture.
Despite seeing an employment change of 134K vs 46K expected, the UK Unemployment rate came at 4.7% vs a 4.6% consensus, highest since 2021 with easing salarial pressures – Some banks (Citi, GS, BofA) are seeing what they need to push back some rate cuts from September to November.
The Pound had seen a major correction (10 consecutive selling candles) since its 1.3780 top and between some mess-ups from the UK Government requiring intervention from the PM Starmer and some extra mediation from Bank of England's Bailey during the week. However yesterday, GBPUSD marked an intermediate bottom, today we'll try to see if it has more potential for a longer-run bottom.
Most of the fundamentals sometimes cannot explain whatever really happens in the demand for a currency, particularly on the longer-run. Some higher trend shifts are happening (like right now) and participants are simply looking at other things than data.
This is one of the reason that sometimes, Technicals front Fundamentals. This is one of the many reasons why we're going to take a look at these GBPUSD charts today!
GBPUSD Technical Analysis
GBPUSD Daily Chart
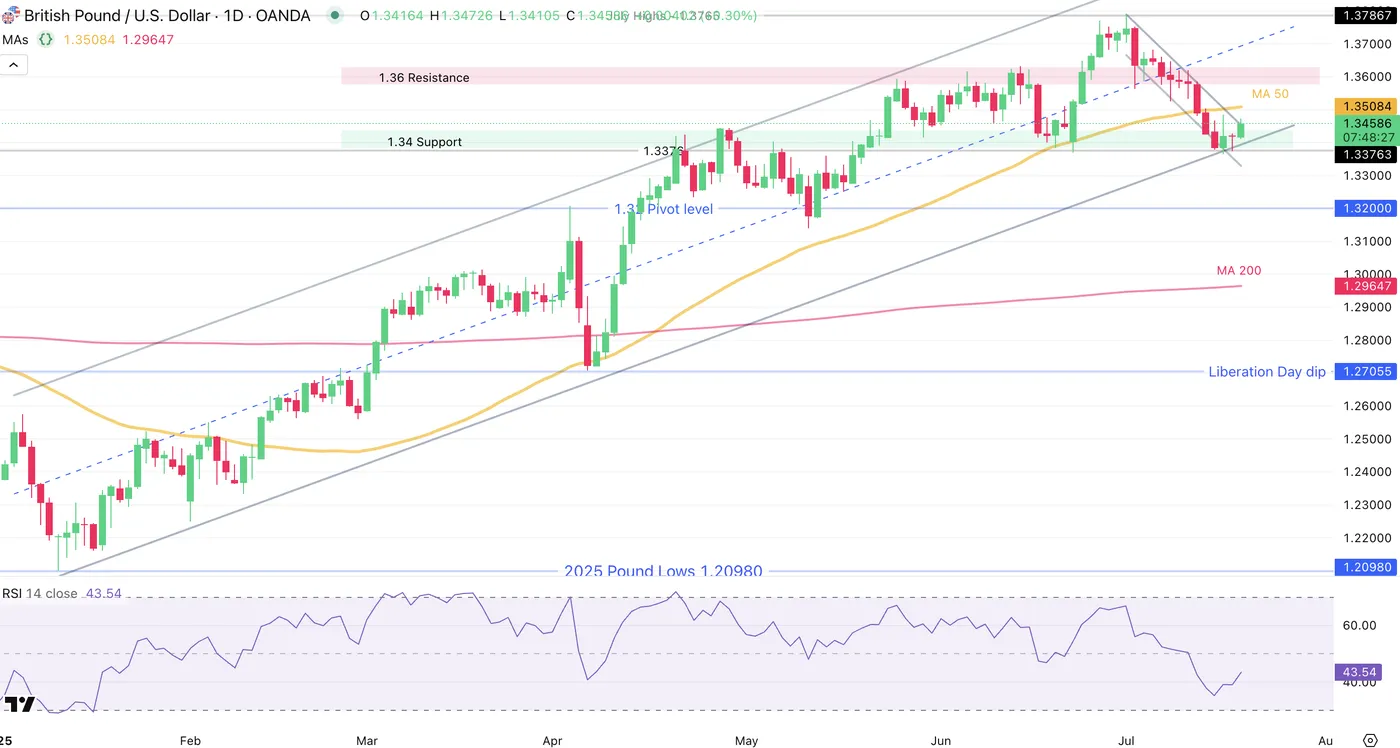
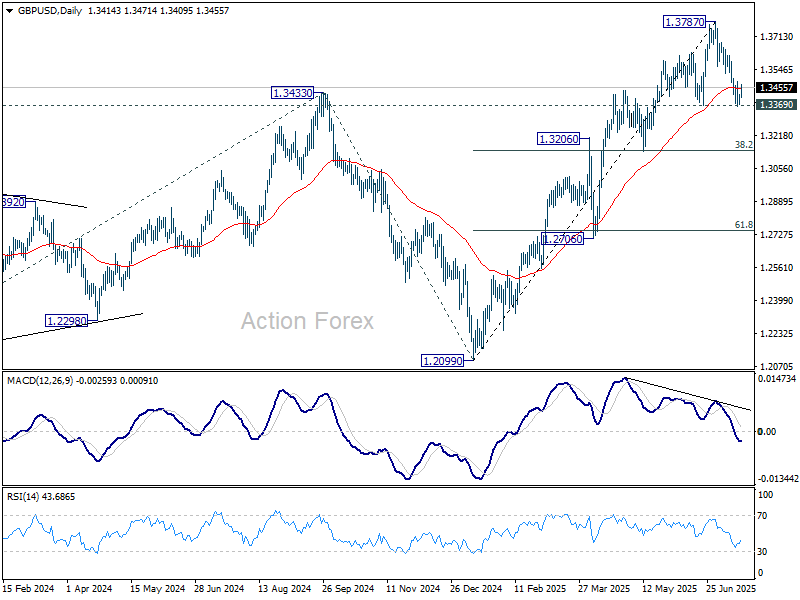
GBPUSD Daily Chart, July 18, 2025 – Source: TradingView
The Pound has had a strong run in the last part of June, as the post-war euphory took the pair to November 2021 highs.
However, the swift momentum higher got met bet a N-shape reversal (N for nope) which brought markets right where they were before the run-up, marking a 4-handle round-turn.
Our US CPI Preview analysis had mentioned the upcoming 1.34 Key support that just came into play, with Quid buyers stepping in lifting the pair, particularly as prices touched the bottom of the 2025 Channel.
Buyers will still have to breach the Key 50-Day Moving Average at 1.35, with a failure to do so bringing the newfound selling back to the table.
Too, RSI momentum has been holdingbelow the middle line for the first time since 2025, indicating more balance in the previous uptrend.
GBPUSD 4H Chart
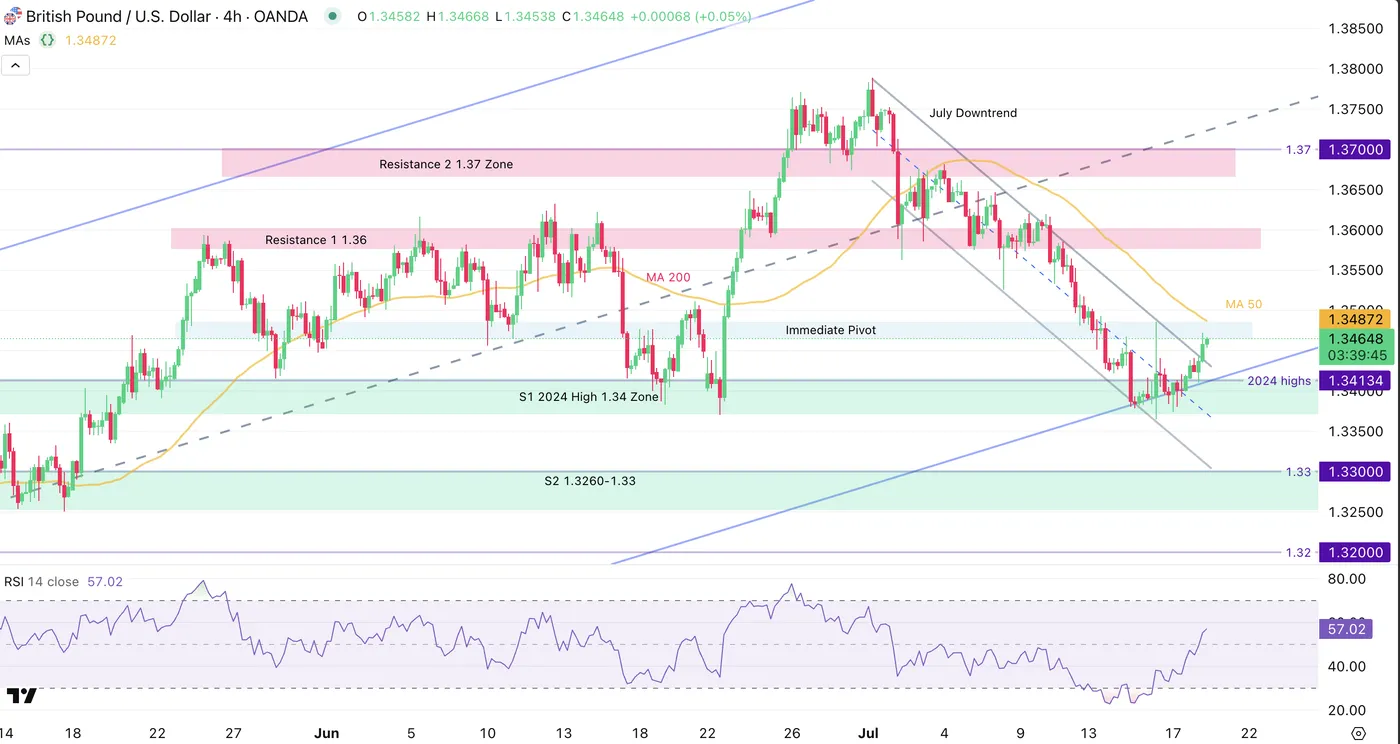
GBPUSD 4H Chart, July 18, 2025 – Source: TradingView
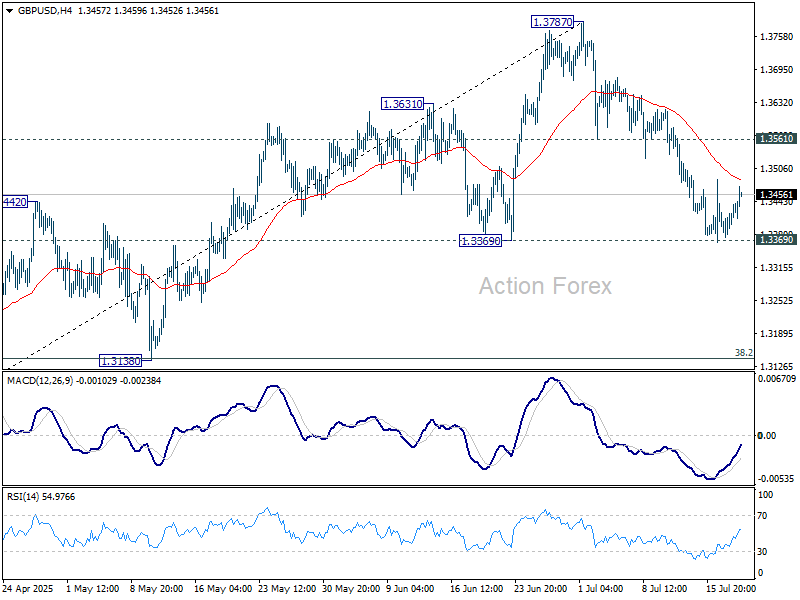
Looking closer, the strong selloff since July 1st has found some reverting to it, with RSI Momentum actually starting to look more bullish than bearish again.
Buyers will have to make sure to not breach the 2025 weekly upwards channel to maintain the ongoing run – Sellers might also have a reason to step in: Prices are approaching the immediate Pivot between 1.3465 to 1.3480 (just above current levels).
Reverting back downwards from here gives them the hand, while continuing higher (breaching 1.35 particularly) would give relative strength to the Buyers.
Support Levels:
- 1.3430 high of July Downtrend
- 1.34 Support Zone
- 1.32 to 1.3250 Major higher timeframe support
Resistance Levels:
- 1.3480 (4H MA 50)
- 1.3550 Zone
- 1.37 to 1.3750 Main Resistance
GBPUSD 30m Chart
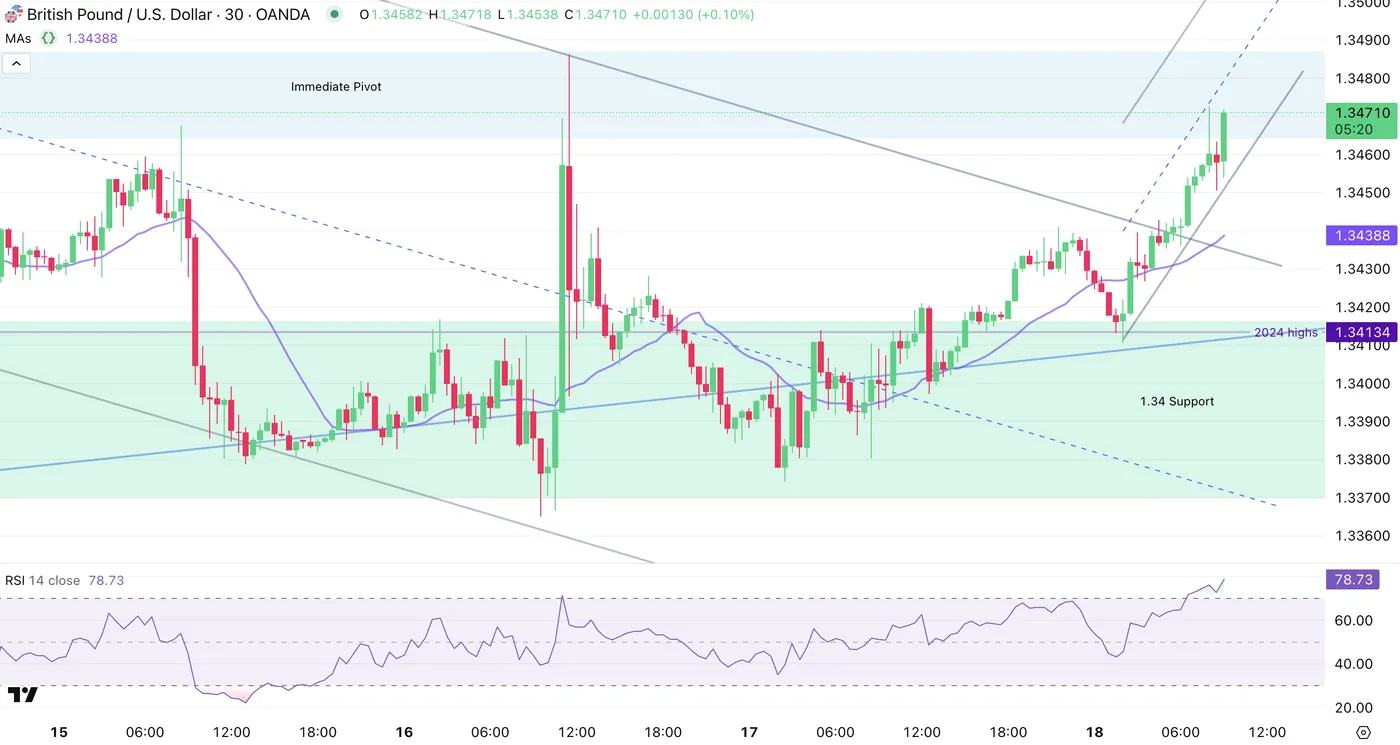
GBPUSD 30m Chart, July 18, 2025 – Source: TradingView
The ongoing buying momentum is very strong, with prices evolving in a tight bull channel – This might have to do with the flash sale happening in the US Dollar this morning.
There has been some extra developments with FED's Waller giving very dovish words right before the 2-week pre-meeting blackout period (no words will bve heard from FED Speakers.)
Safe Trades!
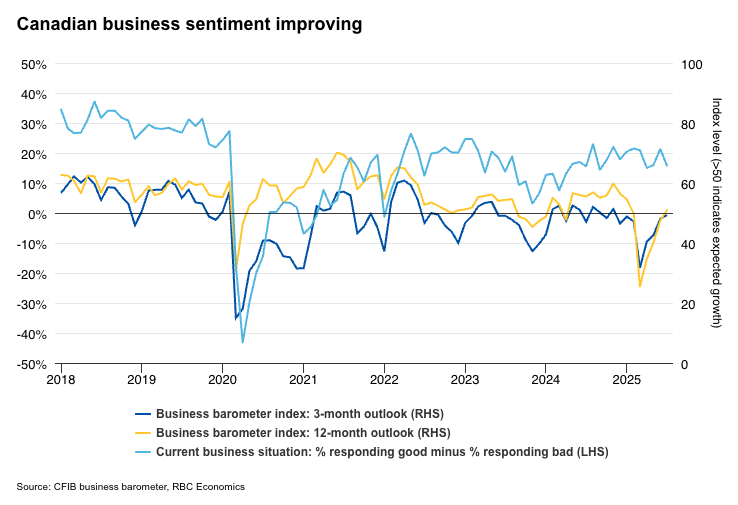
Canadian Business Sentiment Likely Stabilized in Q2 After Earlier Deterioration
The Bank of Canada’s Business Outlook Survey on Monday is expected to show early signs of stabilization in businesses’ expectations for future sales, input prices and hiring in Q2.
The likely improvement follows marked deterioration in Q1, and was during a survey period (Q2 typically spans from early to late May) when threats specifically targeting Canada had receded.
Indeed, as much as Canada was a main focus of trade grievances earlier in Q1, it was excluded from the list of U.S. trade partners facing reciprocal tariffs in April. A duty-free exemption for trade compliant with the USMCA imposed in March also remains in effect.
Indicators have broadly pointed to a stabilizing economic backdrop in Q2. Job openings from Indeed.com steadied into the summer following earlier declines. Business confidence in Canadian Federation of Independent Business surveys continued to improve in July after plunging in March.
We expect next week’s BOS will largely mirror these trends. More significantly, the survey could highlight a divergence between sectors directly exposed to trade headwinds (such as manufacturing and transportation), which will likely maintain a softer outlook, while other sectors, particularly consumer-facing businesses, that are more positive.
The BoC will be watching inflation expectations closely, after a string of mostly hotter consumer price index reports raised concerns that resilience in consumer spending is also leading to resilience in inflation.
Inflation expectations already drifted broadly higher for businesses and consumers in Q1. The early estimate of retail sales was a 1.1% decline in May from April, but to levels that are still resilient relative to low consumer confidence. Our tracking of card transactions pointed to further resilience in June.
Broadly, that kind of a backdrop—better than feared growth and higher than wanted inflation topped with in the prospect of significant fiscal stimulus spending in the year ahead —leaves an high bar for the BoC to make additional interest rate cuts this year. We do not expect further interest rate reductions from the BoC.
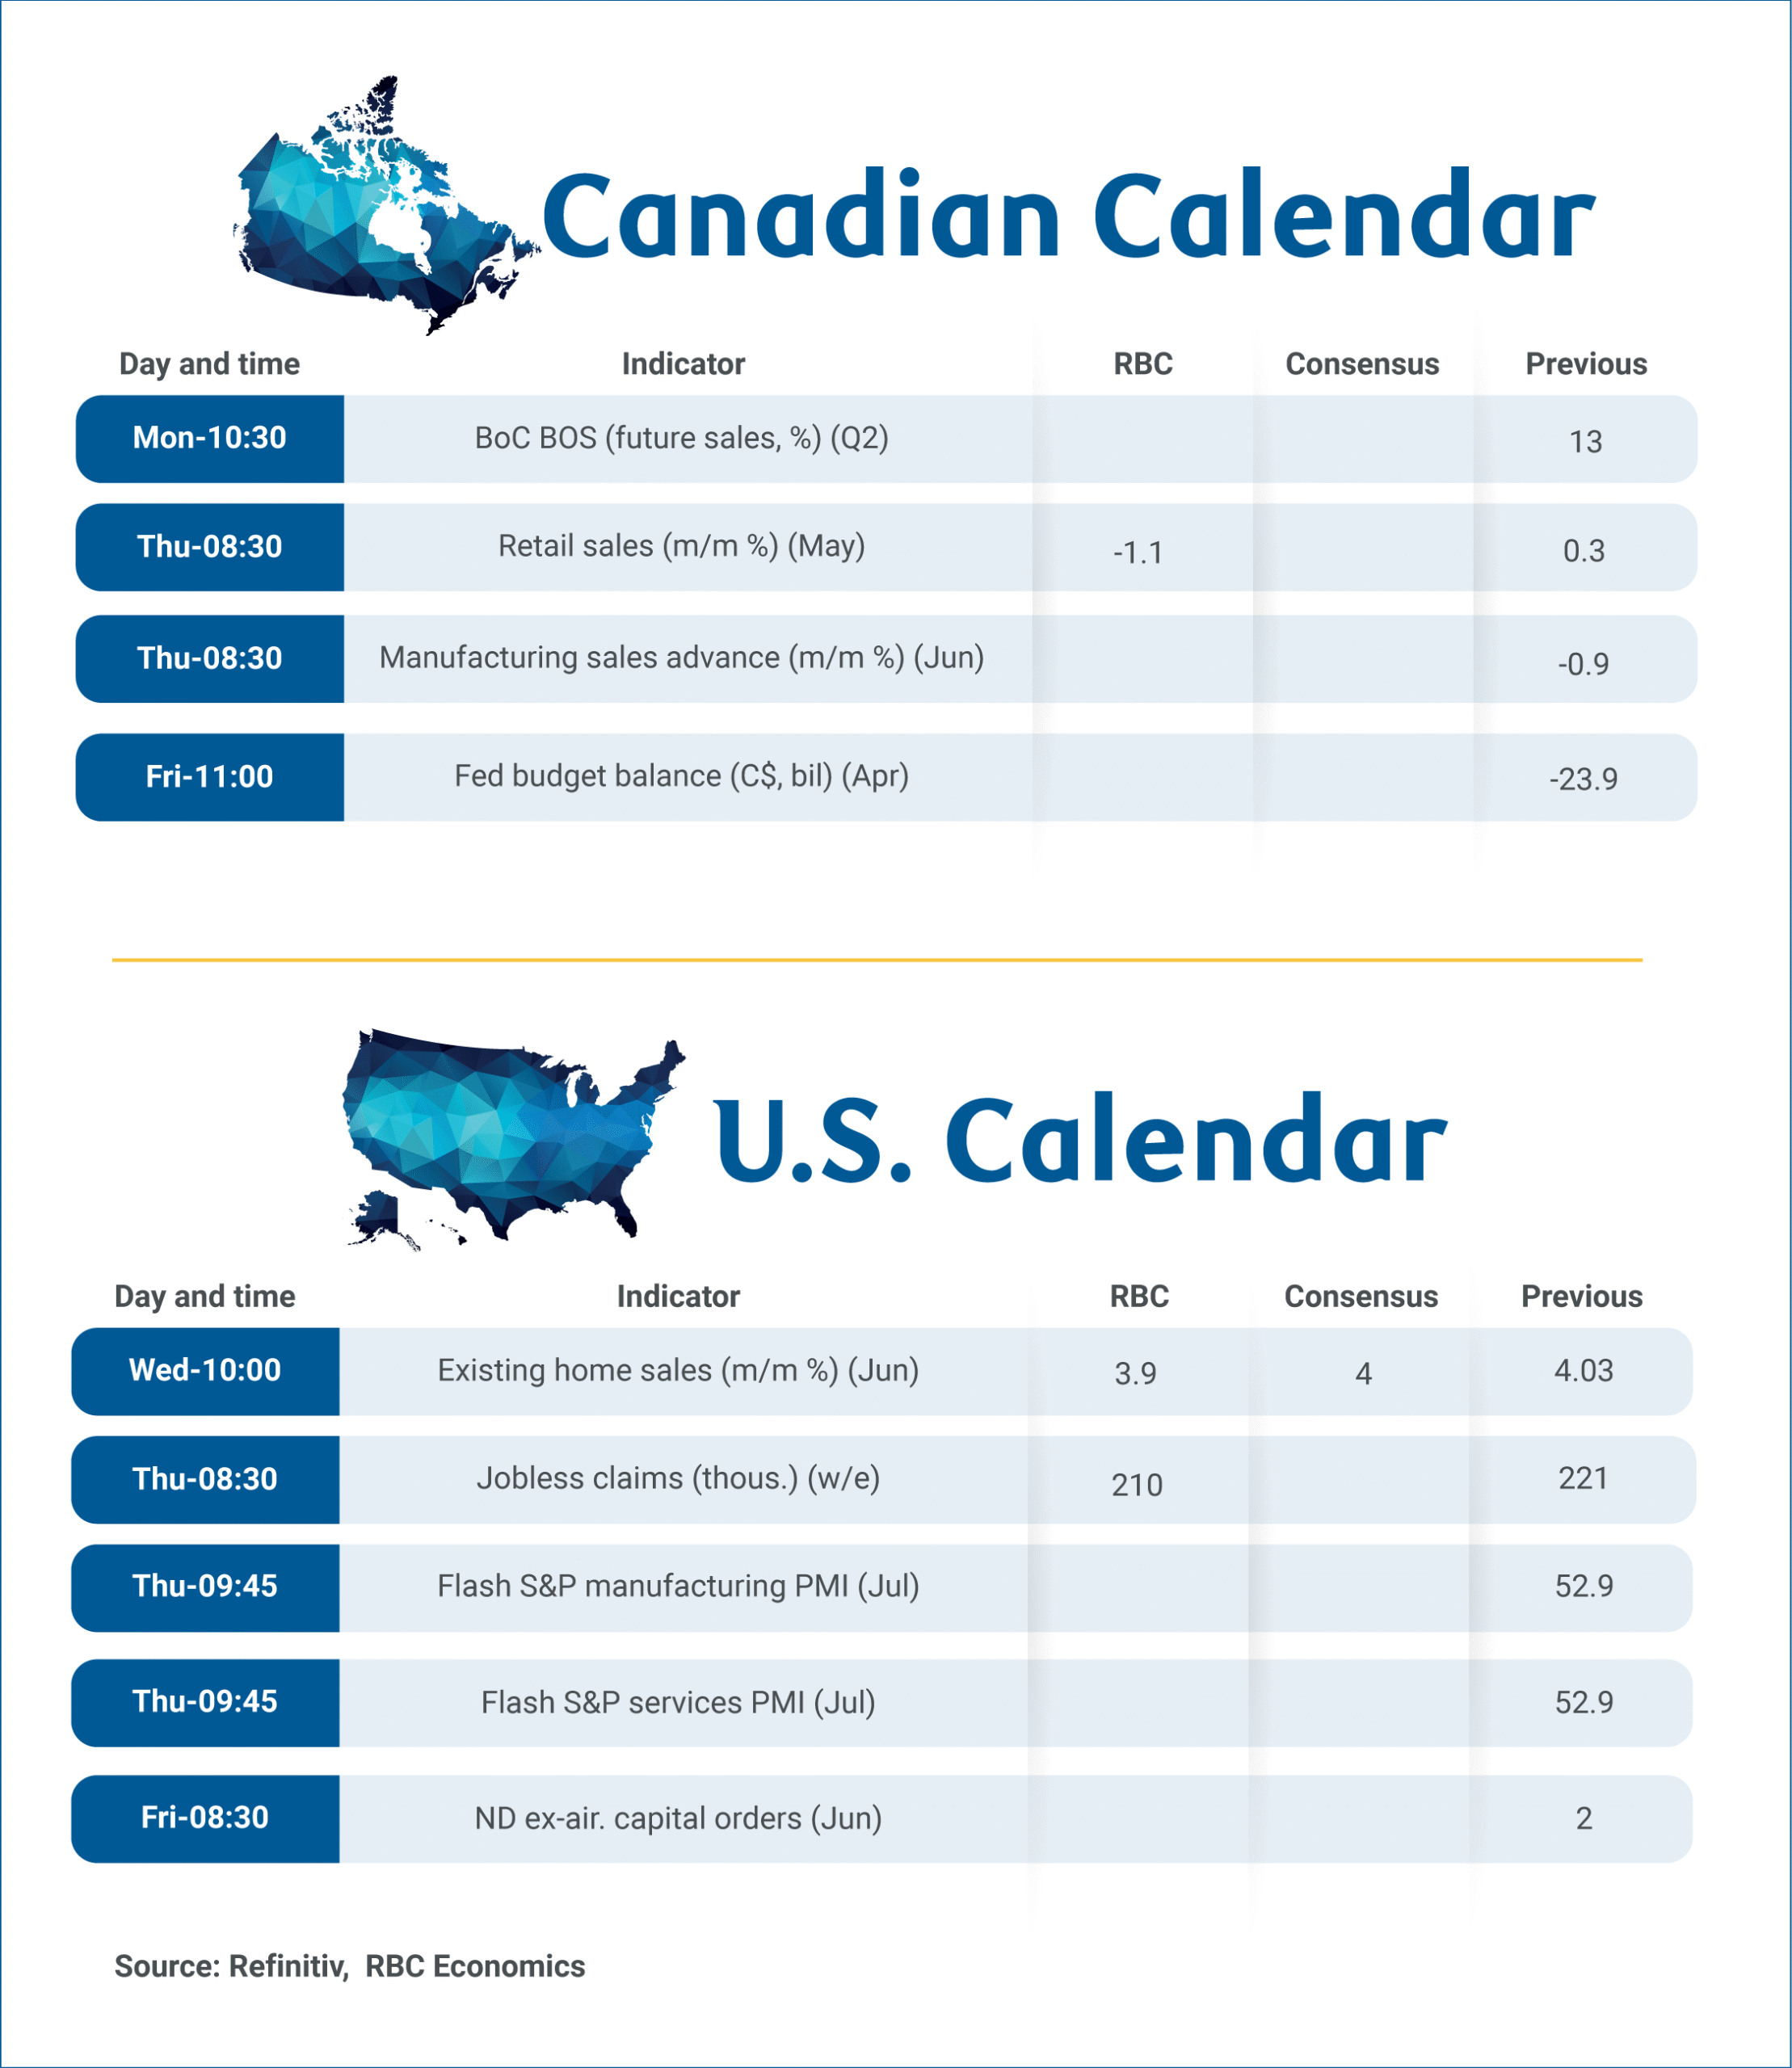
Week ahead data watch:
According to the StatsCan’s advance retail indicator, sales declined by 1.1% in May. By our count, much of this slowdown was driven by a decrease in auto sales during the month. Gas prices edged slightly lower on a seasonally adjusted basis, and we anticipate that sales at gas stations remained little changed during that month.
US UoM consumer sentiment rises to 61.8, inflation expectation eases
US consumer sentiment improved in July, with the University of Michigan index rising from 60.7 to 61.8 — the highest reading since February. The gains were broad-based, as both Current Conditions Index and Expectations Index ticked up to 66.8 and 58.6 respectively.
Inflation expectations, however, showed a more meaningful shift. Year-ahead inflation expectations dropped sharply from 5.0% to 4.4%. Long-run expectations declined for a third straight month to from 4.0% to 3.6%. Although these are the lowest readings since February, both remain well above the levels seen at the end of 2024, reflecting continued concern about future price pressures.
Sunset Market Commentary
Markets
The US dollar is bearing the brunt of Fed Waller blatantly soliciting for a job as Fed chair. The influential Fed governor called for a rate cut as soon as this month during a speech overnight, referring to the risk of the labour market tipping over. In another speech this afternoon he refused to repeat his call, but his wording made it obvious he’s favouring lower rates. “The private sector is not doing as well as people think” and “it wouldn’t take much to tip the labour market”. His comments are probably welcomed by the Trump administration, with the president himself consistently calling for lower rates (as low as 1%). And in case you wondered, Waller said “yes” to the question what he’d answer should president Trump ask him to lead the Fed. There’s little chance the Fed will heed Waller’s call given the majority still backs Powell’s wait-and-see but the greenback is nevertheless under pressure against all G10 peers. The trade-weighted index is printing losses, be it only for the second day so far this month. DXY eases from 98.73 at yesterday’s close to 98.28 currently. EUR/USD tested and bounced off support at 1.1573 (April high) on Thursday and builds on the rebound with gains today to 1.165. Sterling eyes vulnerable. EUR/GBP’s test of 0.87 earlier this week failed, triggering some return action lower initially. That’s being reversed already today with the pair moving towards the 0.866 area. JPY is sharing the laggard’s scoreboard with the USD. The Japanese Upper House is headed for important elections this Sunday. If prime minister Ishiba’s LDP-lead ruling coalition is to lose its majority (as was the case in the more powerful Lower House elections last October), we (and markets) could see party-pressure rising for (costly) measures to address the cost of living crisis deemed responsible for the loss. Watch out for the long end of the Japanese (and others) yield curve in that case. For today and going into the weekend, though, the core bond mood is constructive, particularly in the US. Front end underperformance results from Waller’s comments, pushing yields between 3.5-3.9 bps down in the 2-5 yr bucket. Longer maturities ease about 1.8-2.8 bps. It’s interesting to see how 10-yr inflation expectations are, partially at least, compensating for the loss in real yields. It’s suggestive of lingering concerns for political interference with the independent Fed after the feud between Trump and Powell this week hit the headlines again. More politicians, including Speaker of the House Johnson today, are now weighing in on Fed policy. German bunds underperform vs Treasuries (and swaps), adding 1.3-2.8 bps in a bear steepening - but technically irrelevant - move. European stock markets trade little changed while Wall Street opens with slight gains.
News & Views
According to rating agency Fitch, the outcome of the presidential elections in May in Poland can exacerbate political uncertainty in the country. It might continue to challenge the government’s capacity to implement fiscal consolidation and economic reforms. Fitch expects that the new president, Karol Nawrocki, is likely to continue challenging the government. In recent years, public finances have deteriorated significantly, with the general government deficit rising from 1.7% in 2021 to 6.6% of GDP. Fitch assess the government’s consolidation plans to be predominantly backloaded. Additional measures are needed to reduce the deficit below 3%. Fitch now forecasts this year’s budget deficit at 6.6%. It might decline to 4% in 2028. Fitch sees the debt to GDP ratio at 64% by 2027 from 55% end 2024, widening its gap above the ‘A’ median and reducing headroom at the current rating level. Fitch currently has a A- rating for Poland with a stable outlook. The next rating review of Fitch is scheduled for September 5.
The Hungarian Government Debt Management debt agency today announced that it mandated Bank of China and three other financial institutions to organize the issuance of Hungarian Panda bonds intended primarily for Chinese institutional investors. After a USD $4 bln bond issuance in June, AKK this month amended the issuance plan to allow for this Panda bond issuance. Both the USD and the Panda bond issuances serve two purposes: enhancing the flexibility and security of financing.
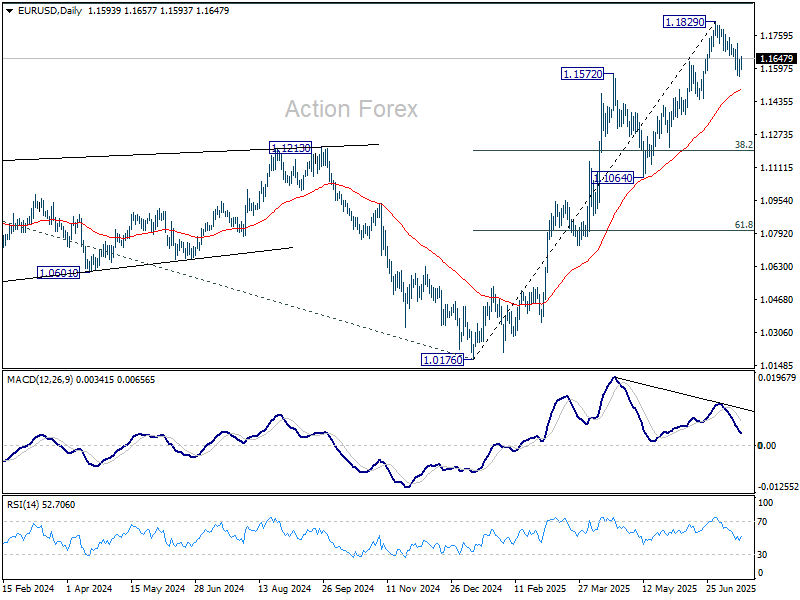
EUR/USD Mid-Day Outlook
Daily Pivots: (S1) 1.1555; (P) 1.1600; (R1) 1.1642; More...
Intraday bias in EUR/USD remains neutral for the moment. Below 1.1555 will extend the corrective fall from 1.1829 to 55 D EMA (now at 1.1493). Sustained break there will target 38.2% retracement of 1.0176 to 1.1829 at 1.1198. On the upside, though, break of 1.1720 will bring retest of 1.1829 high.
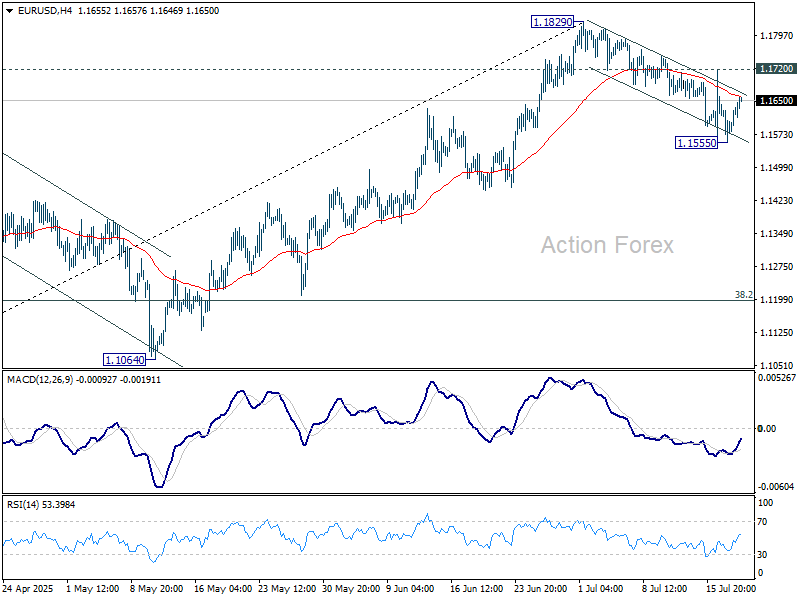
In the bigger picture, rise from 0.9534 long term bottom could be correcting the multi-decade downtrend or the start of a long term up trend. In either case, further rise should be seen to 100% projection of 0.9534 to 1.1274 from 1.0176 at 1.1916. This will remain the favored case as long as 1.1604 support holds.
GBP/USD Mid-Day Outlook
Daily Pivots: (S1) 1.3379; (P) 1.3411; (R1) 1.3447; More...
Intraday bias in GBP/USD stays neutral at this point. Focus stays on on 1.3369 support. Decisive break there will suggests that fall from 1.3787 is already correcting the rise from 1.2099. Deeper fall should then be seen to 1.3138 cluster support (38.2% retracement of 1.2099 to 1.3787 at 1.3142). Nevertheless, strong rebound from current level will retain near term bullishness. Break of 1.3561 support turned resistance will bring retest of 1.3787 high first.
In the bigger picture, up trend from 1.3051 (2022 low) is in progress. Next medium term target is 61.8% projection of 1.0351 to 1.3433 from 1.2099 at 1.4004. Outlook will now stay bullish as long as 55 W EMA (now at 1.3019) holds, even in case of deep pullback.
USD/JPY Mid-Day Outlook
Daily Pivots: (S1) 147.86; (P) 148.48; (R1) 149.22; More...
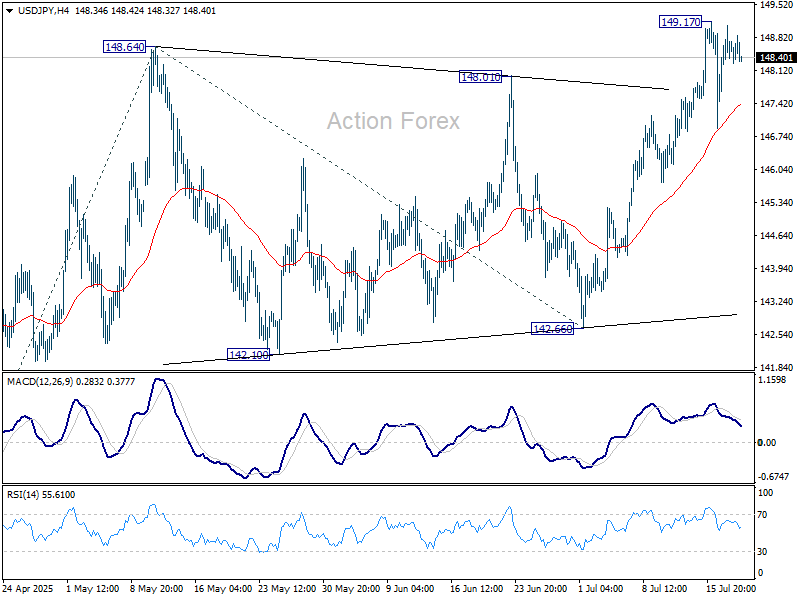
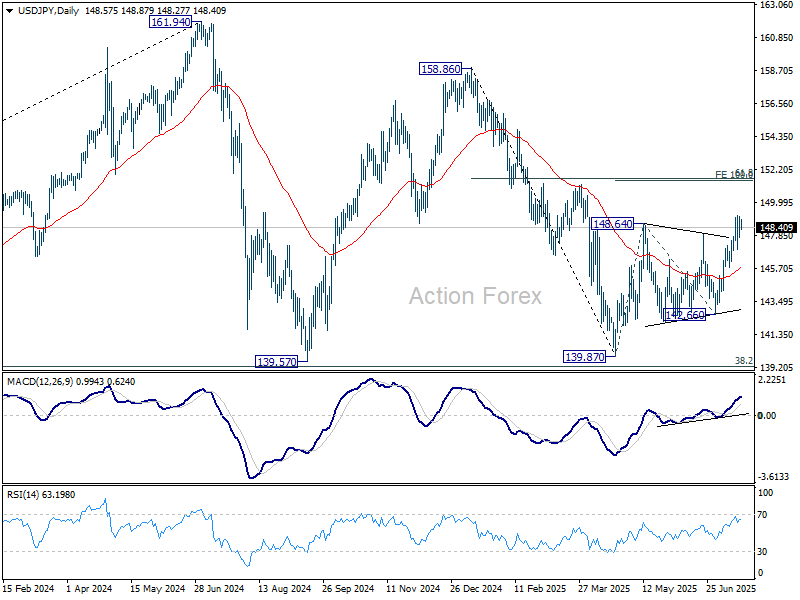
USD/JPY is staying in consolidations below 149.17 and intraday bias stays neutral. Downside should be contained by 55 D EMA (now at 145.77). Break of 149.17 will resume the whole rise from 139.87 to 100% projection of 139.87 to 148.64 from 142.66 at 151.43. That is close to 61.8% retracement of 158.86 to 139.87 at 151.22.
In the bigger picture, price actions from 161.94 (2024 high) are seen as a corrective pattern to rise from 102.58 (2021 low). There is no clear sign that the pattern has completed yet. But still, strong support is expected from 38.2% retracement of 102.58 to 161.94 at 139.26 to bring rebound.
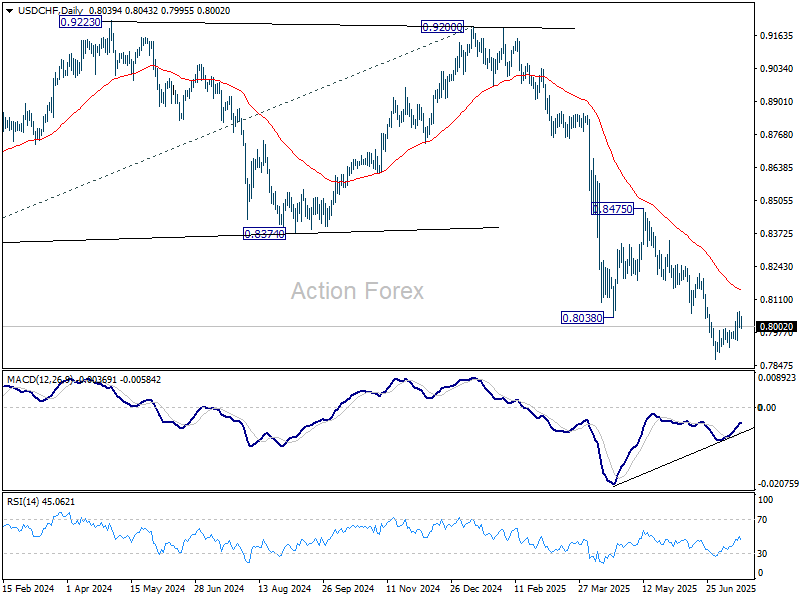
USD/CHF Mid-Day Outlook
Daily Pivots: (S1) 0.8011; (P) 0.8037; (R1) 0.8071; More….
Intraday bias in USD/CHF remains neutral for the moment. On the downside, break of 0.7946 minor support will indicate rejection by 0.8054 support turned resistance and retain near term bearishness. Retest of 0.7871 should be seen next and break will confirm larger down trend resumption. Nevertheless, sustained break of 0.8054 will suggest that rise from 0.7871 at least correcting the fall from 0.8475. Further rise should then be seen to 55 D EMA (now at 0.8146).
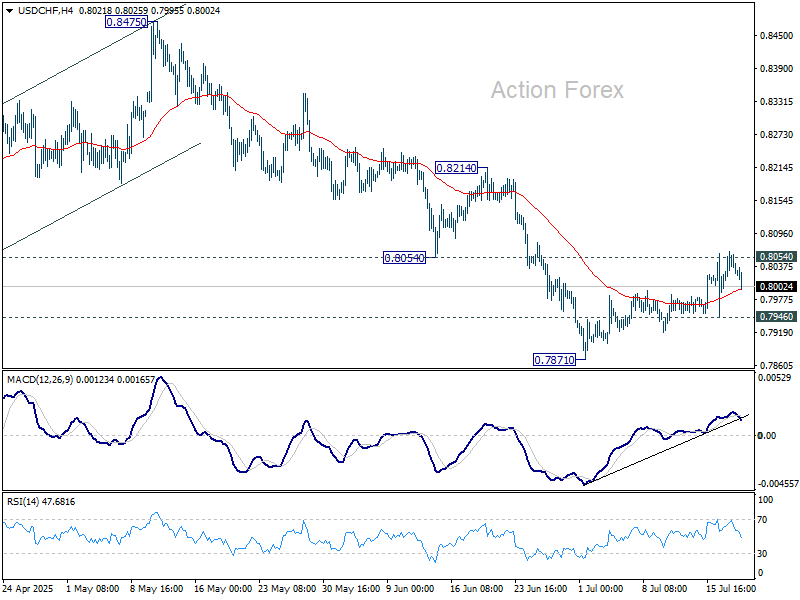
In the bigger picture, long term down trend from 1.0342 (2017 high) is still in progress. Next target is 100% projection of 1.0146 (2022 high) to 0.8332 from 0.9200 at 0.7382. In any case, outlook will stay bearish as long as 0.8475 resistance holds.
Muted Dollar Pullback Leaves Weekly Gains Intact
Dollar is seeing a modest pullback in today's trading, yet it remains the strongest performer for the week. Market activity has been relatively subdued in the absence of major data or headlines. Traders now turn their attention to the University of Michigan's consumer sentiment and inflation expectations data due later today. These numbers could shed light on how recent tariff re-escalations are filtering into household confidence and inflation perceptions.
Elsewhere in FX, Loonie is holding second place for the week, while the British Pound follows in third. At the bottom end, Aussie continues to struggle at the bottom, while Yen and New Kiwi also underperform. Euro and Swiss Franc are trading in middle ground.
On the trade front, Japanese Prime Minister Shigeru Ishiba said today that US Treasury Secretary Scott Bessent assured him that ongoing tariff negotiations will yield a “good” outcome ahead of the August 1 deadline. Ishiba confirmed he is prepared to speak directly with President Trump if needed to protect Japan’s interests, though no date has been set for such talks.
Bessent reinforced the message on social media, saying a good deal is preferable to a rushed one and remains “within the realm of possibility.” The comments suggest some progress behind the scenes, but markets remain cautious given the lack of detail and the short runway before tariffs kick in.
Meanwhile, German Chancellor Friedrich Merz flagged that any tariff deal between the US and EU will likely be “asymmetrical,” citing American reluctance to include services in the negotiations. Merz stressed the importance of keeping tariffs low on both sides, but acknowledged that perfect balance is unlikely.
In Europe, at the time of writing, FTSE is up 0.16%. DAX is down -0.29%. CAC is up 0.04%. UK 10-year yield is up 0.004 at 4.663. Germany 10-year yield is up 0.016 at 2.695. Earlier in Asia, Nikkei fell -0.21%. Hong Kong HSI rose 1.33%. China Shanghai SSE rose 0.50%. Singapore Strait Times rose 0.67%. Japan 10-year JGB yield fell -0.026 to 1.533.
Japan CPI core cools to 3.3% on energy, but food and services prices still climb
Japan’s core consumer inflation slowed in June for the first time in four months, driven by easing energy prices. Core CPI, which excludes fresh food, decelerated from 3.7% yoy to 3.3% yoy, in line with expectations. While still above the BoJ’s 2% target — where it's been since April 2022 — the moderation suggests waning energy cost pressures. Headline CPI also dipped to 3.3% from 3.5% in May.
However, underlying price pressures remain sticky. The core-core CPI, which excludes both fresh food and energy, rose from 3.3% yoy to 3.4% yoy, highlighting persistent inflation in services and food. Services inflation ticked up from 1.4% yoy to 1.5% yoy. Food prices excluding fresh items surged 8.2% yoy, up from 7.7% yoy. Rice inflation eased marginally but remains historically elevated at 101.7% yoy.
USD/CHF Mid-Day Outlook
Daily Pivots: (S1) 0.8011; (P) 0.8037; (R1) 0.8071; More….
Intraday bias in USD/CHF remains neutral for the moment. On the downside, break of 0.7946 minor support will indicate rejection by 0.8054 support turned resistance and retain near term bearishness. Retest of 0.7871 should be seen next and break will confirm larger down trend resumption. Nevertheless, sustained break of 0.8054 will suggest that rise from 0.7871 at least correcting the fall from 0.8475. Further rise should then be seen to 55 D EMA (now at 0.8146).
In the bigger picture, long term down trend from 1.0342 (2017 high) is still in progress. Next target is 100% projection of 1.0146 (2022 high) to 0.8332 from 0.9200 at 0.7382. In any case, outlook will stay bearish as long as 0.8475 resistance holds.
Dollar Index Remains Constructive, Weekly Close Eyed for Fresh Signal
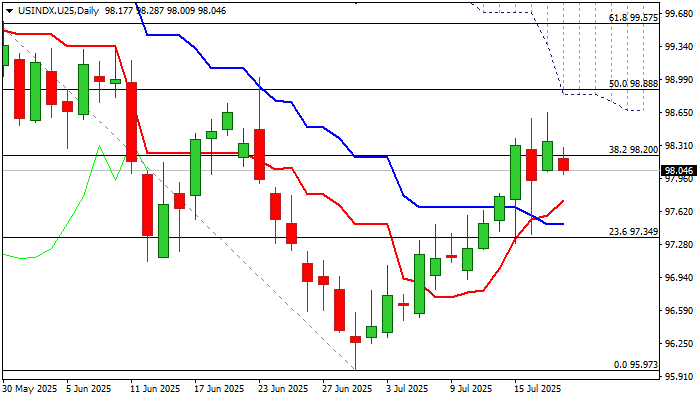
The dollar index keeps overall firm tone and heading for the second straight weekly gain, with some important technical barriers being cracked this week.
However, situation on daily chart indicates that bulls might be running out of steam, after pivotal Fibo barrier at 98.20 (38.2% of 101.80/95.97) has been broken, but fresh upside attempts were repeatedly capped by falling 55DMA (98.56).
Daily technical studies are mixed as positive momentum is strong and daily Tenkan / Kijun-sen formed a bull cross, but the action is weighed by falling daily cloud.
Our focus will be on today’s closing, with weekly close above 98.20 Fibo level to confirm positive signal and keep bulls in play for renewed attempt through 55DMA and attack at next key obstacles at 98.84/88 (50% retracement / daily Ichimoku cloud bases).
Conversely, closing below 98.20 would generate initial bearish signal (bull-trap) and keep the downside vulnerable.
Res: 98.28; 98.56; 98.88; 99.35.
Sup: 98.03; 97.66; 97.28; 96.81.