
Sample Category Title
Fed’s Daly backs two cuts this year, sees tariff impact as muted
San Francisco Fed President Mary Daly said two interest rate cuts this year remain a “reasonable” baseline, as the inflation from tariffs appears less severe than initially feared. Speaking overnight. She projected the policy rate could ultimately stabilize around 3% or slightly above.
Daly downplayed the precise timing of the next move, saying, “Whether it happens in July or September or some other month is really not the most relevant piece.” What matters, she argued, is that the Fed stays on track to avoid overtightening and harming the labor market. “We don’t want to unnecessarily tighten the economy in a way that hurts the labor market or growth,” Daly added.
She also emphasized that bringing inflation down the “last mile” doesn’t require a sharp slowdown. “I wouldn't want to see more weakness in the labor market,” Daly said. “Which is why you can’t wait forever” to cut rates.
Two TEACHable Moments
Last week’s RBA decision and Trump’s recent tariff escalation both highlight the need to take organisational dynamics and human psychology into account.
- While there was nothing economically to be gained by the RBA waiting to cut rates, neither was there any material policy cost. Psychological and organisational factors therefore might have come into play, with the RBA taking the opportunity to assert some independence.
- Not paying enough attention to these psychological issues was a mistake, and thus a learning opportunity.
- Psychological factors are also at play in global tariff negotiations. If people think you will chicken out, you set out to prove them wrong. Asserting dominance is another psychological factor at work in the international sphere. This complicates analysis and prediction, but economic fundamentals still matter as well.
Try, Even After Catching Heat
Since last week’s surprising RBA Monetary Policy Board meeting, countless pixels have been spilt trying to understand the central bank’s rationale. There was no real economic benefit to waiting five more weeks. This week’s labour force data would not have tipped a decision to cut in August back to a decision to hold, even if the data had not shown the softening in employment and kick up in the unemployment rate in the month.
The third month of CPI data will also not add much new information to support a continuing hold. Recall that even with a partial monthly CPI indicator, once the second month of the quarter is in, you already have two-thirds of the ultimate quarterly read. This is true no matter how much of the index is measured monthly. Two out of three months of the data measured monthly are available and so are two-thirds of the components that are only measured in one of the three months in the quarter, assuming these are evenly distributed across the three months. (This is why the Governor’s comment that the monthly inflation data was ‘a little too volatile and not quite representative of what’s really going on with inflation’ misses the mark. It is a true statement about the headline monthly indicator, but that is not how people are using the data.)
Neither was there much of a cost to waiting, though. As we have previously noted, the dirty little secret of monetary policy is that small differences in the level of interest rates or the timing of changes make essentially no difference for inflation outcomes. If holding the cash rate 100bp lower for a year only boosts inflation by 0.2%pt or so – broadly the result from the RBA’s main model – then 25bp higher for five weeks is not even a rounding error.
It’s a natural human temptation to want to minimise error. After all, we did warn that a cut in July was not a shoo-in, and three of the nine Board members voted against the decision, and presumably in favour of a cut. But we must face into those wrong calls and own them if we are to learn from them. The lesson here is to keep trying to understand, even after a wrong prediction.
Firstly, I underestimated how much we humans can get stuck in a narrative. It was one thing to push back on a market that was focused on the ‘but they discussed 50bps!’ argument and an apparent downward revision to views of the neutral rate. It was quite another to believe that the RBA would keep clinging to the idea that inflation was too high because one very lagged (but important) measure was at 2.9%. Our own assessment, based on more recent data, was that the current pulse of trimmed mean inflation is closer to the midpoint of the 2–3% target range than that. Perhaps because we were so clear on our own view of the inflation pulse, I underweighted the possibility that the RBA would stick to a different view despite the latest monthly data. Put another way, I overweighted what I thought the RBA should do over what I suspected they would do.
Secondly, I underestimated the psychological element. We knew that the RBA is not the Fed in terms of its comfort with surprising the market. And it has become clear that the RBA Governors would regard it as pre-empting the Monetary Policy Board to guide the market ahead of a meeting and a decision being made; this is one of the drawbacks of having a majority of outside members on a committee making a market-sensitive technical decision.
More importantly, though, I should have given some weight to the idea that the RBA insiders might use a relatively costless (from a policy perspective) five-week wait to signal the institution’s independence. The last thing a central bank wants is to be seen as not independent, including from the markets. Cutting the cash rate in July, rather than the RBA’s original preference for a ‘cautious and predictable’ quarterly pace coinciding with fresh forecasts, would have looked a bit like the market pricing forced the cut. Avoiding that impression was probably viewed inside the RBA as being worth the subsequent criticism.
Trump Escalates And Causes Havoc
A similar ‘you’re not the boss of me’ instinct can be seen in recent US tariff developments.
Much has been made of the ‘Trump Always Chickens Out’ idea, first mooted by Rob Armstrong of the FT ‘Unhedged’ newsletter. Perhaps, though, it would have been better framed as ‘Trump Ambit Claims Often’ – a description of a negotiating strategy rather than the suggestion of a character flaw. Because once the idea began to circulate, it was natural human psychology – not even specific to President Trump – to want to prove it wrong.
Thus we see the US administration not only not chickening out, but in some cases escalating its tariff demands. In many cases this is a negotiating tactic to get countries to offer further concessions or reach a deal at all. The administration may also have been emboldened by the sanguine response of financial markets to recent developments, as well as the relatively muted effect evident in recent US inflation data. Meanwhile, countries that have reached a deal have achieved a lower US tariff rate than was originally announced in April.
Another element of this recent escalation is continuing the dominance display that these tariffs always represented. They are as much about showing the world who is boss – or, as the White House itself put it, “Keeping America in the Driver’s Seat” – as about actual economic policy goals.
Economic fundamentals still apply. The tariffs are still an act of inflationary self-harm, so the default presumption should be that re-escalations are negotiating tactics, not the likely end state. And to the extent that specific goods are not already produced in the United States, relative tariffs will matter as well as absolute tariff levels. Countries facing a 10% or 20% tariff should therefore not feel too despondent about it.
That said, we are more in the realm of psychology than economics and must proceed accordingly. While de-escalation from ambit claims is still the likely outcome for most countries, temporary blow-ups cannot be ruled out. A lot will depend on other governments striking the right balance between belligerence and obsequiousness. Governments and outside observers alike will need to pay attention to the psychology – and learn from their own and others’ past errors.
Cliff Notes: Balancing Inflation and Growth Concerns
Key insights from the week that was.
In Australia, the main event this week was the June Labour Force Survey. It was another disappointing read for job creation (+2k) that left employment effectively flat over May and June. Growth is still coming off a high base though, annual growth holding at 2.3%yr on a three-month average basis. However, it is also telling that average hours worked posted a significant decline (–1.0%), falling short of the long-run trend and providing an explanation for why underemployment ticked up to 6.0%.
The most notable and surprising development in the report was the unemployment rate’s 0.2ppt increase to 4.3% after five consecutive months at 4.1%. This looks to have been driven by a material increase in youth unemployment (ages 15-24), up 0.9ppts to 10.4% in June. While there is likely some noise in the mix, moves of this magnitude in the past have often preceded a grind higher in total unemployment.
The May and June labour market updates suggest a gradual softening in conditions may be resuming after the recent period of resiliency. Having remained on hold in July, this data adds weight to the already-strong case for a 25bp rate cut at the RBA’s August meeting.
Also of note for Australia this week, the Westpac-MI Consumer Sentiment index highlighted households’ disappointment with the RBA’s July decision. The responses received prior to the decision equated to a reading of 95.6, while those surveyed after came in at 92.0. The net result was a modest rise in overall sentiment, up 0.6% to 93.1 in July. This ‘cautiously pessimistic’ reading reflects the enduring impact of earlier cost-of-living pressures on real incomes and consumption, as evinced by ‘family finances vs. a year ago’ and ‘time to buy a major household item’ remaining 10% and 21% below their respective long-run averages. Households remain confident over the prospect of interest rate relief over the year ahead, however. At the margin, this should support a gradual recovery in finances and spending.
Rumours and debate over the future of US trade policy again filled global headlines this week, the most significant discussion being around a mooted industry tariff for pharmaceutical imports which would start at a low rate but could rise to as much as 200%.
US data meanwhile offered an update on the impact of tariffs on consumer inflation to date. The pull-forward of imports ahead of tariff implementation, the modest 10% tariff rate for most nations during the 90-day negotiation period and soft consumer demand all arguably limited passthrough in June. Still, in the CPI detail there is clear evidence of firms beginning to pass higher costs on, where possible.
Within core goods, inflation for household furnishings, apparel and recreation items all lifted noticeably, respectively to 1.0%, 0.4% and 0.4%. Used and new vehicles (-0.7% and -0.3%) were the counterpoint, likely weighed down by weak demand – durables consumption having declined at a near 4% annualised pace in Q1 GDP and the Atlanta Fed’s nowcast for Q2 GDP consistent with further weakness in total consumption. While hard to distinguish, the 0.3% gain for food was also likely supported by tariffs given the proportion of US food imported from Mexico and Canada and it’s comparatively short shelf life. Helpfully for the overall consumer inflation view and expectations is that shelter inflation continues to decelerate, registering a 0.2% gain in June, equivalent to a 2.5% annualised rate compared to the 3.8% growth between June 2024 and June 2025.
Based on producer price inflation, which decelerated from 3.2%yr to 2.6%yr after a flat result in June, and the fact that tariff increases have been delayed until at least 1 August, the impact of tariffs on inflation is likely to remain modest in the very near term. Still, with business margins coming under pressure and firms needing to invest to maintain capacity let alone expand it, it is inevitable that price increases at the wholesale level will feed through to end users. The alternative is to cut other costs, which would most likely mean a reduction in hours worked and wages growth. Our base case for the US remains inflation between 2.5%yr and 3.0%yr for an extended period despite sub-trend activity growth, limiting the FOMC’s ability to ease.
These are views consistent with the qualitative guidance from the Federal Reserve’s Beige Book. In the July edition, respondents referenced “modest to pronounced input cost pressures related to tariffs, especially for raw materials used in manufacturing and construction” and that “Many firms passed on at least a portion of cost increases to consumers through price hikes or surcharges, although some held off raising prices because of customers' growing price sensitivity, resulting in compressed profit margins”. Economic activity was said to have increased “slightly” and employment “very slightly”.
In China meanwhile, year-to-date growth of 5.3% at June means authorities’ 5.0% growth target for the calendar year is within reach. The composition of growth remains fragile, however, with consumers continuing to hold back on discretionary spending and unwilling to commit to new property investment. Despite the stimulus efforts to date, retail sales has grown at a solid, but not strong, 5.0%ytd while property investment remains down around 11%ytd and new/used property prices continue to fall. Property investment remains the biggest negative for total fixed asset investment, which at June is up 2.8%ytd, though two of the three sub-components for high-tech manufacturing (electrical machinery and chemicals) are now also declining after stellar growth in recent years and the contribution from utilities investment is highly disproportionate to its share of the economy. Foreign trade continues to provide support for aggregate growth, the trade surplus jumping back near January’s record high in June. However, net export’s contribution to GDP will naturally fade, requiring a meaningful lift in domestic demand’s contribution if our 4.6% growth forecast for 2026 is to be achieved, let alone a rate closer to 2025’s 5.0%.
Finally then to the UK. Inflation accelerated to 3.6%yr in June, 3.7%yr on a core basis, as services inflation held at 4.7%yr. In May, average weekly earnings decelerated to 5.0%yr as the unemployment rate ticked up to 4.7%. Alongside other measures like the Decision Maker Panel Survey, this data suggests the labour market is continuing to soften and that inflation risks are likely to be concentrated on the supply-side. Over the coming year, our base expectation remains a gradual policy easing by the Bank of England to a near-neutral level.
ECB Preview: Eyeing the September Meeting
- We expect the ECB to leave the deposit unchanged at 2.00% on Thursday 24 July in line with consensus and market pricing. We expect Lagarde to reiterate the data dependent approach and leave the door open for September, without giving firm signals as data has been limited.
- We expect a final 25bp cut to 1.75% in September due to a weakening services sector, slowing wage growth and elevated trade uncertainty though risks lean towards no cut as ECB members emphasize their “good position” and downplay inflation undershooting concerns.
We expect the ECB to keep the deposit rate unchanged at 2.00% on Thursday 24 July in line with consensus and market pricing. The hawkish shift at the June meeting has removed expectations for a cut in July. Focus next week will be on any signals about the September meeting where markets currently price 10bp worth of cuts. ECB communication has been very unanimous since the June meeting and most GC members have echoed that ECB is in a ‘good position’, while Schnabel (hawk) said that the bar for another cut is very high. The ECB has been downplaying the fact that inflation is expected to temporally undershoot the 2% target as long as medium-term inflation expectations are anchored. The June meeting minutes stated a view that monetary policy ‘should become less reactive to incoming data’ and ‘only large shocks would imply the need for a monetary response’. Hence, we expect no cut at the July meeting while projecting a final cut in September to 1.75% with risks tilted towards an unchanged decision.
We continue to project a cut in September given the trade war risk, a weakening services sector and slowing wage growth that could impact medium-term inflation expectations. The outcome of the tariff negotiations will be important for monetary policy setting going forward as tariffs higher than 10% on the EU would deviate from the ECB’s baseline assumptions. Lately, the risk of a larger 30% tariff has increased, which argues for further easing. We expect the trade war uncertainty to lead Lagarde to reiterate that the ECB is data dependent, thereby not precommitting or closing the door for a cut in September as they await further data.
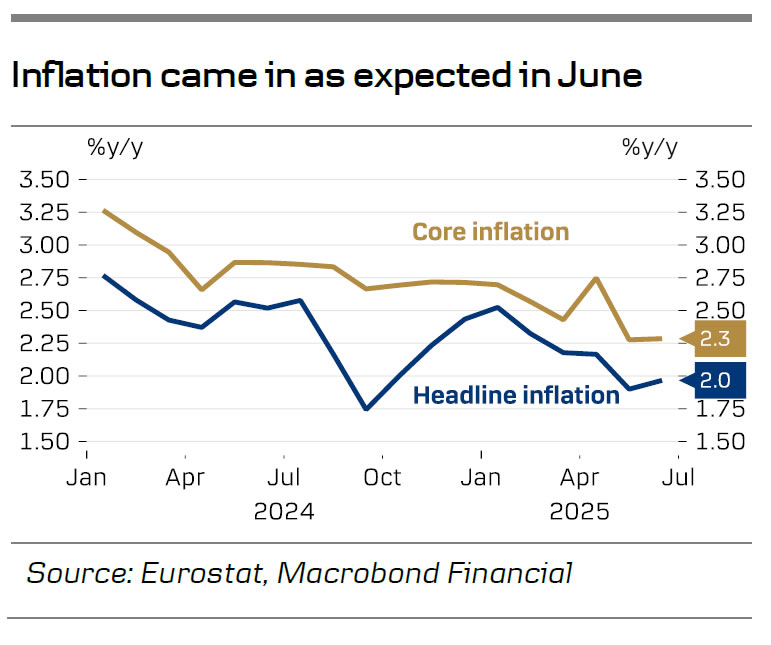
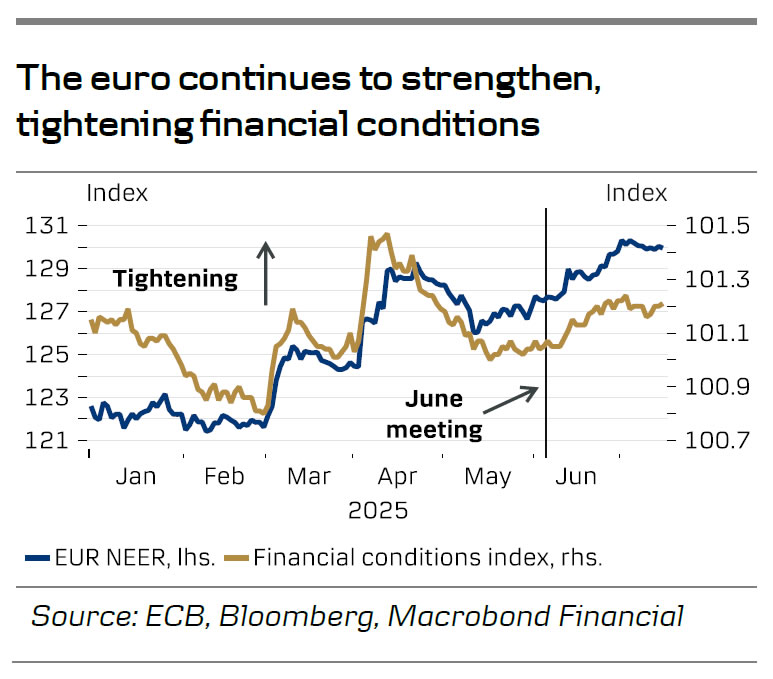
Incoming data since the June meeting has been very limited and has likely not changed the ECB’s view. We have only received one tier-1 data print, June inflation, which rose as expected to 2.0% due to energy base effects while core inflation remained at 2.3%, the latter due to a continued high momentum in services inflation. Industrial production in May rose more than expected like the German ZEW in July. Hence, data has been marginally hawkish. Market inflation expectations have also risen slightly, while financial conditions on the other hand have tightened due to rising long-term yields and the strengthening of the euro. We expect Lagarde to receive questions about the strengthening euro but downplay what it means for the ECB, although the dove camp seems more concerned about the impact on exports. By September two additional inflation prints and one PMI, the Q2 compensation per employee data and new staff projections, should make Lagarde leave the September decision open. Hence, ECB is most likely satisfied with the current market pricing, and we expect Lagarde to aim for a limited market reaction.
CADJPY Higher Timeframe Outlook – Expanding Trading Horizons
Traders are constantly seeking the next opportunity to elevate their results. A common challenge, however, is that many focus on the same popular products and patterns. So, how can one differentiate their approach?
One effective way is to explore less commonly traded Forex currency pairs.
While some might be concerned about liquidity issues with certain financial products, the Forex market is globally the most liquid.
Even the least traded major forex pairs offer ample liquidity and unique opportunities.
In today's example, let's take a look at CADJPY to spot ongoing trends and why this pair is interesting to trade.
CADJPY is a volatile minor pair that tends to move with different factors, including macroeconomic trends (generally, an appetite for risk means the pair goes higher, risk-off means the pair trades lower) and interest rate differentials—this factor has moved JPY pairs quite a lot in the past few years.
If you want to make these pairs your specialty, keep a close look at communications from both the Bank of Canada and Bank of Japan and track their own economic and inflation reports, which usually precede Central Bank rate decisions.
As a reminder, higher inflation (or inflation outlooks) tends to precede hawkish talks by Central Bank speakers, which then precede interest rate hikes.
The higher the interest rate of a currency, the more demand there is for it (as a rule of thumb, may vary) – One of the reasons why the Yen, which has maintained low rates throughout the past 20 years, has seen substantial depreciation.
About this, let's take a look at Monthly charts.
CADJPY Technical Analysis starting from Higher Timeframes
CADJPY Monthly Chart
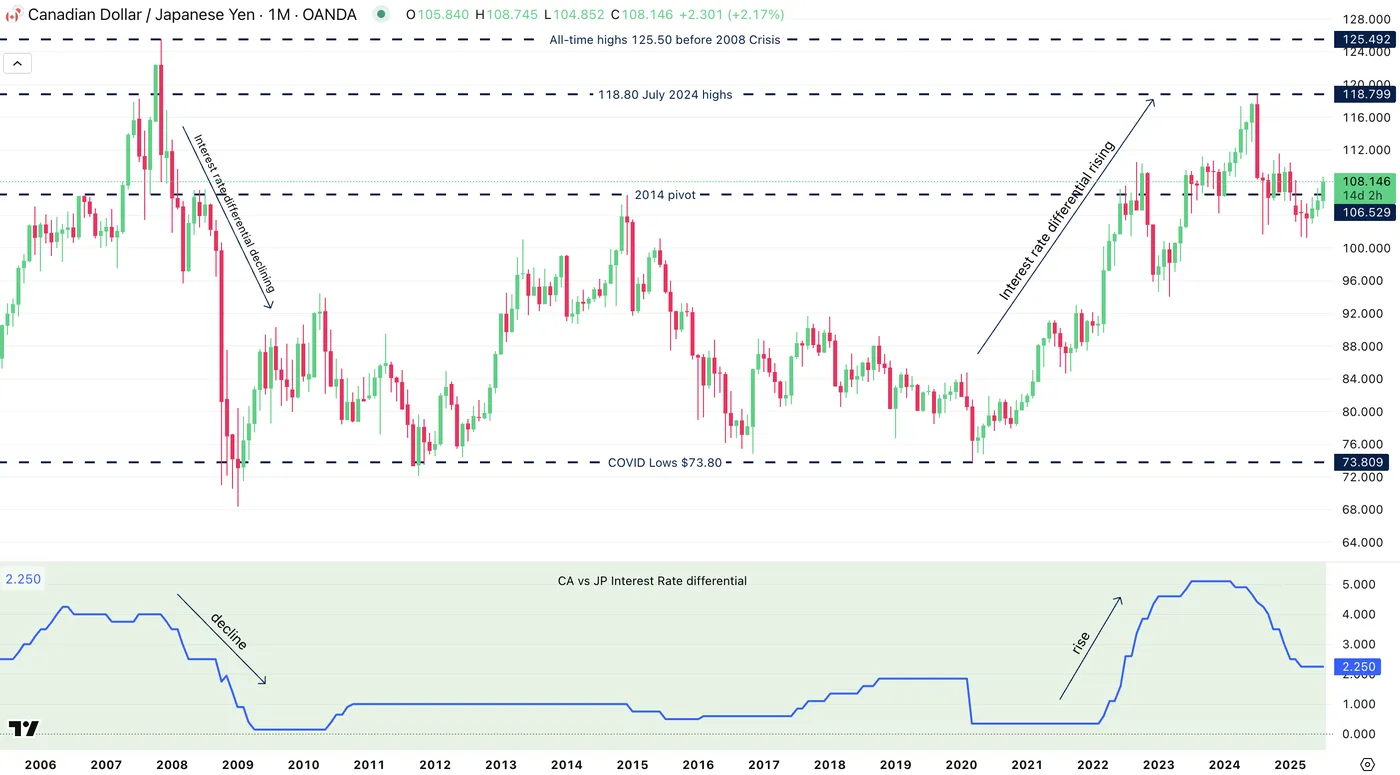
CADJPY Monthly Chart, July 17, 2025 – Source: TradingView
The pair has seen some major trends in the past 20 years, starting from a huge descent in 2008 as global Interest Rates began a significant cutting cycle to stimulate the economy post Great Financial Crisis.
The already ultra-loose Japanese Interest Rate gave the yen some relative strength.
On the other hand, when Central Banks started to hike again post COVID, the pair jumped from 73.80 to highs of 118.80, and the top was found in the pair when the 2024 cut cycle from the Bank of Canada began.
Take a look at the interest rate differentials and the price movements of the pair on the chart.
CADJPY Weekly Chart
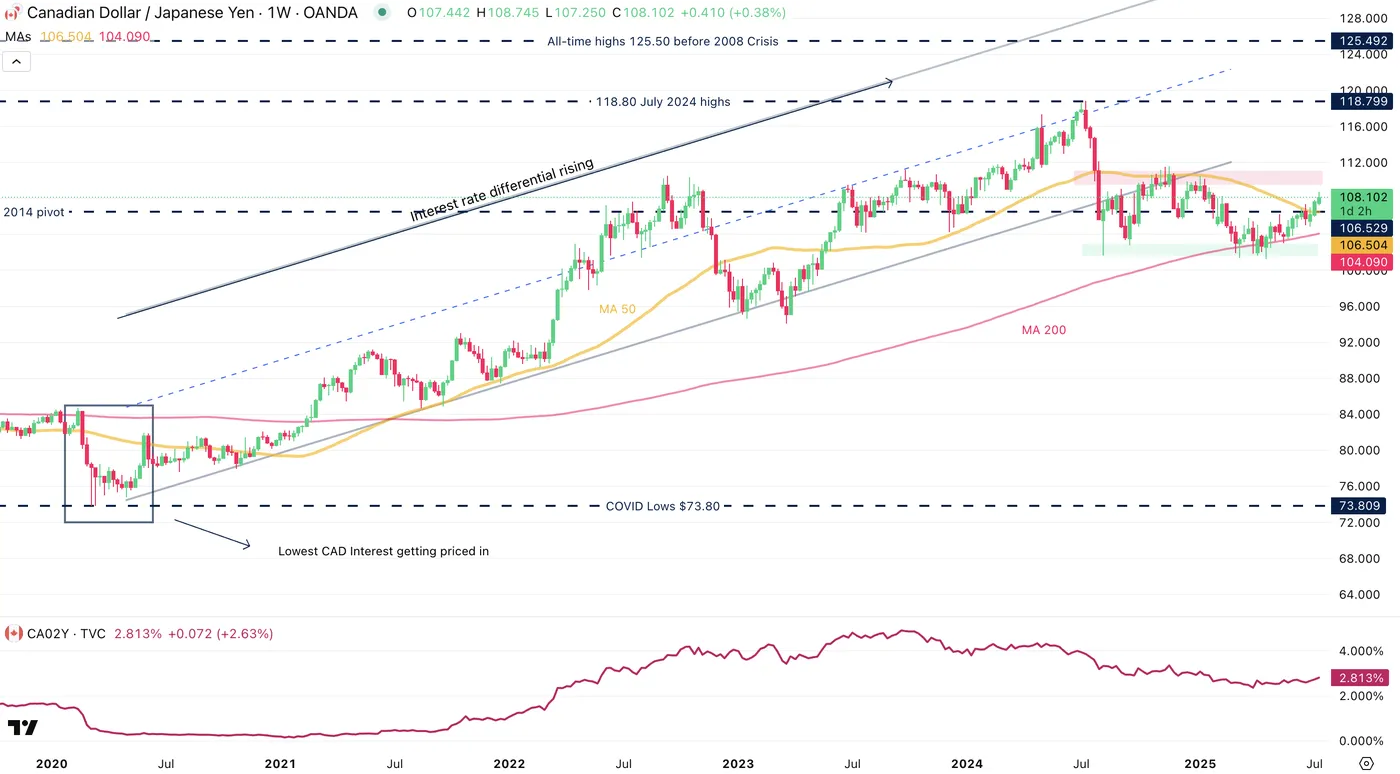
CADJPY Weekly Chart, July 17, 2025 – Source: TradingView
You can spot on the weekly chart how the expected bottom of interest rates in Canada have coincides with a bottom in CADJPY (followed by actual rise in rates) and the pair hadn't found a top until the 2Y Yield (attached below the CADJPY Chart) started to retract.
The Weekly chart also allows us to spot how rangebound the past year has been in the pair – the range extends from 104.00 Lows to 112.00 Highs.
A weekly bearish cross (Weekly MA 50 crossing the MA 200 from higher to lower) typically announces more selling momentum – However, these trends may take time to happen and may not materialize at all.
Markets are awaiting for any extra hawkishness from the Bank of Japan as Japanese inflation has been turning higher without much doing from the BoJ, hurting the yen and advantaging the CAD in the past few weeks.
CADJPY Daily Chart
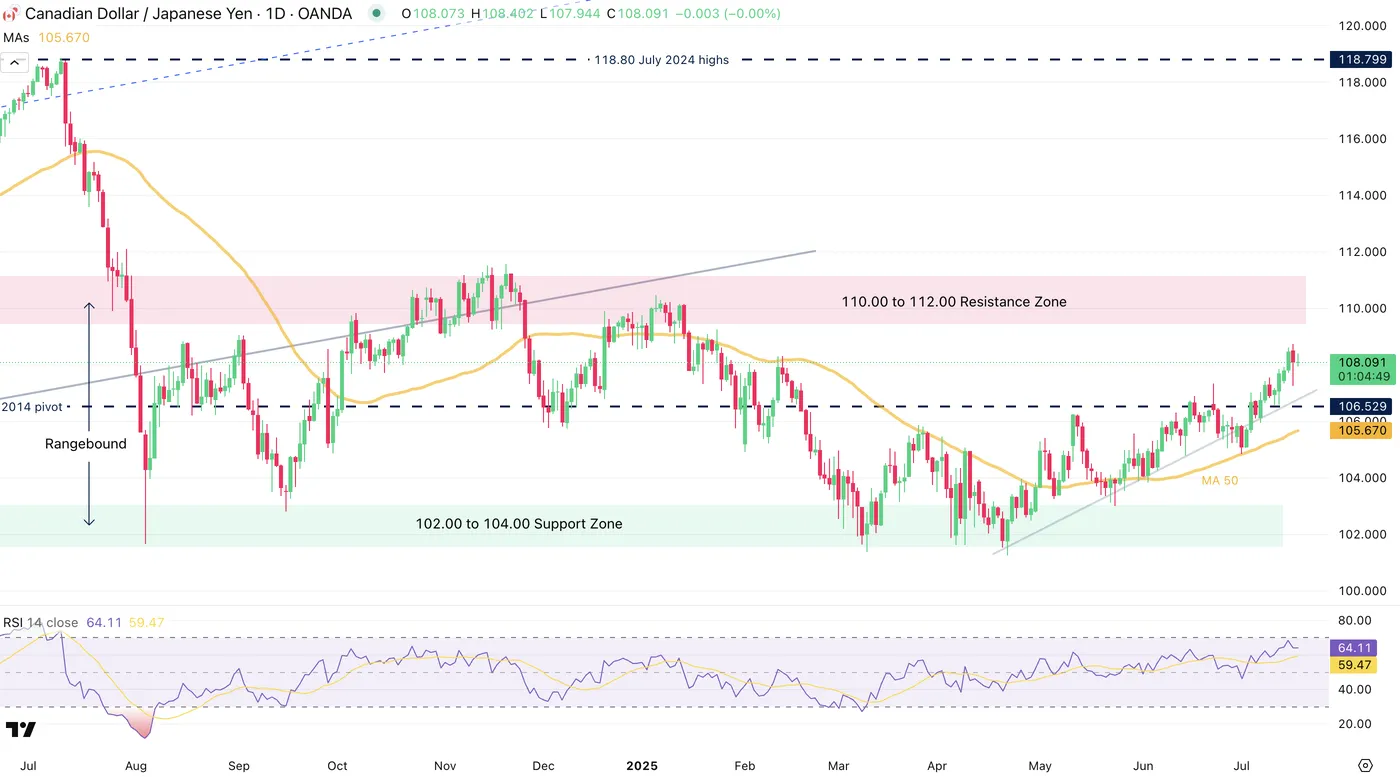
CADJPY Daily Chart, July 17, 2025 – Source: TradingView
Now looking at the daily chart, we see more details on the rangebound action as Canada's cut cycle had been fully priced in and concluded (leading to the Mid-2024 correction).
Since, markets awaiting for a move from the Bank of Japan have led to a major range between the 112.00 to 114.00 Resistance Zone to the 102.00 to 104.00 Support Zone.
Since Mid-May however, the Yen has been relatively weak vs other majors and the CAD has gained back some strength, explaining the ongoing upward trendline, further supported by the 50-Day Moving Average – A key barometer to observe as we approach the high of the range.
Watch for any break below the MA 50 to confirm the range, and any new communication from the respective Central Banks (Particularly the Bank of Japan, tonight will see the release of their Inflation numbers)
Safe Trades!
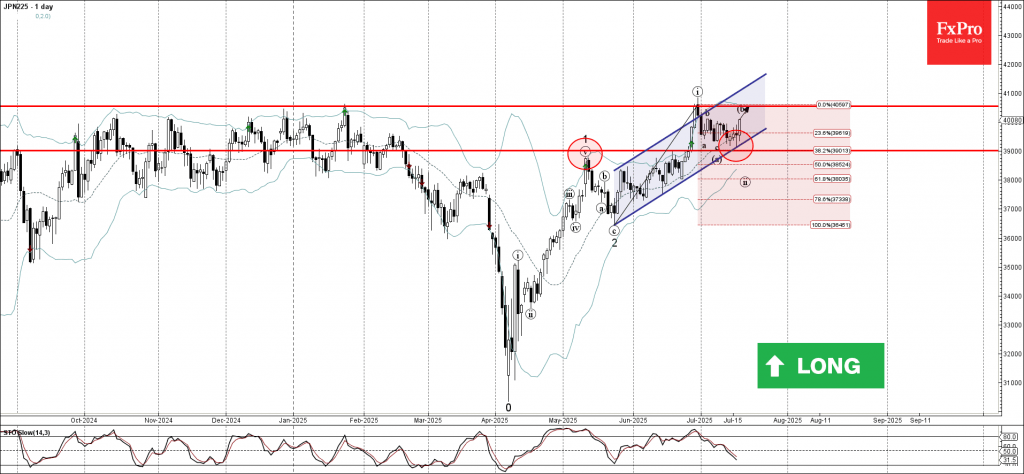
Nikkei 225 Wave Analysis
Nikkei 225: ⬆️ Buy
- Nikkei 225 rever
- stance level 40550.00
Nikkei 225 index recently reversed up with the daily Doji from the support area located between the key support level 39000.00 (former resistance from May) and the support trendline of the daily up channel from May.
This support area was further strengthened by the 38.2% Fibonacci correction of the sharp upward impulse i from May.
Given the strong daily uptrend and the improved sentiment across global equity markets, Nikkei 225 index can be expected to rise to the next resistance level 40550.00 (former multi-month high from January).
Fed’s Kugler sees more tariff inflation coming, favors holding steady for some time
Fed Governor Adriana Kugler said she favors keeping interest rates unchanged "for some time," citing a resilient labor market and rising inflation pressures from tariffs.
In a speech today, she noted that both headline and core inflation "have shown no progress in the last six months". Instead, this week's CPI and PPI report showed core goods prices are now driving inflation higher, "partially reflecting the pass-through of increased tariffs". Kugler said she expects inflation to accelerate further through the second half of 2025 as "larger effects of tariffs are still coming".
While acknowledging some moderation in broader economic activity, Kugler emphasized that the labor market remains stable and near full employment. She also flagged geopolitical risks as a potential wildcard for inflation in the months ahead.
EURUSD at a Tipping Point
The most traded Forex pair hasn't disappointed traders in terms of trends and volatility throughout 2025.
Going from 1.02 to 1.18 highs in 7 months, there had been some decisive momentum to participate with as this strong buying took the Euro to highs unseen since 2021.
The geopolitical mishandles from the Trump Administration earlier this year had led to European leaders putting back the Euro unification back on the table. After some major deals were announced from Germany and other Euro Nations, the Euro started its ascent. to up 15% on the year at one point.
This theme got accompanied with general lack of confidence from the Trump Administration which led to some major US Dollar selling and financial flows rewiring.
But, it seems today that markets are taking profits on these trends, leading to some intermediate tops in the Pair currently – Let's take a look at EURUSD Technicals to spot if there is any elements to help us see if the flows have really shifted or not.
EURUSD Multi-Timeframe analysis going from the Daily to 1H Charts
EURUSD Daily
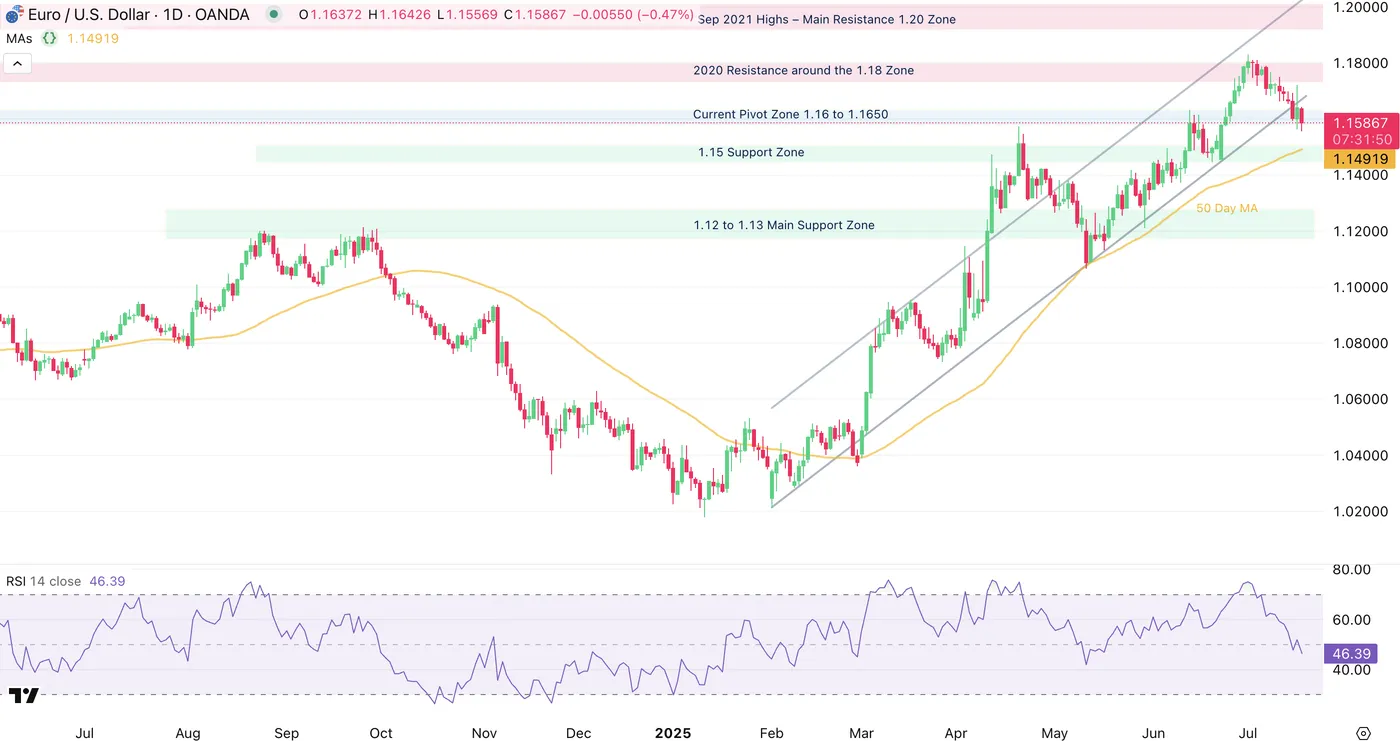
EUR/USD Daily Chart, July 17, 2025 – Source: TradingView
The Israel-Iranwar consolidation in the pair had led to a major relief rebound towards the 1.1830 2025 Highs in a strong fashion – from 1.1450 to the highs in 7 consecutive bull candles (Tight bull channel).
However, since July 1st, all currencies have found some of their strength against the US Dollar taken back and the Euro hasn't been an exception.
Almost all daily candles have been red since that day and prices are close to back to pre-end-of-war levels – Momentum just fell below the mid-line, indicating some seller strength which will have to decisively breach below. the 50-Day Moving average to regain more control.
Higher timeframe levels to keep an eye on:
Resistance Levels:
- Current Pivot Zone 1.16 to 1.1650
- 2020 Resistance around the 1.18 Zone (2025 Highs)
- Sep 2021 Highs – Main Resistance 1.20 Zone
Support Levels:
- 1.15 Support Zone (Confluence with 50-Day MA)
- 1.12 to 1.13 Main Support Zone
- 1.10660 Last major pivot to the upside
EURUSD 4H
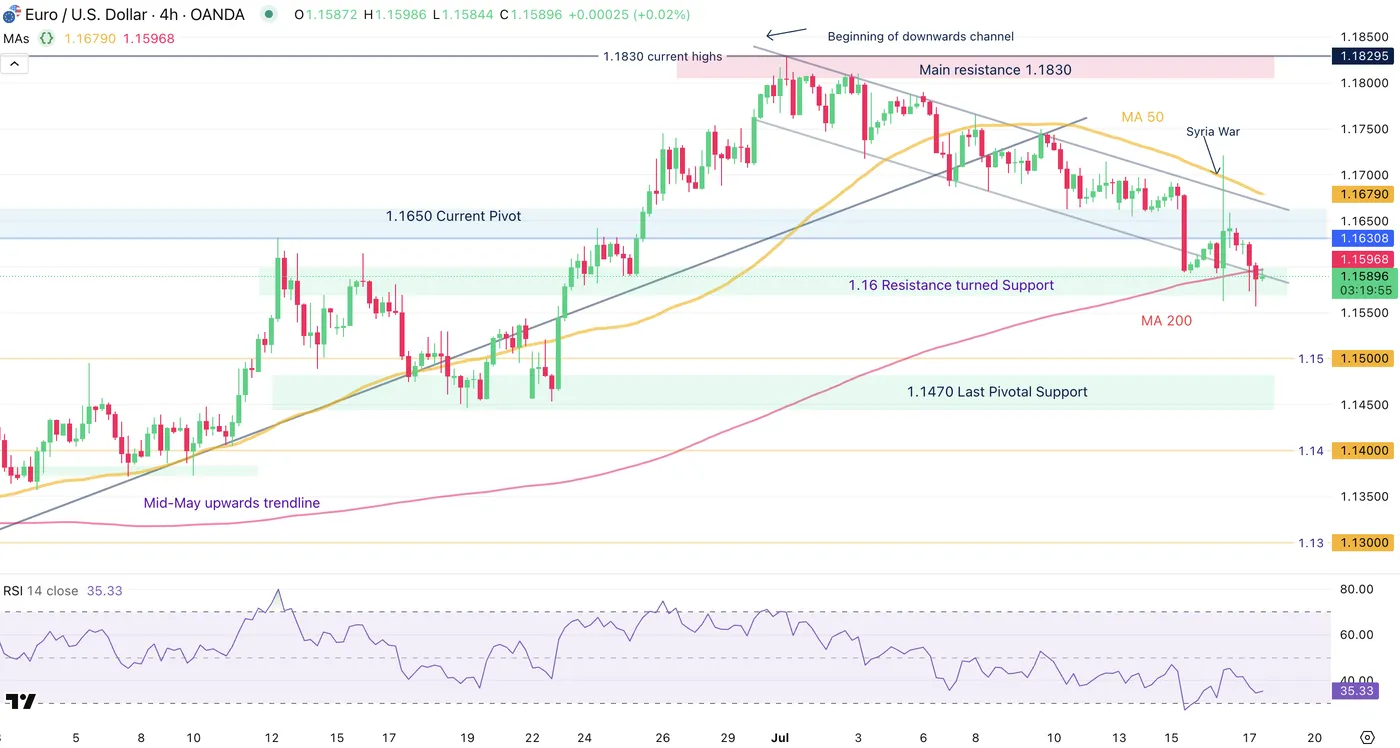
EUR/USD 4H Chart, July 17, 2025 – Source: TradingView
Looking closer allows to observe the current ongoing descending downwards channel were prices have trended down with some regularity but the move is currently stalling as markets approach oversold levels.
Prices are currently evolving between the 50 and 200 4H Moving Averages as buyers held the 1.16 Support Zone (smaller timeframe support) to bid the Pair during the past day Syria War headlines.
Monitor closely any decisive break below the 200 MA that is currently holding prices – We are currently trading just below that indicator but we would require a stronger move to assume more bearishness.
In the meantime, there is a somewhat high probability to retest the high of the range that revisits the 50 MA at the same time around 1.1678 but prices will first have to cross the 1.1620 to 1.1650 Pivot Zone.
EURUSD 1H
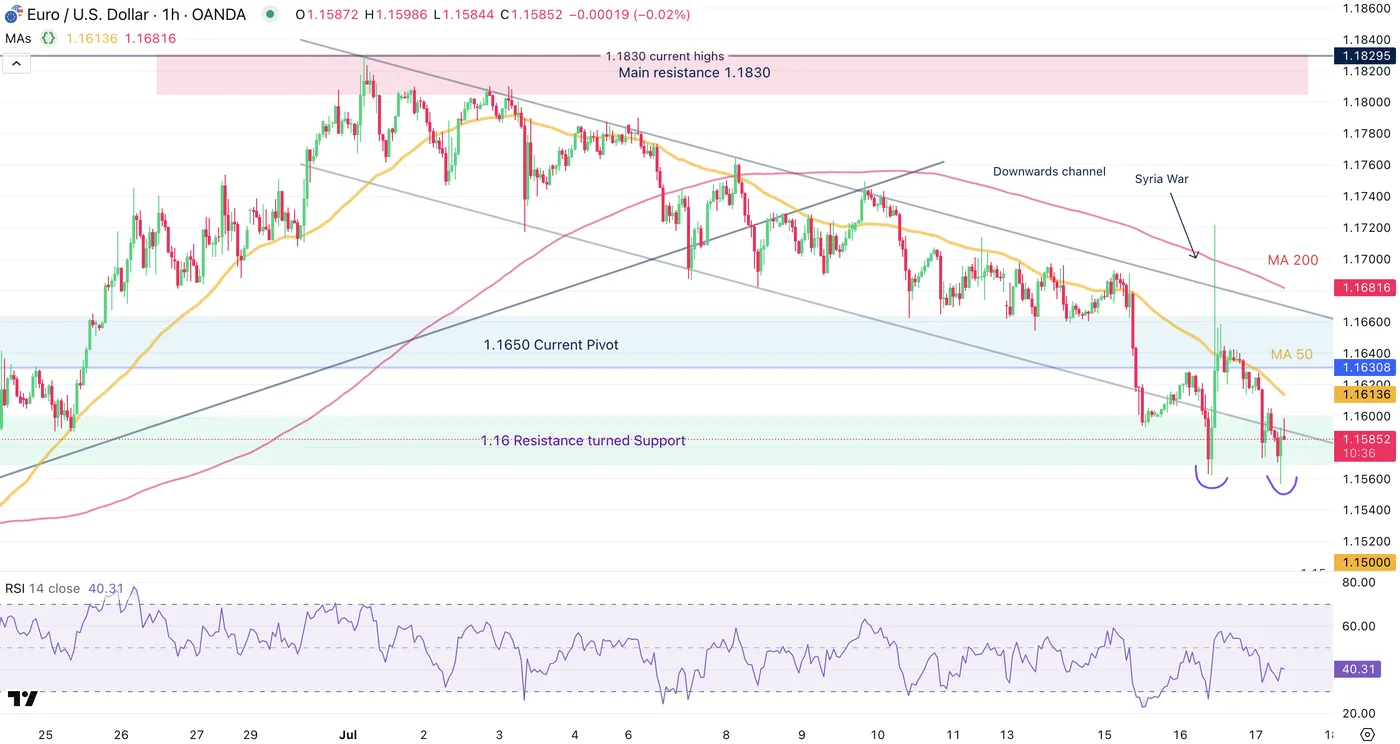
EUR/USD 1H Chart, July 17, 2025 – Source: TradingView
The ongoing session has begun with a double bottom right at the bottom of the 1.16 Support Zone (1.1560).
Anyways, buyers will still have to breach back into the downwards channel (which has been broken out overnight – coincides with the 1.16 psychological Level) to avoid a further bearish continuation.
Take a look at reactions at the low of the channel, the 1H MA 50 and the 1.1650 Pivot Zone if prices do get there.
Safe Trades!
US Retail Sales Shine, Dollar-Yen Jumps, Japan Inflation Expected to Ease
The Japanese yen continues to have a busy week, with strong movement in both directions. In the North American session, USD/JPY is trading at 148.53, up 0.45% on the day. On Wednesday, USD/JPY strengthened to 149.18, its highest level since March.
US retail sales surprise with 0.6% gain
US retail sales have been in the doldrums of late, posting declines in April and May as consumers reacted with a thumbs-down to President Trump's tariffs, which took effect in April and made imported goods more expensive.
The markets had anticipated a marginal gain of just 0.1% m/m in June but retail sales came in at an impressive 0.6%, bouncing back from -0.9% in May. Most sub-categories recording stronger activity in June.
The US tariffs appear to have had a significant impact on retail sales, as consumers continue to time their purchases to minimize the effect of tariffs.
Consumers increased spending ahead of the tariffs and cut back once the tariffs went into effect. With a truce in place between the US and China which has slashed tariff rates, consumers opened their wallets and purchased more on big-ticket items such as motor vehicles, which jumped 1.2% in June.
With Trump threatening new rounds of tariffs against allies such as Canada and Japan on August 1 if no agreements are reached, it will be interesting to see if consumer spending reverses direction next month.
Japan's inflation rate expected to ease
This week, the US and UK posted higher inflation numbers for June, but Japan is not expected to follow suit. Headline inflation is projected to drop to 3.3% y/y from 3.7% in May and core CPI, which is closely watched by the Bank of Japan, is expected to drop to 3.3% from 3.5%. If inflation is higher than expected, it will raise expectations for a rate hike from the BoJ in the fourth quarter.
USDJPY Technical
- There is resistance at 148.00 and 149.08
- 146.80 and 145.72 are providing suppport
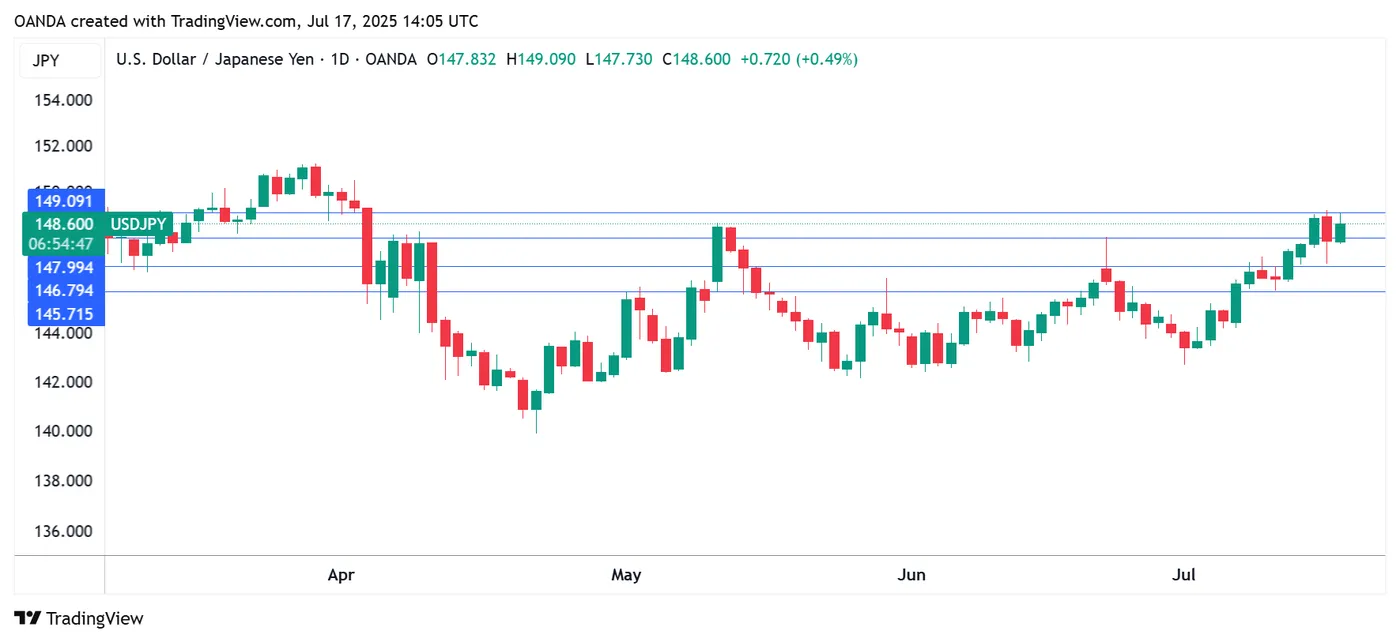
USDJPY Technical 1-Day, July 17, 2025