Sample Category Title
Pound Continues to Decline, with Little Support from the Bank of England
The GBP/USD pair has slowed its decline, stabilising near 1.3391.
On the previous day, Bank of England Governor Andrew Bailey addressed key global economic challenges in a speech at Mansion House. He described the latest wave of trade tariffs as a systemic event capable of reshaping global trade dynamics. Bailey highlighted growing domestic imbalances in the US and weak domestic demand in China, urging both nations to clarify their strategies for addressing these issues.
However, Bailey clarified that not all trade imbalances are inherently problematic – many stem from productivity disparities between nations. Yet, he warned that widening macroeconomic and political divergences are increasing systemic fragility. Recent developments, he added, have exposed weaknesses in multilateral cooperation and a failure to tackle emerging challenges effectively.
The Governor also stressed the International Monetary Fund’s (IMF) role in mitigating global imbalances, calling for more proactive international institutions. He attributed distortions primarily to domestic economic policies, cautioning that without reform, global financial stability could be at risk.
While current imbalances remain manageable by historical standards, Bailey warned against complacency. A comprehensive reassessment of policy approaches is essential to ensure the stability and predictability of the financial system.
Technical Analysis: GBP/USD
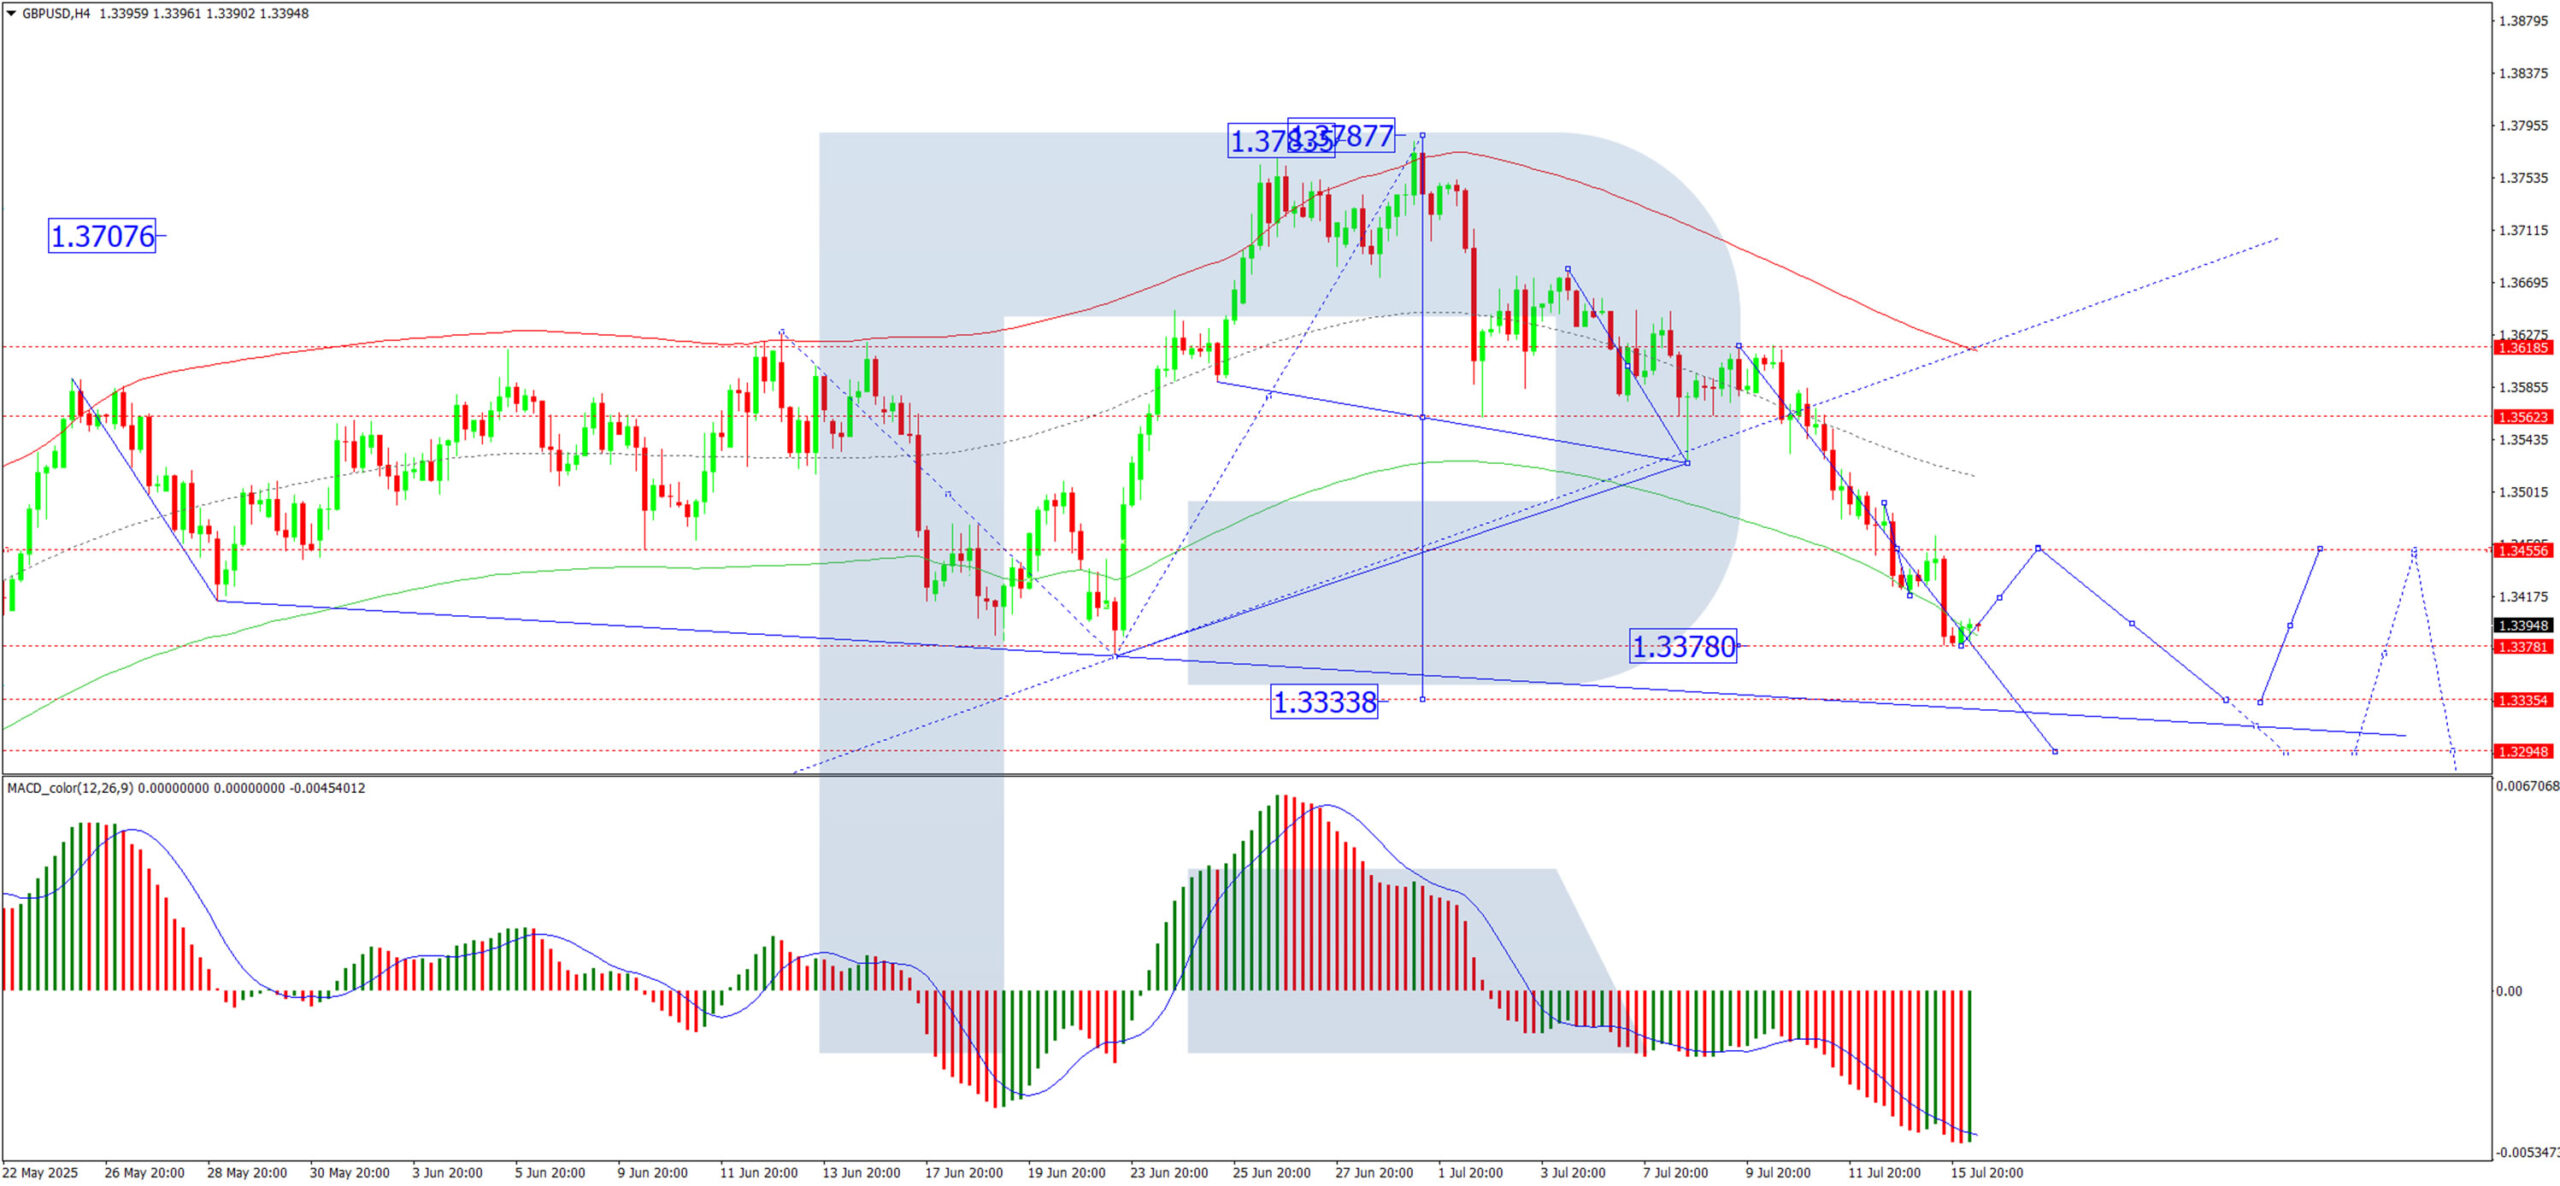
H4 Chart:
On the H4 chart, the GBP/USD pair has declined to the 1.3450 level, where a consolidation range has now formed. The pair has broken out to the downside, reaching 1.3378. Today, a short-term rebound to 1.3415 (as a retest from below) is possible. However, if resistance holds, the pair may resume its decline towards 1.3296. Upon completion of this downward wave, a potential bounce towards 1.3450 could follow. Technically, this scenario is confirmed by the MACD indicator, whose signal line is below zero and pointing firmly downward.
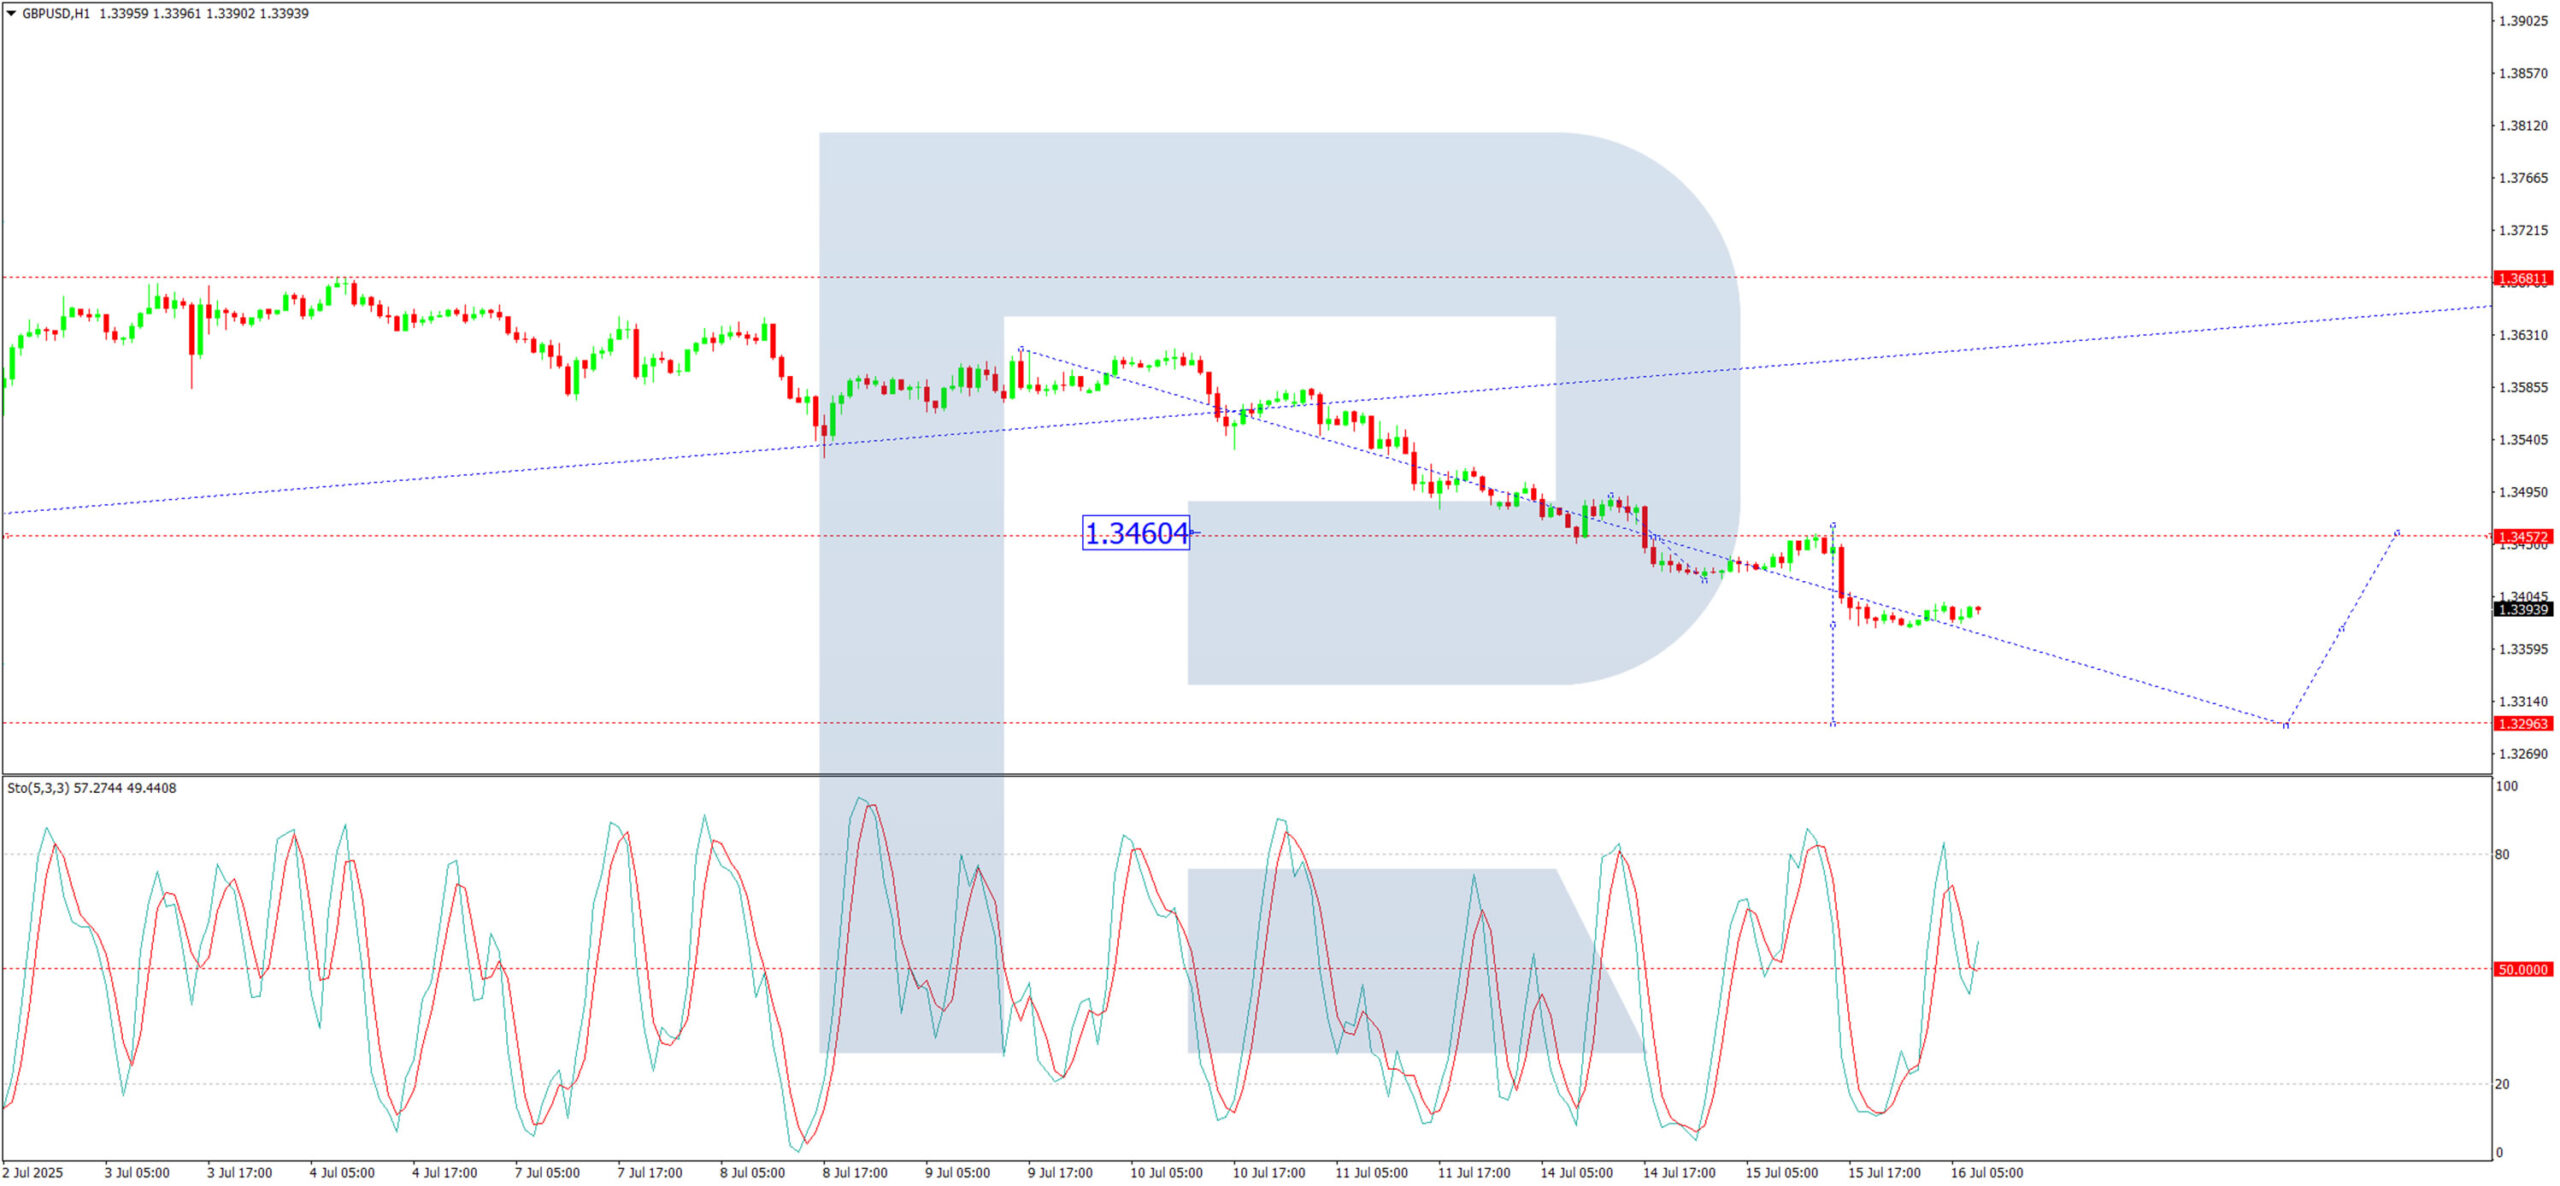
H1 Chart:
On the H1 chart, the GBP/USD pair is extending the third wave of its decline, with a local target at 1.3296. Once this level is reached, a correction towards 1.3460 could unfold. Technically, this scenario is supported by the Stochastic oscillator, with its signal line below 80 and trending sharply downwards towards 20.
Conclusion
Bearish momentum persists, with key support levels in focus. A short-term pullback remains possible, but the broader downtrend is likely to continue unless a significant shift in fundamentals occurs.
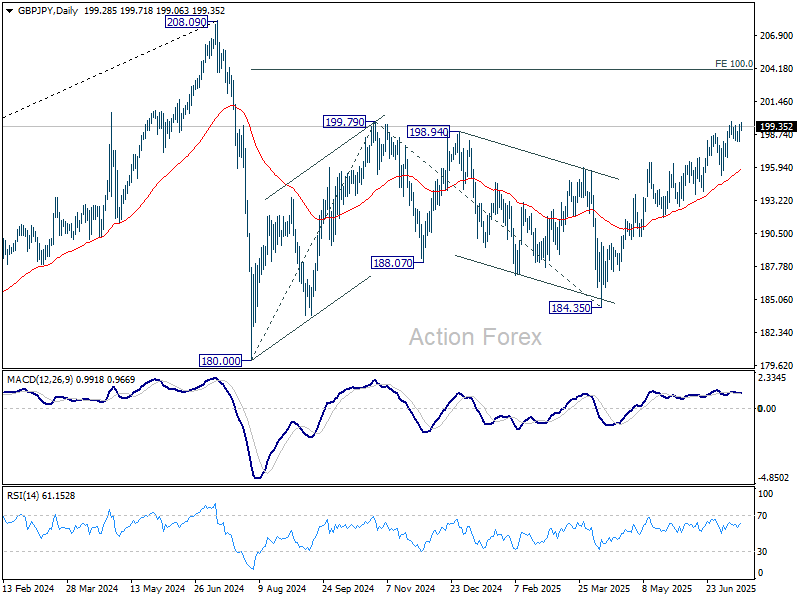
GBP/JPY Daily Outlook
Daily Pivots: (S1) 198.44; (P) 198.99; (R1) 199.76; More...
GBP/JPY is staying in range below 199.80 and intraday bias remains neutral. Some more consolidations could be seen first. While deeper retreat cannot be ruled out, further rise is expected as long as 195.33 support holds. On the upside, break of 199.80 will resume the rally from 184.35 and target 100% projection of 180.00 to 199.79 from 184.35 at 204.14.
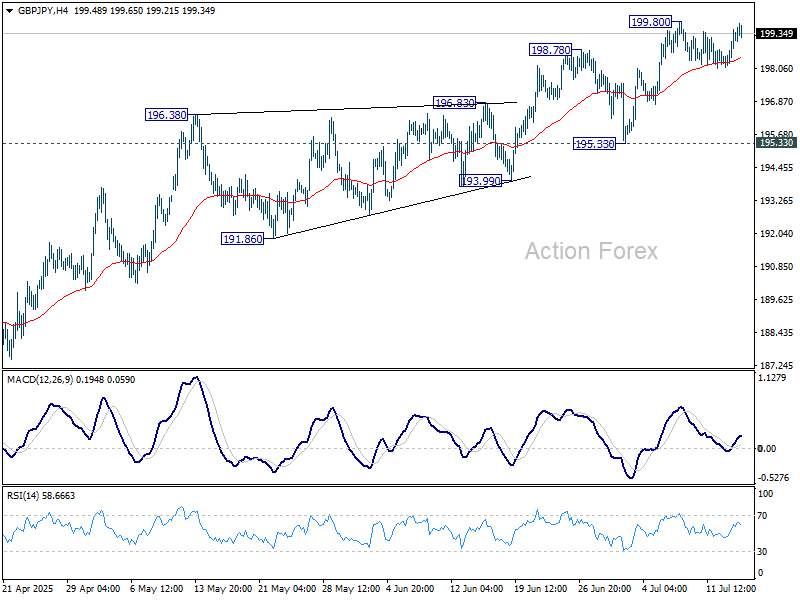
In the bigger picture, price actions from 208.09 (2024 high) are seen as a correction to rally from 123.94 (2020 low). The pattern might still extend with another falling leg. But in that case, strong support should be seen from 38.2% retracement of 123.94 to 208.09 at 175.94 to contain downside. Meanwhile, decisive break of 208.09 will confirm long term up trend resumption.
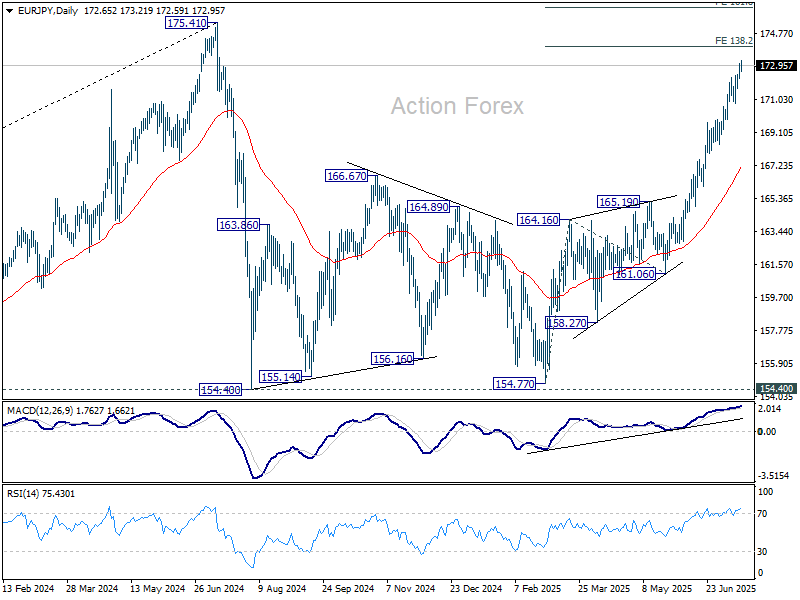
EUR/JPY Daily Outlook
Daily Pivots: (S1) 172.25; (P) 172.66; (R1) 173.12; More...
Intraday bias in EUR/JPY remains on the upside as rise from 154.77 is in progress. Next target is 138.2% projection of 154.77 to 164.16 from 161.06 at 174.03. On the downside, below 170.78 support will turn intraday bias neutral and bring consolidations first.
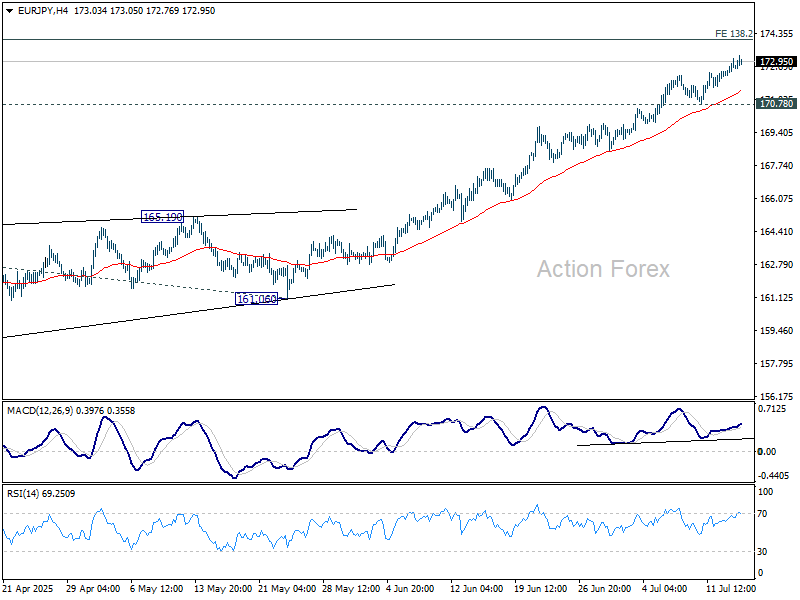
In the bigger picture, price actions from 175.41 (2024 high) are seen as correction to up trend from 114.42 (2020 low). The pattern might still extend with another falling leg. But in that case, strong support should be seen from 38.2% retracement of 114.42 to 175.41 at 152.11 to contain downside. Meanwhile, decisive break of 175.41 will confirm long term up trend resumption.
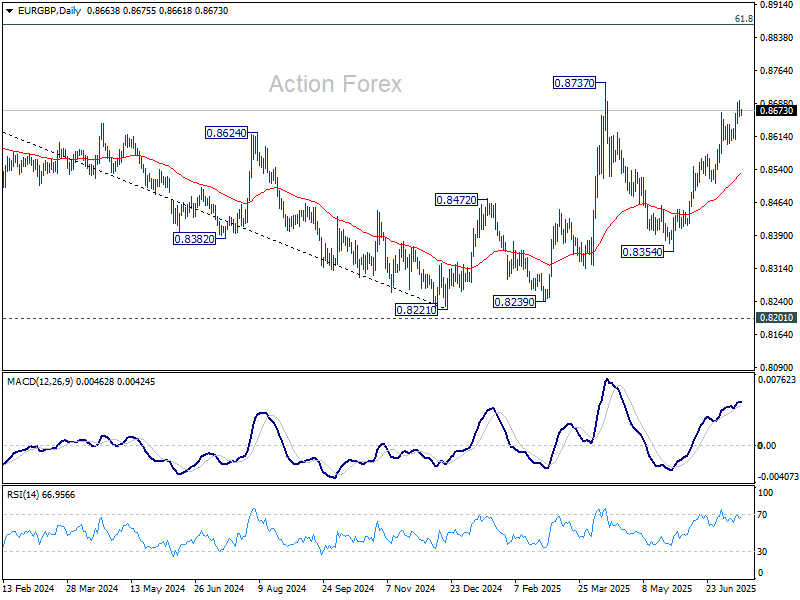
EUR/GBP Daily Outlook
Daily Pivots: (S1) 0.8654; (P) 0.8675; (R1) 0.8690; More...
Intraday bias in EUR/GBP is turned neutral first with current retreat. Further rise is expected as long as 0.8607 support holds. Above 0.8695 will target 0.8737 high. Decisive break there will resume the whole rise from 0.8221 low, and target 0.8867 fibonacci level. Nevertheless, considering bearish divergence condition in 4H MACD< firm break of 0.8607 will argue that rebound from 0.8354 has completed, and turn bias back to the downside for 55 D EMA (now at 0.8528).
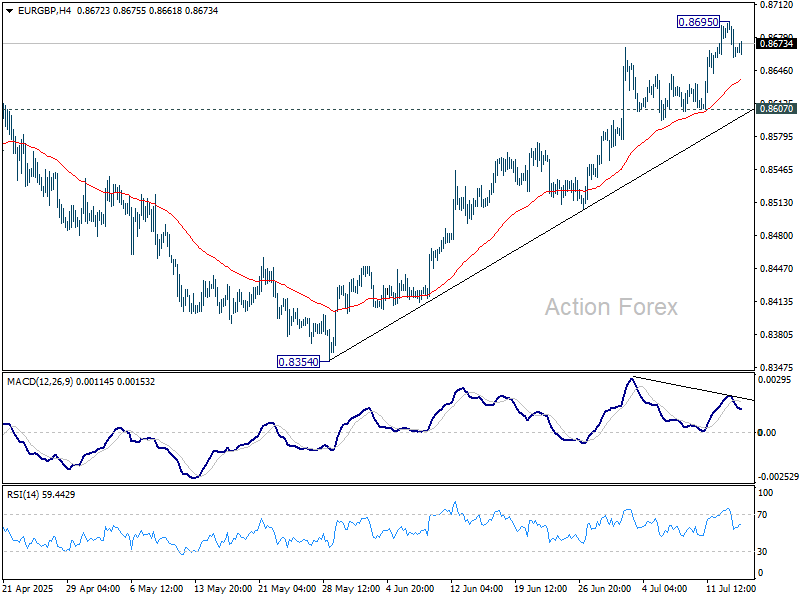
In the bigger picture, the structure from 0.8221 medium term bottom are not impulsive enough to suggest that it's reversing the down trend from 0.9267 (2022 high). But even if it's a correction, firm break of 0.8737 will still pave the way to 61.8% retracement of 0.9267 to 0.8221 at 0.8867.
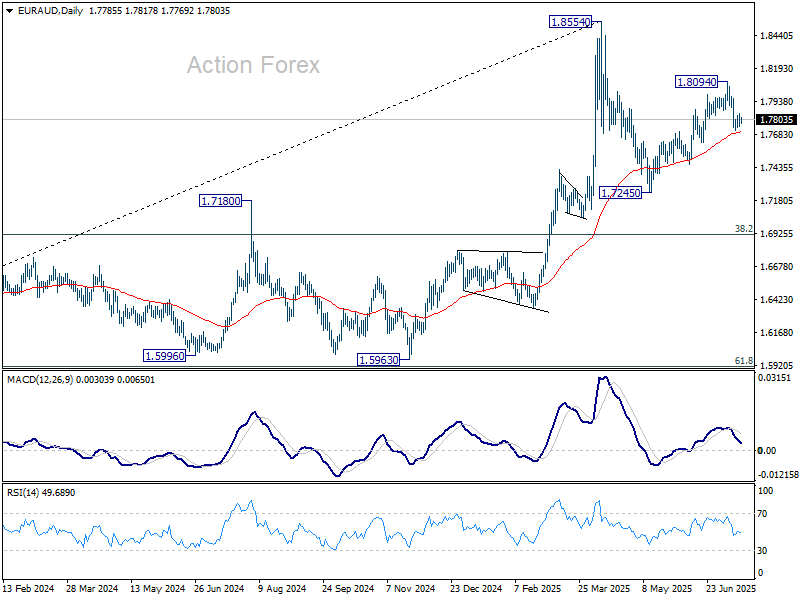
EUR/AUD Daily Outlook
Daily Pivots: (S1) 1.7757; (P) 1.7809; (R1) 1.7863; More...
EUR/AUD is extending consolidations above 1.7717 temporary low and intraday bias remains neutral. On the downside, sustained trading below 55 D EMA (now at 1.7703) will argue that corrective pattern from 1.8554 is already in the third leg. Deeper fall should then be seen back to 1.7245 support. Nevertheless, strong rebound from 55 D EMA will maintain near term bullishness. Break of 1.7872 support turned resistance will bring retest of 1.8094 resistance.
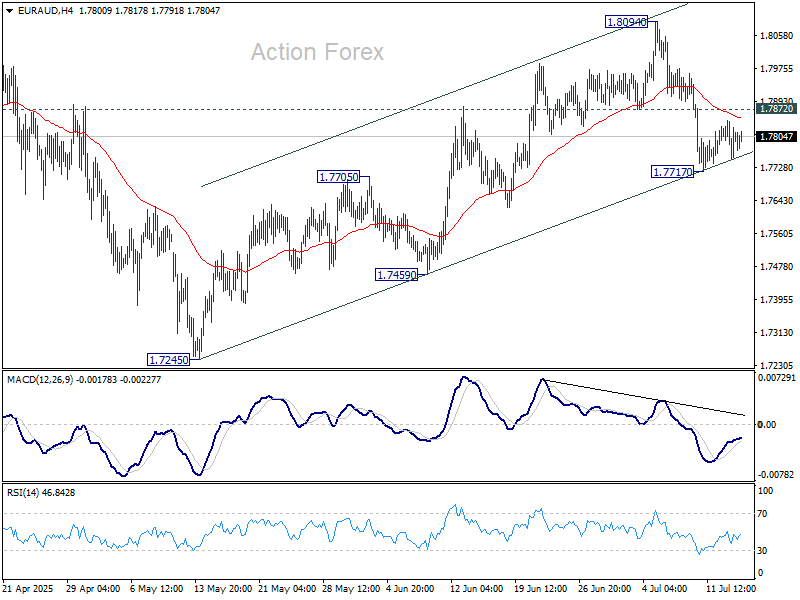
In the bigger picture, price actions from 1.8554 medium term are seen as a corrective pattern. While deeper pullback might be seen, downside should be contained by 38.2% retracement of 1.4281 (2022 low) to 1.8554 at 1.6922 to bring rebound. Up trend from 1.4281 is expected to resume at a later stage.
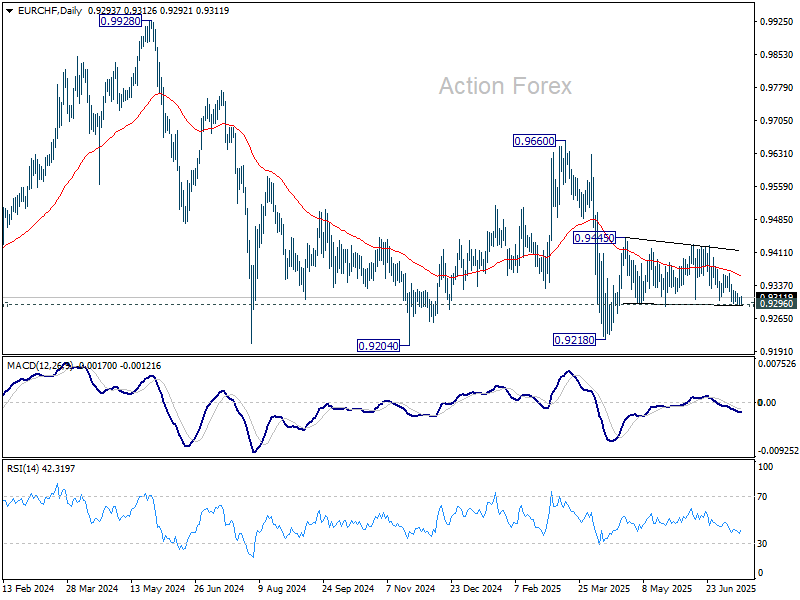
EUR/CHF Daily Outlook
Daily Pivots: (S1) 0.9292; (P) 0.9302; (R1) 0.9311; More....
Intraday bias in EUR/CHF stays neutral at this point. On the upside, break of 0.9428/45 resistance zone will resume the rebound from 0.9218. On the downside, firm break of 0.9296 support will bring retest of 0.9218 low instead.
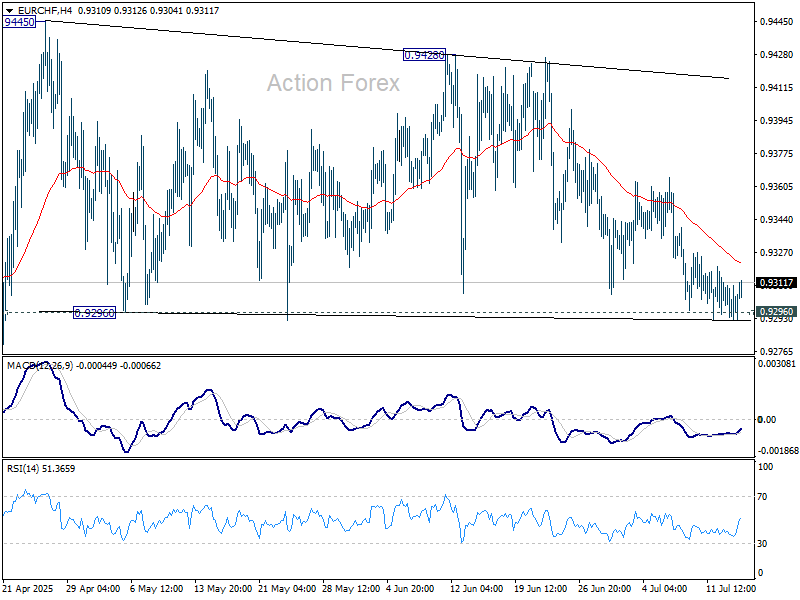
In the bigger picture, while downside momentum has been diminishing as seen in W MACD, there is no sign of bottoming yet. EUR/CHF is still staying below 55 W EMA (now at 0.9437) and well inside long term falling channel. Outlook will stay bearish as long as 0.9660 resistance holds. Break of 0.9204 (2024 low) will confirm resumption of down trend from 1.2004 (2018 high).
EUR/USD Analysis: US Dollar Strengthens Following Inflation Report
Yesterday, the US Consumer Price Index (CPI) report was released, showing an increase in consumer prices. According to Forex Factory, annual CPI rose from 2.4% to 2.7%, exceeding analysts' expectations of a 2.6% rise.
As reported by Reuters, the data supports the stance of Federal Reserve Chair Jerome Powell, who has repeatedly stated that the anticipated inflationary pressure—driven in part by tariffs—is a reason to refrain from further interest rate cuts.
However, President Donald Trump interpreted the data differently. On his Truth Social platform, he posted that consumer prices remain low and called for an immediate rate cut.
The market responded with a stronger US dollar—indicating that participants believe interest rates are likely to remain at current levels in the near term. Notably, the EUR/USD exchange rate fell to the 1.1600 level for the first time since late June (as indicated by the arrow).
Technical Analysis of the EUR/USD Chart
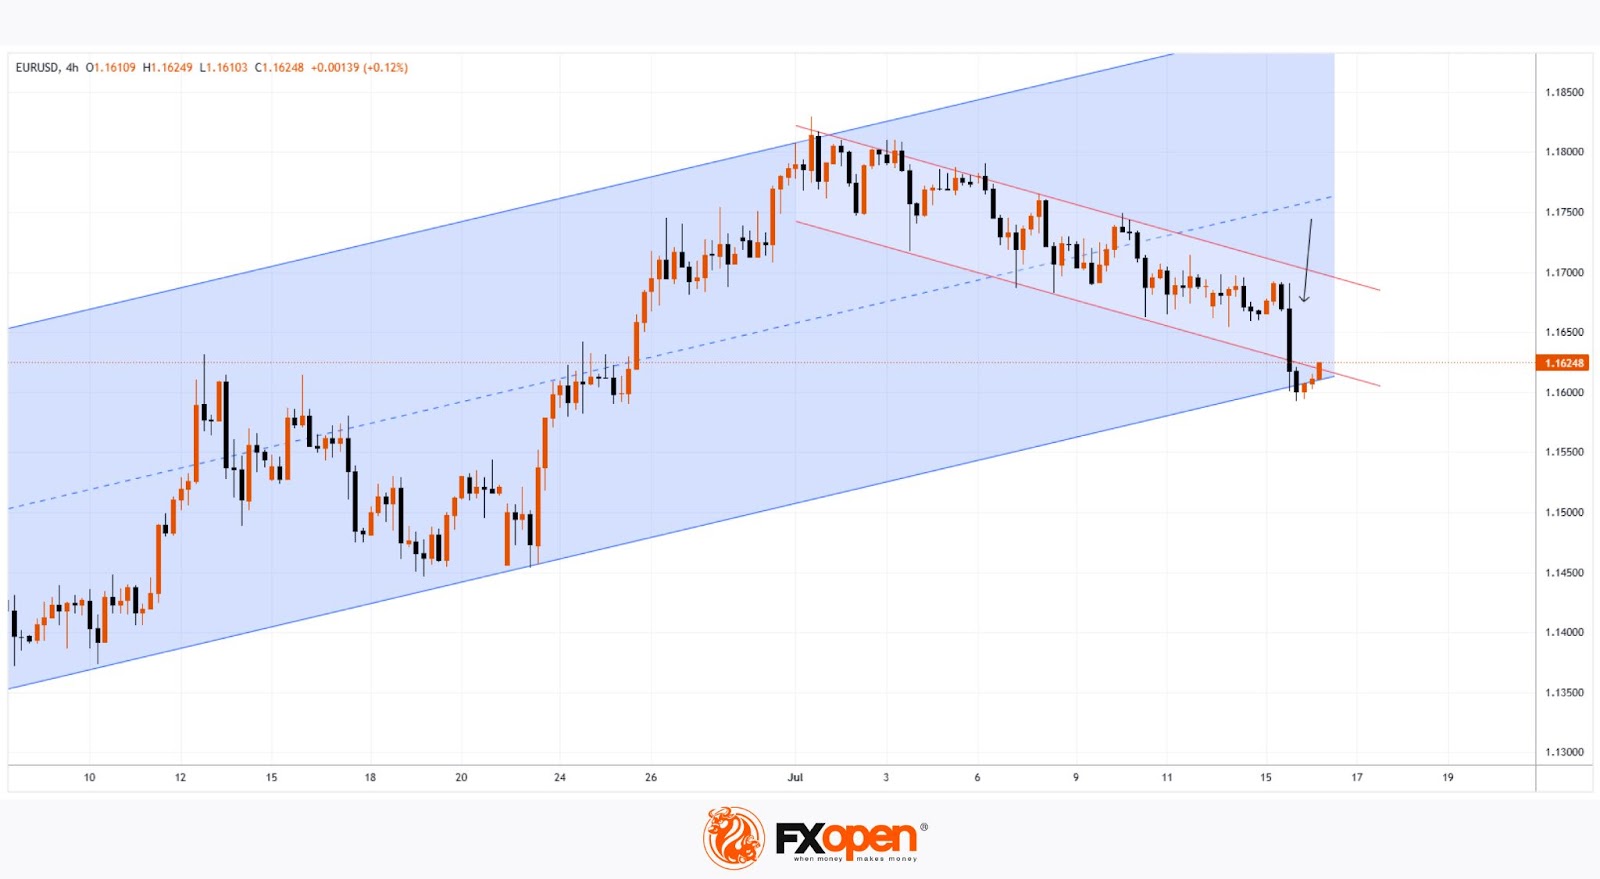
Analysing the EUR/USD chart as of 7 July, we identified:
→ A long-term ascending channel
→ A potential downward trajectory (marked by red lines)
Since then, the pair has followed the outlined path and declined by more than 1%.
It is worth noting that today, the EUR/USD price is near the lower boundary of a key trend channel, which may offer significant support — traders may look for a technical rebound from this level.
Additionally, attention should be paid to the upcoming release of the US Producer Price Index (PPI) at 15:30 GMT+3. These figures carry particular weight in light of potential renewed inflationary pressures. This and other upcoming data may prove decisive for the near-term direction of EUR/USD.
Trade over 50 forex markets 24 hours a day with FXOpen. Take advantage of low commissions, deep liquidity, and spreads from 0.0 pips. Open your FXOpen account now or learn more about trading forex with FXOpen.
This article represents the opinion of the Companies operating under the FXOpen brand only. It is not to be construed as an offer, solicitation, or recommendation with respect to products and services provided by the Companies operating under the FXOpen brand, nor is it to be considered financial advice.
Asia Stocks Resilient, Gold Rebounds, Nasdaq 100 at Risk of Bearish Reversal
All major US indices closed lower on Tuesday, 15 July, except for the Nasdaq 100, which rose 0.1% thanks to Nvidia’s continued strength. The S&P 500 hit a fresh intraday all-time high of 6,302 early in the session but reversed gains to end down 0.4%. Small caps were hit hardest, with the Russell 2000 falling 2%, while the Dow Jones Industrial Average lost 1%.
Disappointing earnings also weighed on sentiment. JP Morgan declined 0.7%, Wells Fargo plunged 5.5%, and BlackRock slid 5.9% after reporting Q2 results. The Dow underperformed due to its higher exposure to financials.
Sticky inflation signals stall Fed rate cut hopes and lift the US dollar
US June CPI data came in marginally cooler than expected (core CPI at 2.9% y/y vs. 3% forecast). However, tariff-related inflation fears resurfaced due to sharp monthly gains in categories like household furnishings (+1%), video/audio equipment (+1.1%), and toys (+1.8%), the steepest monthly increases in years.
The CME FedWatch tool now shows the probability of a September rate cut falling to 57%, down from as high as 70% a week ago. The Fed’s more cautious outlook helped boost the US dollar, with the Dollar Index rising for a fourth straight day (+0.6%) to a three-week high of 98.79, just shy of its 50-day moving average (98.90), a key intermediate resistance level.
Asia stock markets are resilient on positive US-China tariff rhetoric
Despite global headwinds, most Asia Pacific markets remained resilient today. Hong Kong’s Hang Seng Index rose 0.3%, marking its fifth straight gain and reaching a four-month high. Singapore’s Straits Times Index extended its record-breaking streak, climbing 0.2% to a fresh all-time intraday high of 4,129, its eighth consecutive day of gains.
The optimism was further reinforced by comments from US Treasury Secretary Scott Bessent, who signalled that US-China trade talks were progressing positively. He suggested that the 12 August tariff deadline was “flexible,” easing investor fears of an immediate escalation.
Gold holds key support despite strong dollar, rebounds on stagflation fears
Gold (XAU/USD) saw only a mild pullback on Tuesday, falling 0.6% before stabilizing at its 50-day moving average (US$3,328), which acted as key support. In today’s Asia session, the precious metal rebounded 0.5% intraday. The bounce was fuelled by stagflation concerns as inflation pressures persist alongside signs of economic softening.
Economic data releases
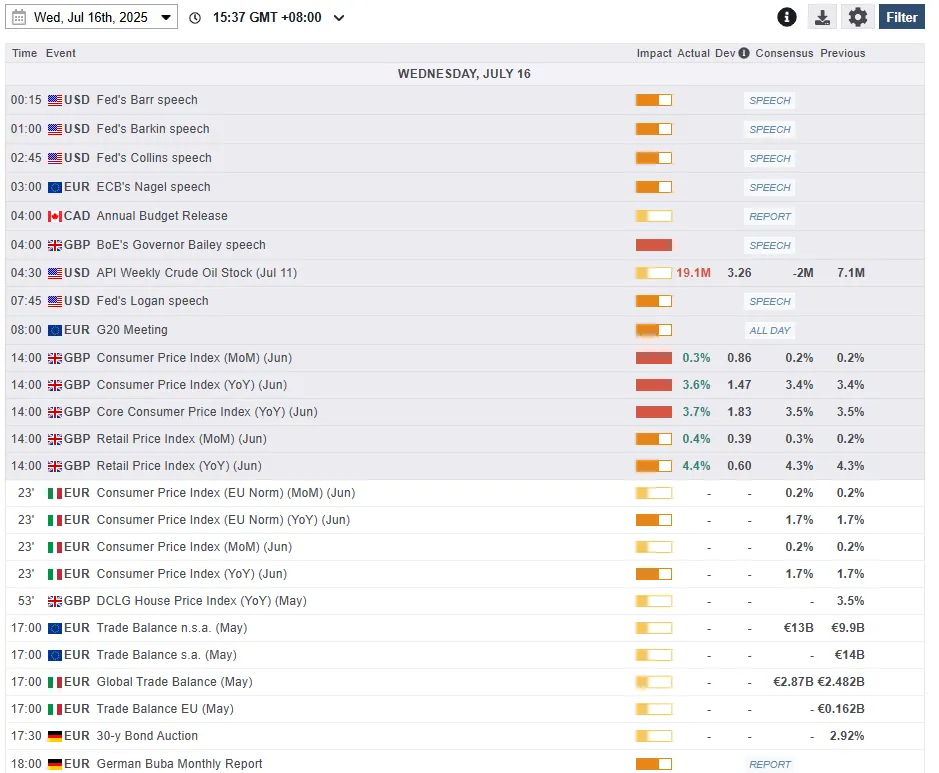
Fig 1: Key data for today’s Asia mid-session (Source: MarketPulse)
Chart of the day – Nasdaq 100 on the brink of shaping a potential minor corrective decline
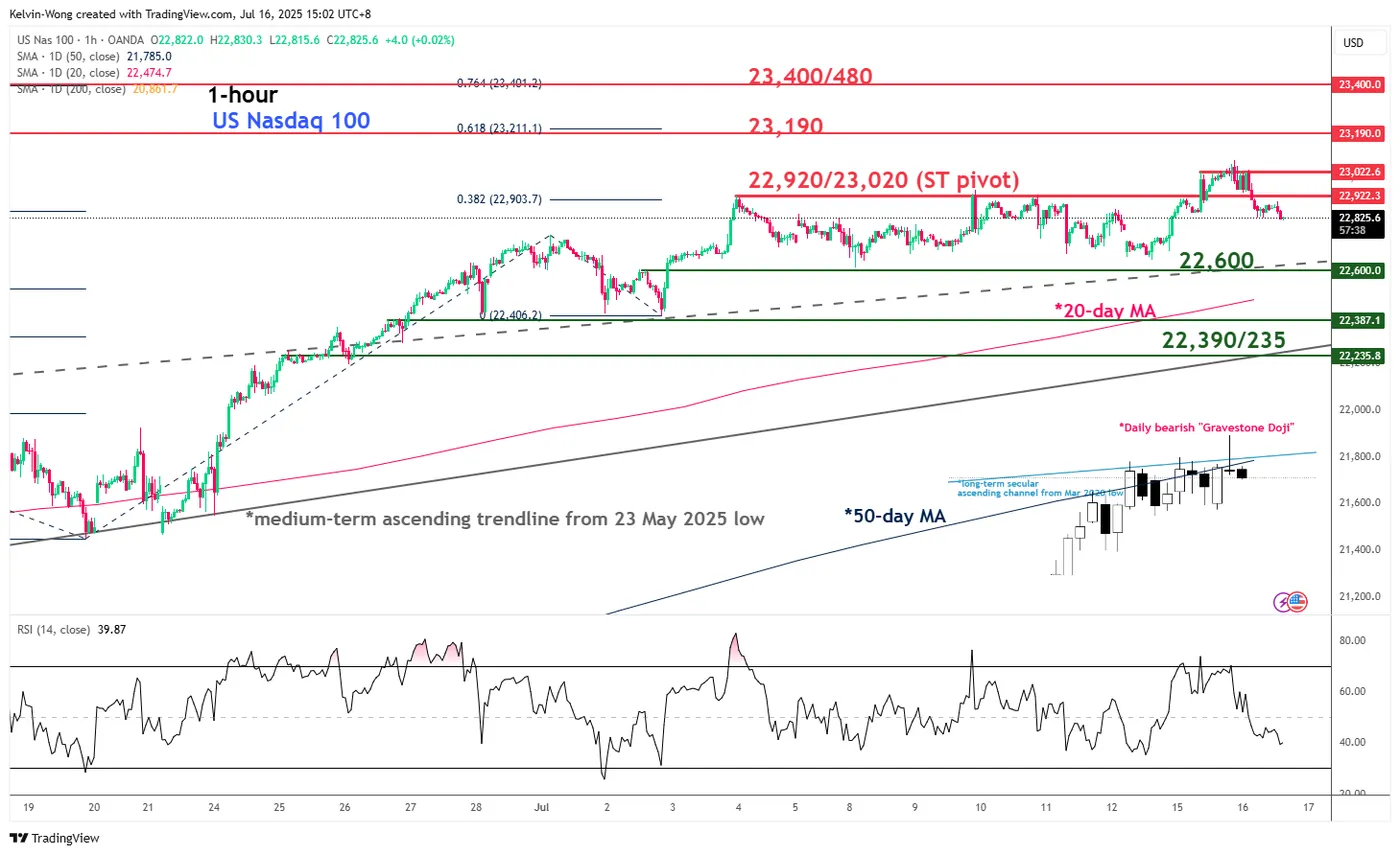
Fig 2: US Nasdaq 100 CFD Index minor trend as of 16 July 2025 (Source: TradingView)
Despite the last two sessions of outperformance seen on the Nasdaq 100 against the other major US stock indices (S&P 500, DJIA, Russell 2000), technical analysis suggests that the US Nasdaq 100 CFD Index is likely due for at least an imminent minor corrective decline sequence within its medium-term uptrend phase.
Since 3 July, the price actions of the US Nasdaq 100 CFD Index has consolidated and stalled at the upper boundary of a long-term secular ascending channel in play since the March 2020 low,
Only for the first time on Tuesday, 15 July, since the consolidation started on 3 July, the US Nasdaq 100 CFD Index has formed a daily bearish reversal “Gravestone Doji” candlestick pattern after a failed intraday push above the upper boundary of the long-term secular ascending channel (see Fig 2).
These observations suggest a potential “bullish exhaustion” moment on the US Nasdaq 100 CFD Index in light of Nvidia’s (a significant component stock of Nasdaq 100) positive news flow that allowed it to sell lower-grade H20 chips to China.
Watch the 22,920/23,020 pivotal resistance, and a break below 22,600 is likely to expose the next intermediate support zone of 22,390/22,235 in the first step.
However, a clearance above 23,020 invalidates the bearish scenario to resume the bullish impulsive up move sequence for the next intermediate resistances to come in at 23,190, and 23,400/23,480 (defined by Fibonacci extension cluster levels).
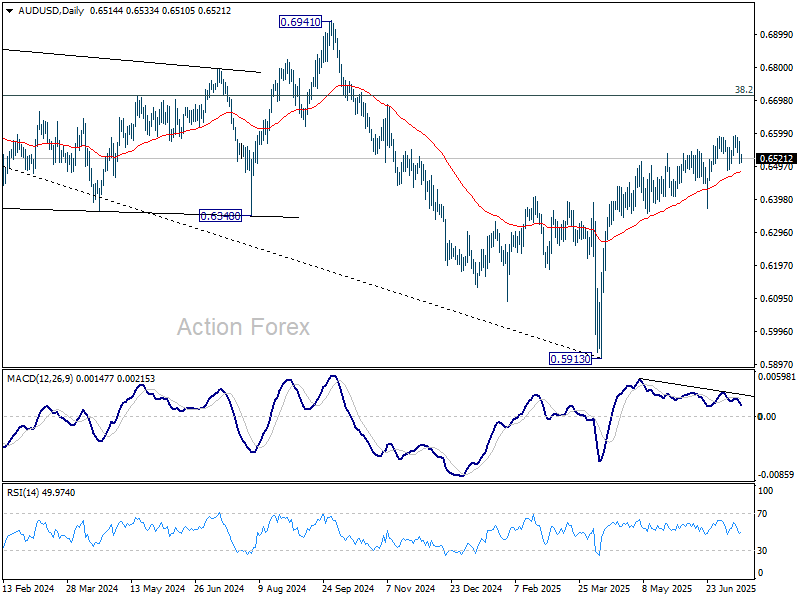
AUD/USD Daily Report
Daily Pivots: (S1) 0.6489; (P) 0.6533; (R1) 0.6557; More...
Range trading continues in AUD/USD and intraday bias stays neutral. Further rise is expected as long as 0.6484 support holds. Above 0.6594 will resume the rally from 0.5913 and target 0.6713 fibonacci level. However, firm break of 0.6484 will turn bias to the downside for 0.6372 support instead.
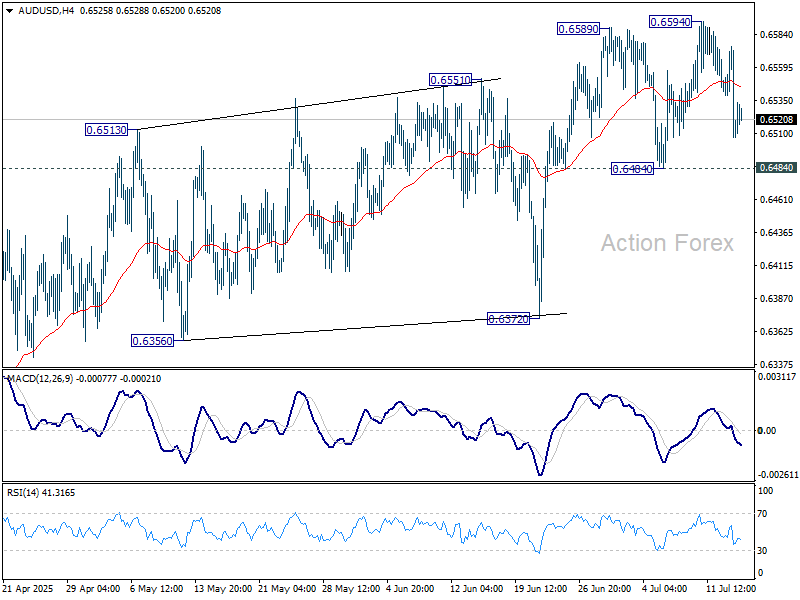
In the bigger picture, there is no clear sign that down trend from 0.8006 (2021 high) has completed. Rebound from 0.5913 is seen as a corrective move. While stronger rally cannot be ruled out, outlook will remain bearish as long as 38.2% retracement of 0.8006 to 0.5913 at 0.6713 holds. Nevertheless, considering bullish convergence condition in W MACD, even in case of another fall through 0.5913, downside should be contained above 0.5506 (2020 low).
USD/CAD Daily Outlook
Daily Pivots: (S1) 1.3687; (P) 1.3708; (R1) 1.3745; More...
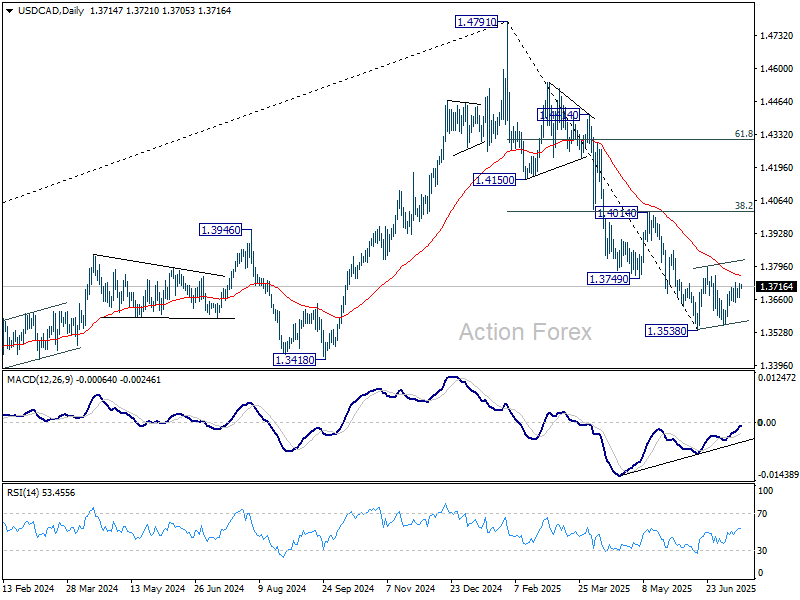
Intraday bias in USD/CAD stays neutral at this point. Overall, price actions from 1.3538 are seen as a corrective pattern, which is now in its third leg. Stronger rise could be seen and above 1.3728 will target 1.3797 resistance and probably above. On the downside, break of 1.3637 minor support will bring retest of 1.3538/55 support zone.
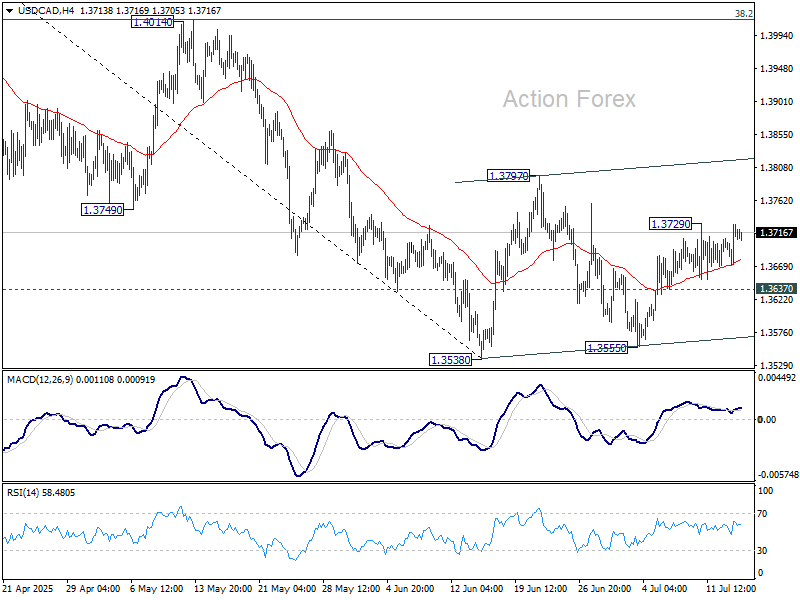
In the bigger picture, price actions from 1.4791 medium term top could either be a correction to rise from 1.2005 (2021 low), or trend reversal. In either case, further decline is expected as long as 1.4014 resistance holds. Next target is 61.8% retracement of 1.2005 (2021 low) to 1.4791 at 1.3069.