Sample Category Title
NZD/USD Cracks Lower — More Pain on the Horizon?
Key Highlights
- NZD/USD started a fresh decline below the 0.6000 support zone.
- A key bearish trend line is forming with resistance at 0.6000 on the 4-hour chart.
- EUR/USD extended losses below the 1.1650 and 1.1620 levels.
- Ethereum price surged further above the $3,080 resistance zone.
NZD/USD Technical Analysis
The New Zealand Dollar started a fresh decline from 0.6120 against the US Dollar. NZD/USD dipped below the 0.6050 and 0.6020 support levels.
Looking at the 4-hour chart, the pair traded below the 50% Fib retracement level of the upward move from the 0.5883 swing low to the 0.6120 high. There is also a key bearish trend line forming with resistance at 0.6000.
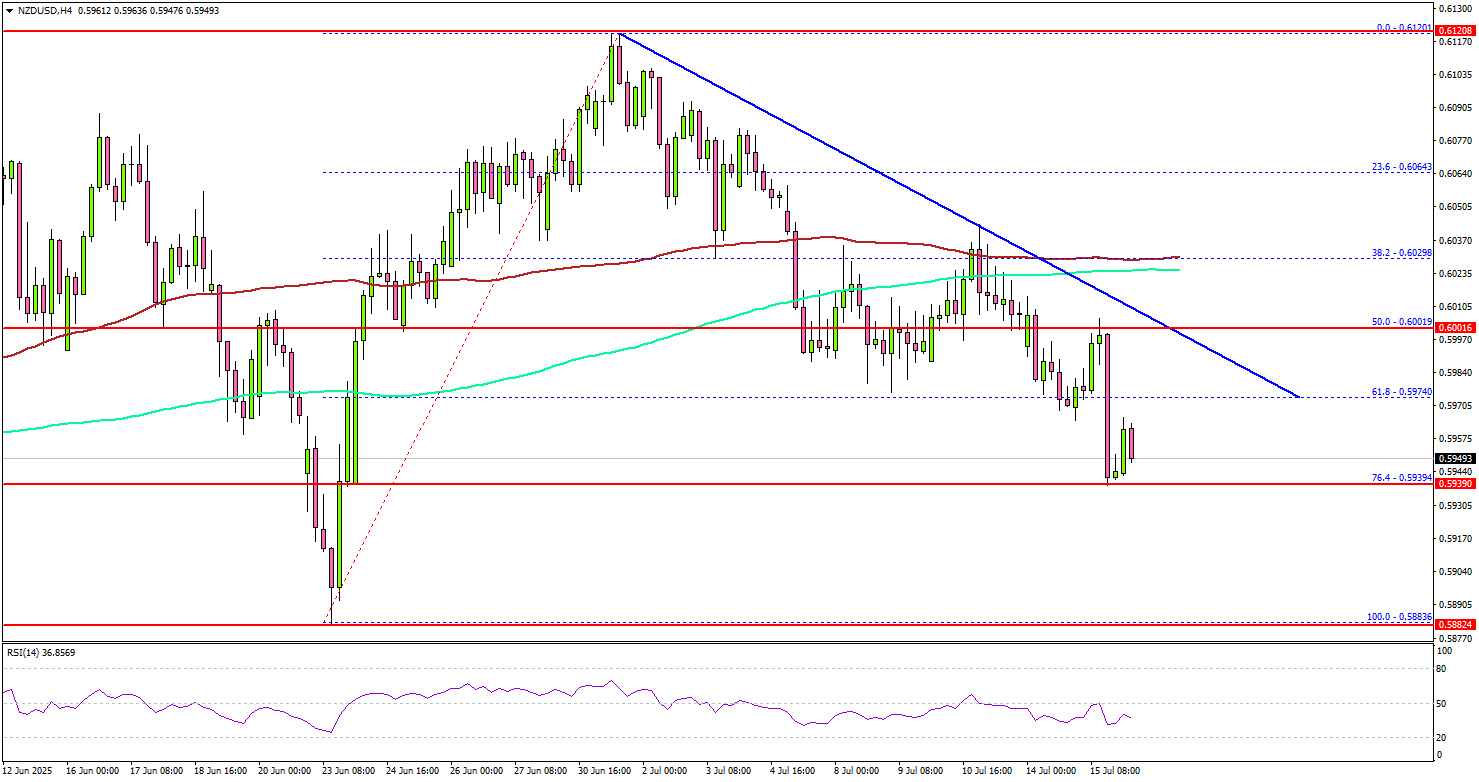
The pair now trades below 0.6000, the 100 simple moving average (red, 4-hour), and the 200 simple moving average (green, 4-hour). On the downside, immediate support is near the 0.5940 level. It is close to the 76.4% Fib retracement level of the upward move from the 0.5883 swing low to the 0.6120 high.
The next key support sits near 0.5900. Any more losses could send the pair toward the 0.5880 support zone. On the upside, the pair could face resistance near the 0.6000 level and the trend line.
The next key resistance sits near the 0.6030 level and the 100 simple moving average (red, 4-hour). A close above the 0.6030 level could set the pace for another increase. In the stated case, the pair could even clear the 0.6050 resistance. The next major stop for the bulls could be near the 0.6120 resistance.
Looking at EUR/USD, the pair started a fresh decline, and the bulls failed to protect the 1.1650 support zone.
Upcoming Economic Events:
- US Producer Price Index for June 2025 (MoM) – Forecast +0.2%, versus +0.1% previous.
- US Producer Price Index for June 2025 (YoY) – Forecast +2.5%, versus +2.6% previous.
Fed’s Logan cites fiscal tailwinds, inflation risk in case for rate hold
Dallas Fed President Lorie Logan said overnight that she expects a slight pickup in the Fed’s preferred inflation measure following June’s CPI release and warned against easing policy prematurely. With the PCE inflation gauge at 2.3% in May, Logan said the latest CPI data “probably” means it will “move up a bit.” She stressed the need for a longer trend of subdued inflation before being confident in the disinflation process.
At the same time, Logan pointed to a solid labor market, near-record stock prices, and the recently passed Trump fiscal package as "tailwind" for continued economic strength.
Against that backdrop, Logan argued that the Fed can afford to “hold tight for a while longer,” maintaining modestly restrictive policy to ensure inflation returns to target sustainably.
Fed’s Collins favors “actively patient” stance amid tariff-driven inflation risks
Boston Fed President Susan Collins said overnight that the Fed should remain “actively patient” in its stance. Despite the complexity of current conditions, she argued that “solid” fundamentals give the Fed room to carefully assess incoming data before making policy moves. “Calibrating appropriate policy in this context is challenging,” she acknowledged in her speech.
Collins highlighted the inflationary impact of newly imposed trade tariffs, which she said are beginning to show up in the prices of some goods. She projected core inflation to climb toward 3% by the end of the year, while warning that growth and employment may slow as a result.
However, she pointed to mitigating factors—such as firms narrowing profit margins and consumers maintaining spending. "As a result, the adverse impact of tariffs on labor market conditions and economic growth may be more limited," she said.
Fed’s Barkin sees inflation stickiness, defends Fed independence
Richmond Fed President Tom Barkin warned that inflation pressures remain persistent, with recent data showing signs of renewed pricing power among suppliers.
Speaking at an event in Baltimore, Barkin noted that many firms—still emboldened by the inflation surge of the past two years—are attempting to pass on rising costs, including those tied to tariffs. However, he cautioned that consumers, fatigued by prolonged inflation, may push back. “You’ve got consumers who are exhausted by inflation, who are already trading down,” he said.
Barkin's comments also touched on the institutional integrity of the Fed amid speculation surrounding Fed Chair Jerome Powell’s future. With Powell’s term set to expire in May next year, US President Donald Trump is widely expected to nominate a more dovish successor.
Barkin emphasized the importance of policy independence, saying he hoped any new appointee would “try to decide the best policy for the country.” He added that rate-setting decisions aren’t necessarily driven by the Fed chair alone.
GBP/USD Vulnerable as Trendline Break Sets Up Potential 600 Pip Drop
GBPUSD has continued its recent struggles today with the pair on a 8-day losing streak. This comes after cable posted 5 consecutive months of gains, to rise from a 2025 low of 1.2099 to a high of 1.3788, last seen in October 2021.
The rally in GBPUSD was largely facilitated by USD weakness following Donald Trump's inauguration and announcement of global tariffs. The move which saw the US Dollar lose its safe haven status and the US Dollar Index (DXY) drop below the psychological 100.00 mark for the first time since a brief foray in July 2023.
However as tariffs have drawn near the US Dollar has shown signs of life. The DXY is now on four-day win streak and is approaching the 99.00 handle. This comes at a time when the UK is facing macro challenges which have begun to weigh on the GBP.
US Dollar Index (DXY) Daily Chart, July 15 2025
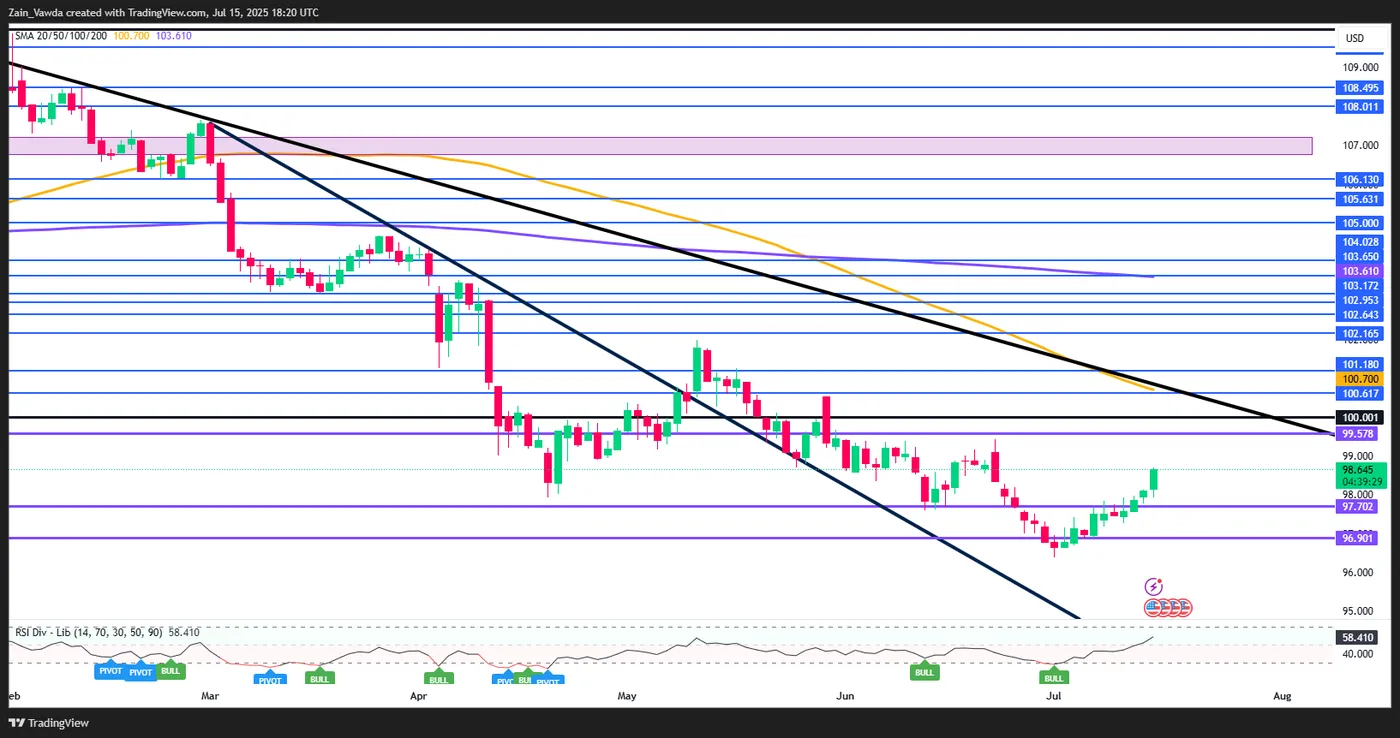
Source: TradingView
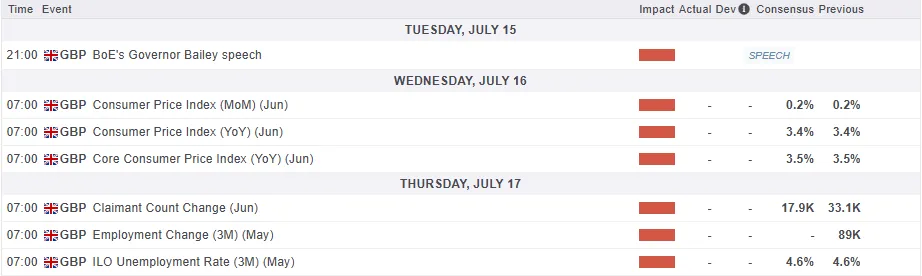
UK CPI Ahead as Macro Factors Weigh on the Pound
The recent drop in the pound isn’t due to fiscal issues, as the 10-year Gilt-Bund spread has tightened to 187 bps, its lowest since April. Instead, it’s driven by narrowing short-term interest rate spreads. This reflects doubts about whether the Bank of England will ease policy faster than expected.
Tonight, Governor Andrew Bailey will speak, likely signaling that quicker rate cuts are possible if the labor market weakens following an uptick in UK unemployment.
Key data releases lie ahead with June CPI tomorrow and UK labor market figures on Thursday. If May’s payroll drop of -109k isn’t revised and June shows further declines, UK rates and the pound could fall further. All of this may play into the current setup developing for GBPUSD.
For all market-moving economic releases and events, see the MarketPulse Economic Calendar.
Technical Analysis - GBP/USD
GBP/USD is on course for a daily candle close below the long term ascending trendline which traces back to January 13 lows of 1.2099.
GBPUSD is on a 8 day losing streak which may warrant caution that a short-term pullback may materialize.
Further supporting this narrative is the RSI period 14 which is approaching the 30 handle, which is considered an oversold zone. However, as we know this is no guarantee that a bullish move will occur, as the RSI has a tendency to continue lower even when it is below the 30 handle if the bearish trend is strong.
There is support around a 100 pips below current price, around the 1.3266 handle which is where the 100-day SMA rests. Just below that, we have the 1.3250 handle which is also a multi-year key level which has served as support/resistance over the past few years.
A break of this support level brings the key pivot level of 1.3000 into focus. A break here could lead to a drop toward the first potential trendline break target which rests at 1.2708, some 600 pips from current prices.
Indeed should such a move play out this is one that may present further opportunities for entry along the way, but it is definitely worth watching.
GBP/USD Daily Chart, July 15, 2025
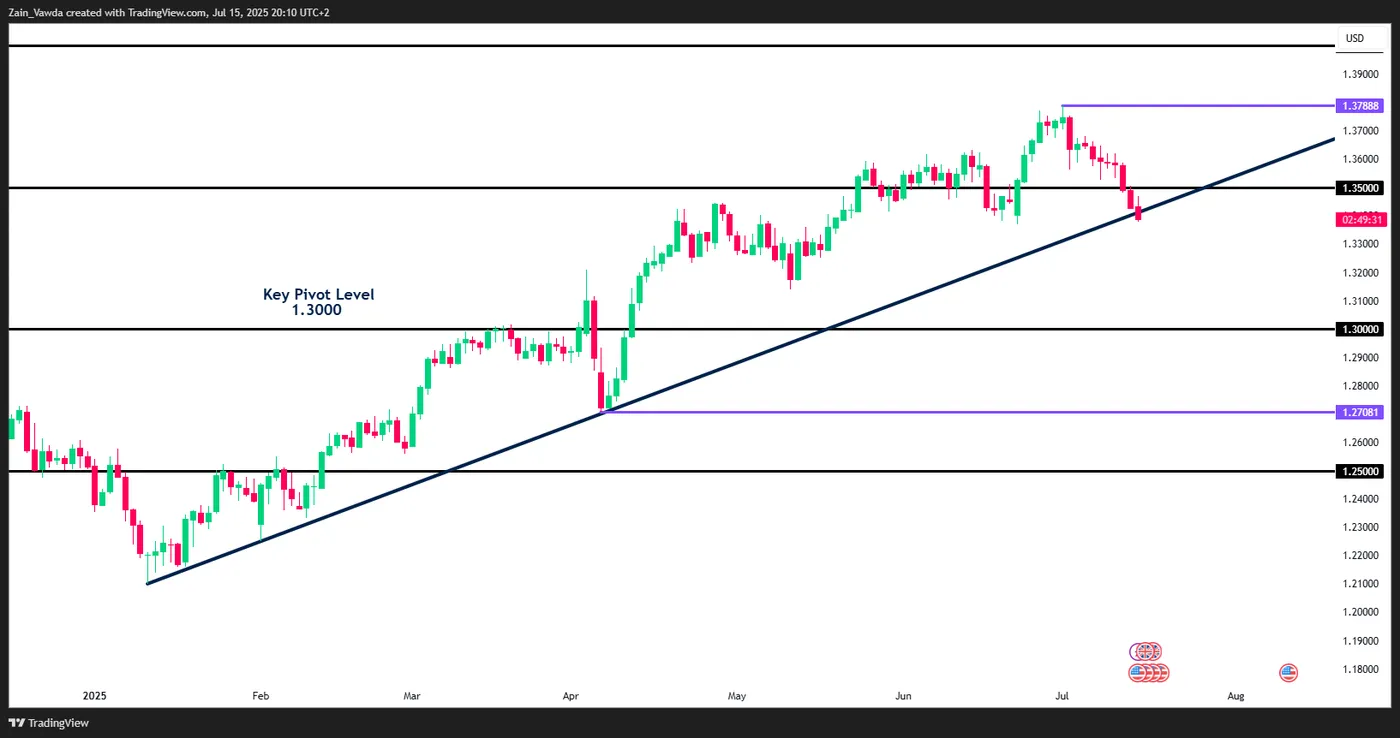
Source: TradingView.com
Support
- 1.3266
- 1.3000
- 1.2708
Resistance
- 1.3500
- 1.3788
- 1.4000
Client Sentiment Data - GBP/USD
Looking at OANDA client sentiment data and market participants are rather neutral on GBP/USD with 52% of traders net-short. I prefer to take a contrarian view toward crowd sentiment, however the fact that traders are relatively neutral does not help provide any significant insights. All it shows is that market participants are cautious and rightly so as the fundamentals and technicals hint at further downside but after 8 consecutive bearish days market participants are clearly cautious.
Bitcoin Retracts, Altcoins Shine in Unusual Reactions to US CPI
This morning's price action is a tricky one: The US CPI report has surprised positively, with a lack of initial reaction still turning into a positive reactions at the Market Open.
Equities rallied and Bitcoi,n which retracted from its all-time highs overnight, saw a bounce but that rally was underwhelming and got followed by some reversals – The moves in markets are centered around the major Rally that happened in the US Dollar since 9:30.
The Dow Jones was the index to follow as a failed bounced got followed by a general reversal from markets and Majors which are currently struggling against the Greenback – Only the Nasdaq is still up on the session, consolidating around the 22,950 Level.
In spite of all the mixed signals given by Markets in the morning session, BTC is still trading $6,000 above its record highs and Cryptocurrencies aficionados are using this relative strength in Tech as a signal to pump altcoins.
Let's take a look at Risk-Assets with an emphasis on Crypto to spot what Markets are cooking.
An uncommon Price action in US Equities
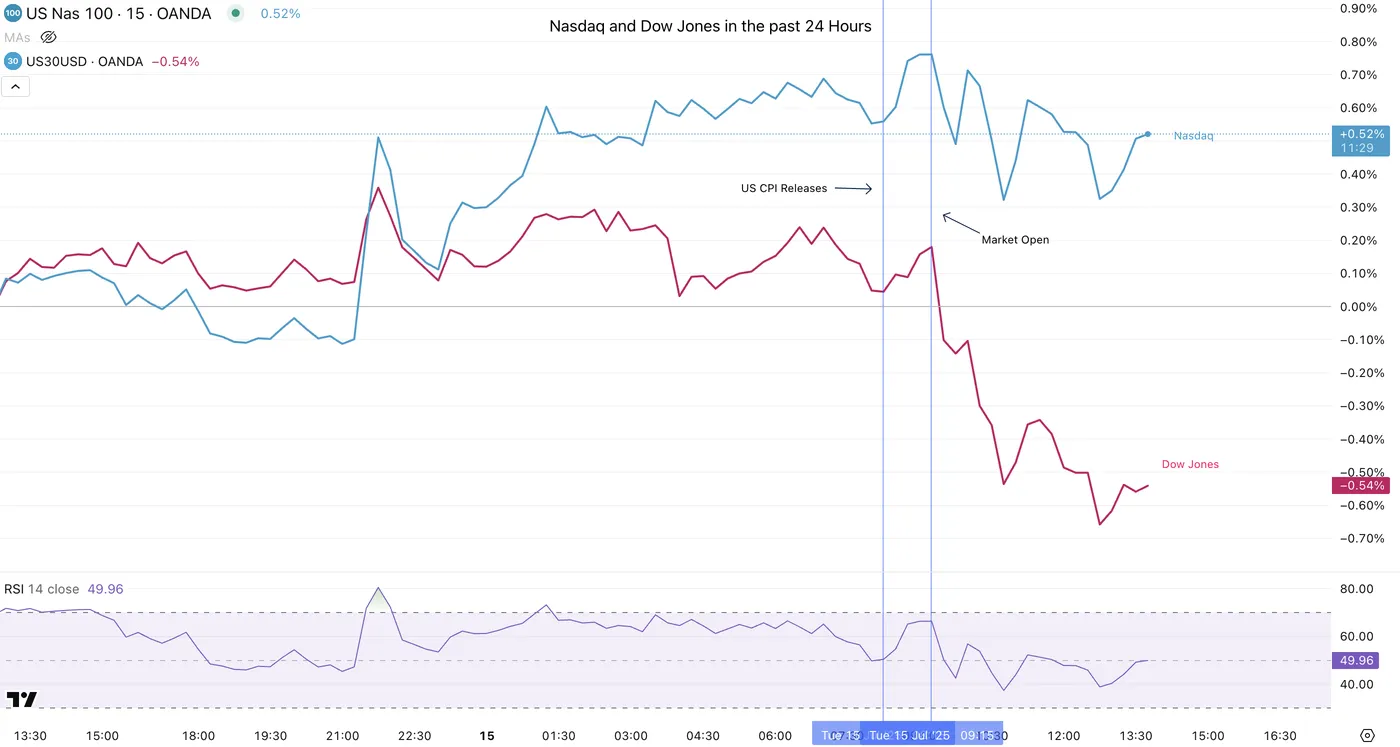
Nasdaq and Dow Jones performance in the past 24 Hours
The Immediate reaction to the data was positive but not by a strong margin, with the Dow taking a concrete turn to the downside which may weigh on overall Equity sentiment, with the S&P 500 actually turning negative in the past hour.
The earnings season has just begun, therefore expect some confusion in Indices as Markets tend to see major rebalancing around these periods
So, what about Cryptos?
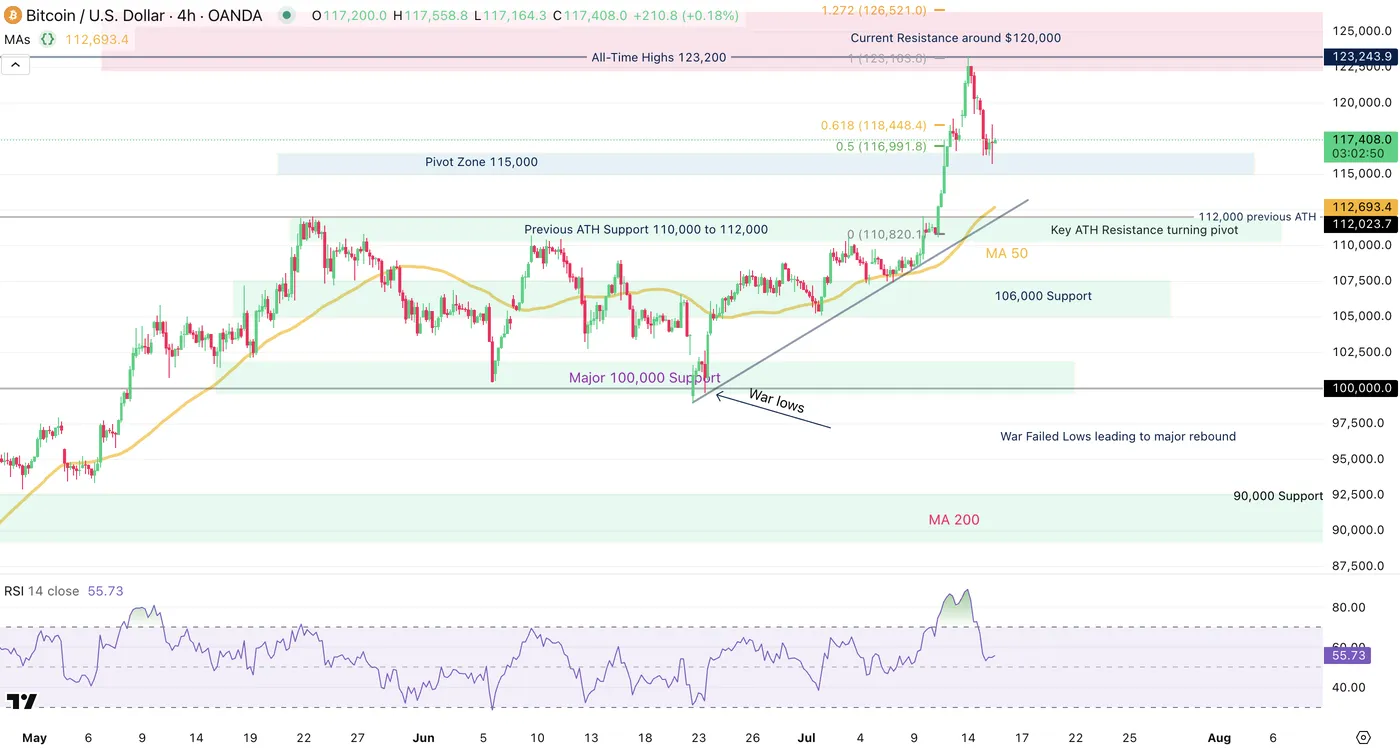
Screenshot 2025-07-15 at 1.57.10 PM
Bitcoin 4H Chart, July 15, 2025 – Source: TradingView
Bitcoin is trading just below the 50% retracement of the impulsive Move that took the crypto to its all-time highs (~$123,200).
As long as BTC holds above its $115,000 Pivot Zone (light blue), expect the Crypto Markets to maintain a positive tone.
Usually, when Bitcoin stays put after having retraced slightly from all-time highs, like today, Altcoins tend to rally consequently.
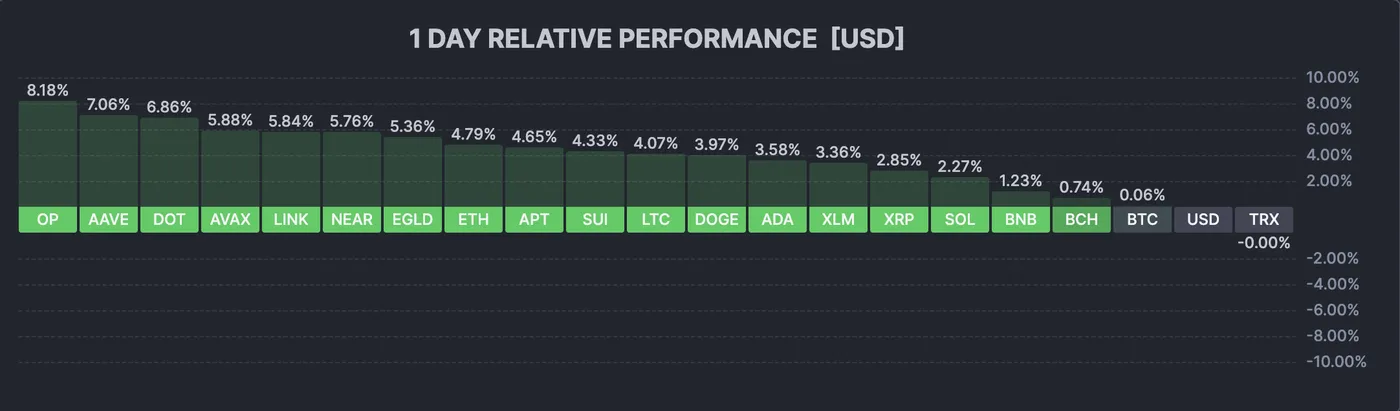
Cryptocurrencies Performance Board – Source: Finviz
As can be seen, the picture is very green for cryptos – The all-around positive sentiment in Tech, the only sector positive on the day is dragging up majorly altcoins, with OP (Optimism, an ETH-Ecosystem altcoin), AAVE and Polkadot are leading on the day.
For major cryptos, Ethereum is up close to 3% compared to an down small/unchanged Bitcoin – another bull sign for altcoins.
Monitor this trend for the upcoming period as this is a move that Crypto buyers have been awaiting in the 9-month Bitcoin-Only rally.
Edit: Total Market Cap hit new all-time highs
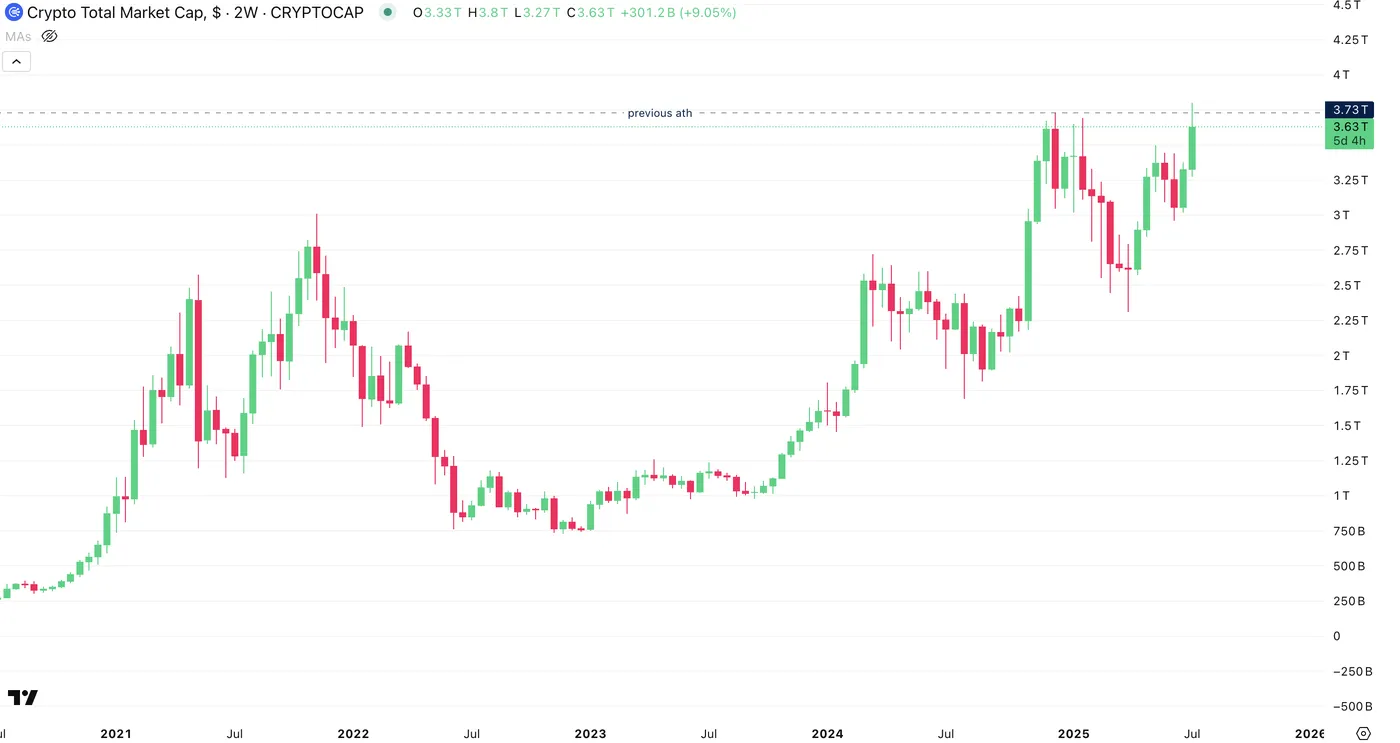
Crypto Total Market Cap, July 15, 2025 – Source: TradingView
When writing the article, I had not observed that the Total market cap had made new highs ($3.8T), a very strong sign for the overall Crypto market.
However, despite a strong day for altcoins, the Market Cap has retracted today but is still staying in the 98th percentile of historic performance – This is something to track if risk-assets were to see outflows.
ETH/BTC Update
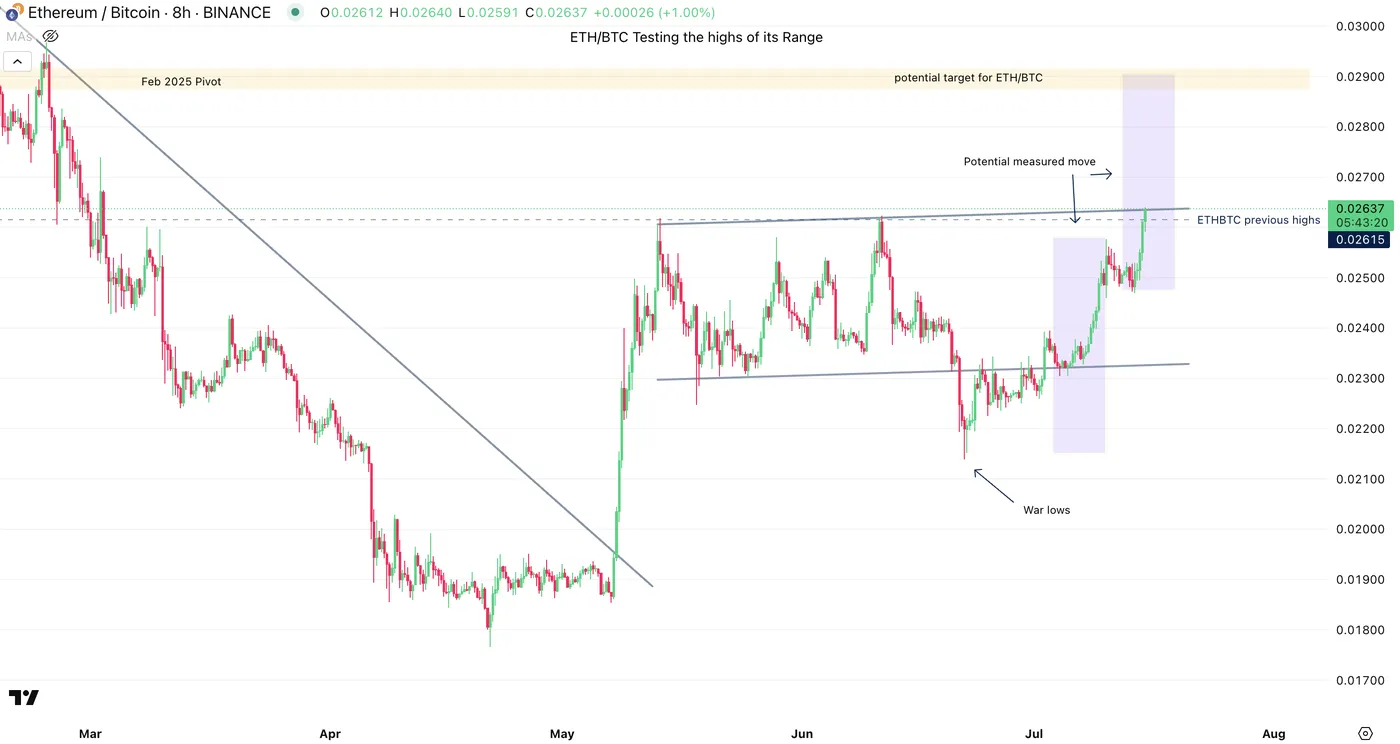
ETH/BTC Since February 2025 – Source: TradingView
ETH/BTC has been rallying consequently since the June 21st War Lows and this has helped altcoins to take back some share of the crypto market – Most of the crypto inflows have been directed to Bitcoin and Altcoins had previously been correcting, awaiting for such a move.
It is still early to assume a breakout, but the strength of the ongoing ETH/BTC rally may lead to significant upside in Ethereum and hence other altcoins.
Potential targets for the potential breakout could be between 2.90% to 3% of BTC's price on a measured move count – Difficult to predict if sentiment will hold but the probabilities of this scenario are high on a Technical Analysis perspective.
A story that warrants close follow-up, particularly as the ongoing market-environment is giving some signs of change.
Safe Trades!
Silver Trades Around 14 Years High in a Breakout
Silver has been working a catch up in terms of performance compared to the more-shining Gold that really took off against other traded metals in the first half of the year.
Our past analysis of Silver observed the addition of elements that could lead to a breakout, with that outcome actually taking place in the past 4 sessions.
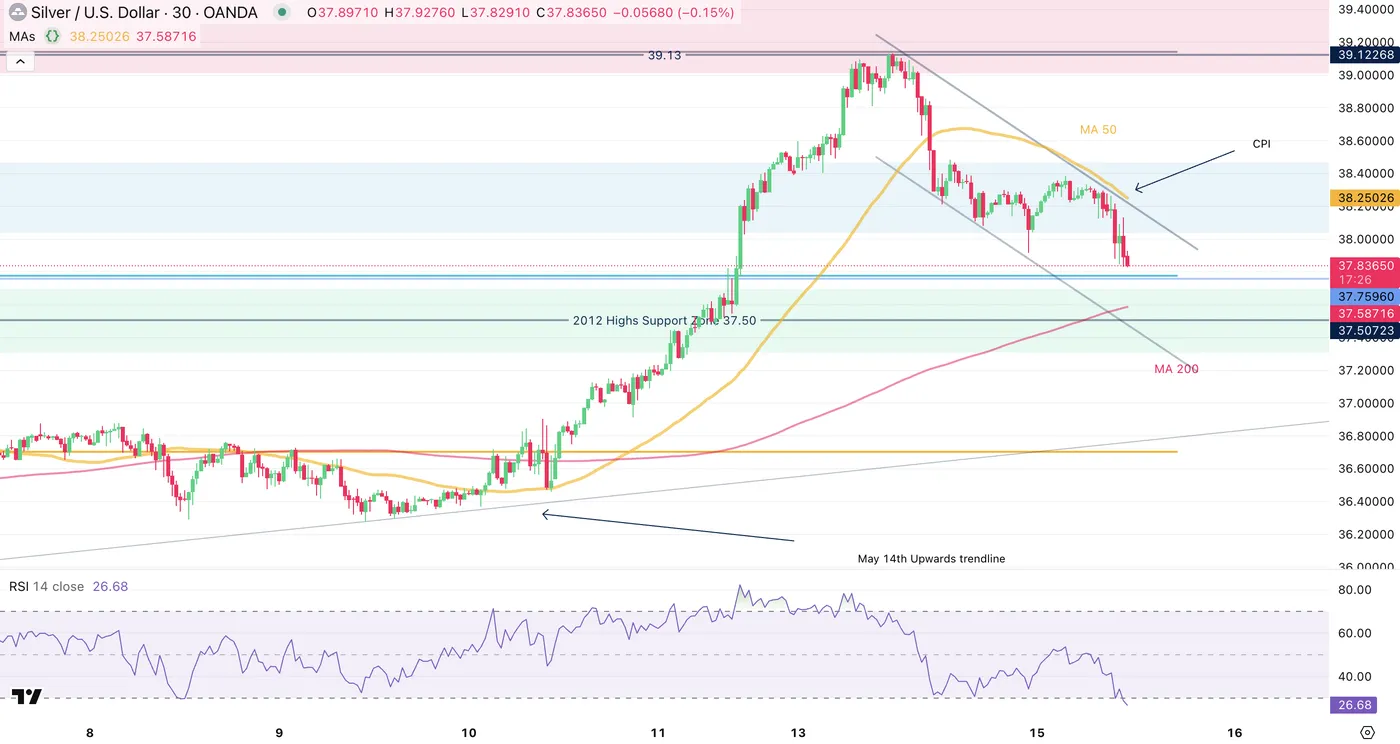
Prices went from a $36.5 consolidation zone to highs of $39.13, a 7.5% rise to levels not seen since September 2011 spikes.
Let's take a look at where prices currently stand as metals have been retracting slowly off of Friday highs – The Dollar Index broke out after the 9:30 Market Open and this usually doesn't help with Precious Metal Performance.
Silver Intraday Update
Silver 4H Chart
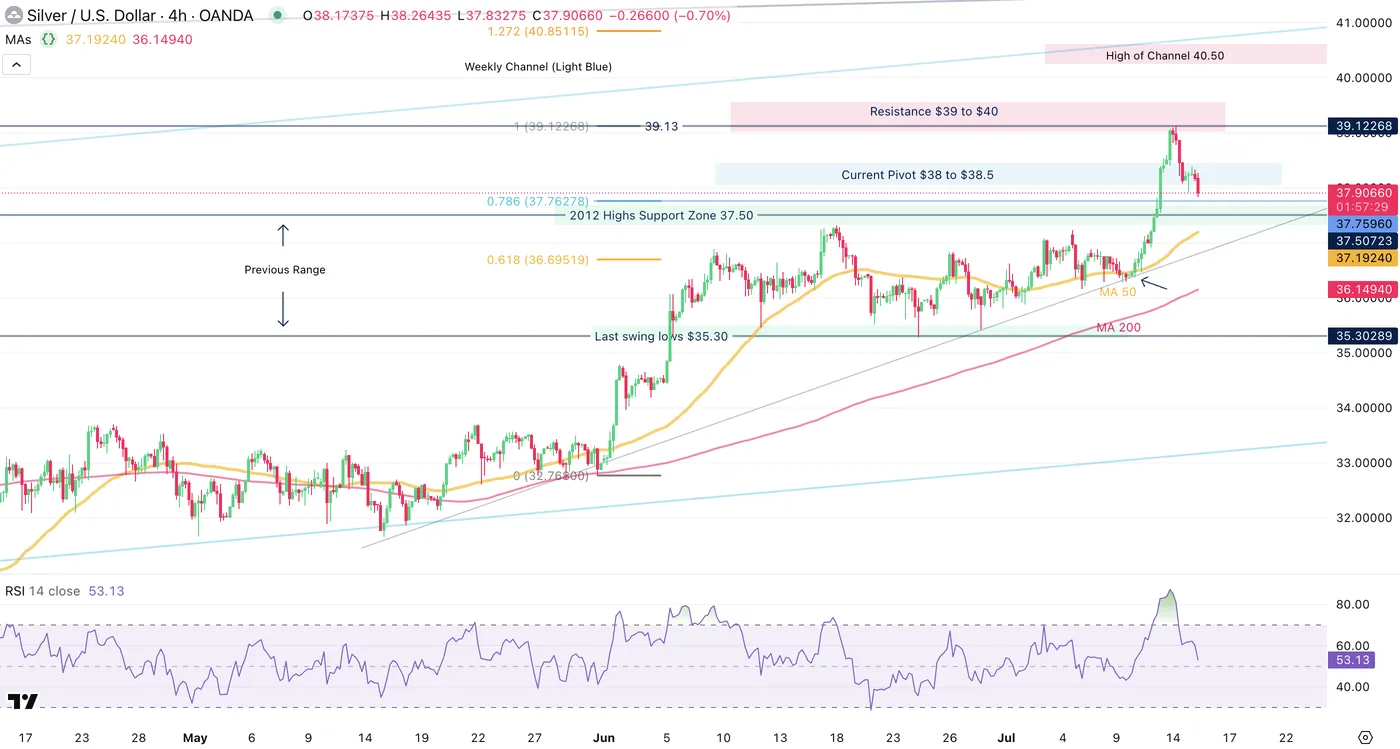
Silver 4H Chart, July 15, 2025 – Source: TradingView
Last week's consolidation at its middle of the range with the 4H MA 50 coming in as support gave some great technical conditions pointing towards the eventual breakout that took the metal to its Friday 39.13 highs on a tight bull channel.
Overbought conditions have led to some reversals in anticipation of today's CPI Release.
One thing to spot on the current corrective sequence is the playing of the immediate support zone around the 2012 highs (37.50 +/- $0.15). Holding this Zone would consolidate further the breakout towards a new trend.
Any rebound from here would also need to test the upper bound of the channel as the most recent highs stalled about $1 from that area, however time consolidation could lead to even higher prices that is, as long as prices hold the support zone mentioned just before.
Silver 1H Chart
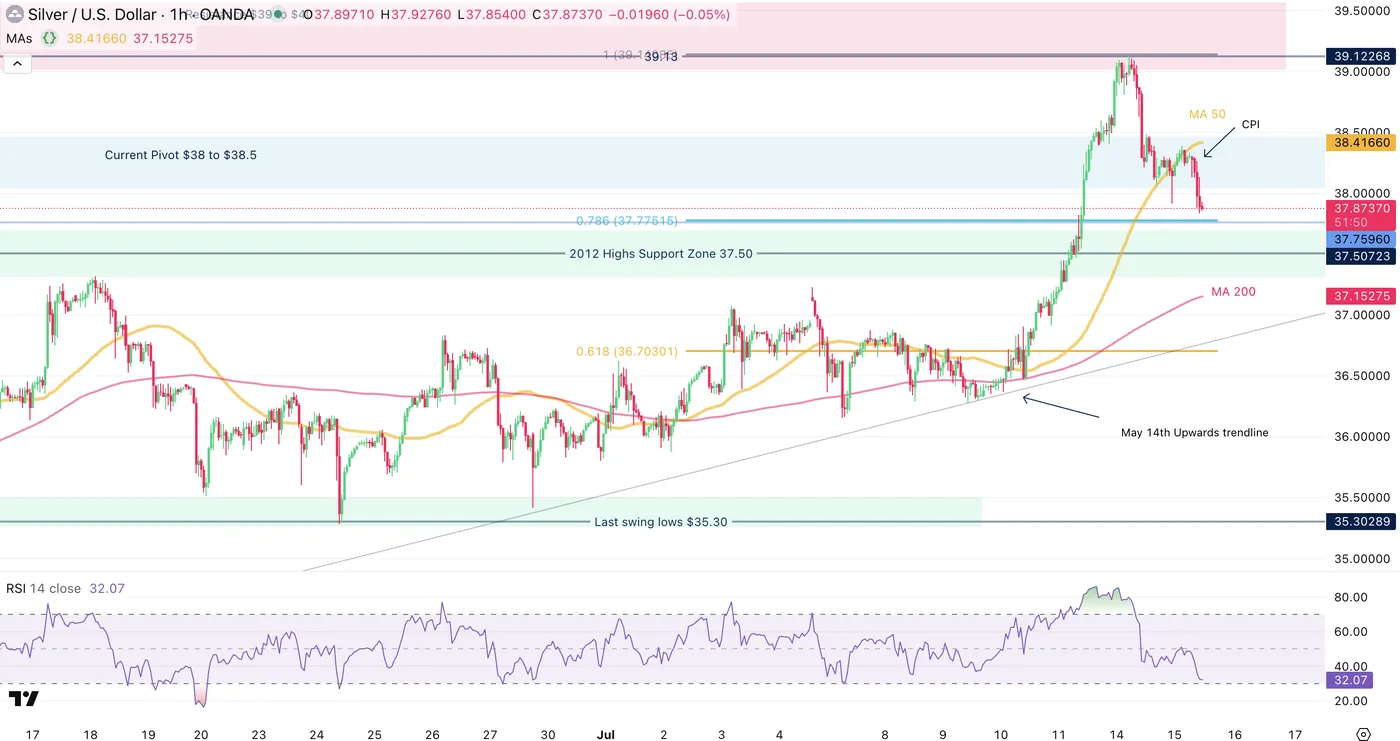
Silver 1H Chart, July 15, 2025 – Source: TradingView
Placing a Fibonacci tool from the last swing lows to the current highs points at potential stalling within the correction around the 78.6% level at $37.75, within the Support Zone.
1H Momentum is write at oversold after the CPI led to some further correction in prices – About the CPI, the report came in just below expectations, something that should have seen a small rebound in the precious metal however subsequent USD Buying led to the current outcome.
This is a story to watch as markets may start to fade such data points and this tends to form longer trends. We will watch upcoming reactions to data releases in that aspect.
Silver 30m Chart
Silver 30m Chart, July 15, 2025 – Source: TradingView
The 30m and 1H 50-period Moving average are now acting as resistance and will be key barometers for either continuation (use the MA as selling point) or recovering of strength (breaking out of both the upper bound of the descending 30m channel + the 50 period MA – $38.25)
In any case, prices are now contained between the 50 and 200 30m MA which may point to the consolidation scenario around the $37.75 Fib, as prices are currently entering the 2012 High Support.
Safe Trades!
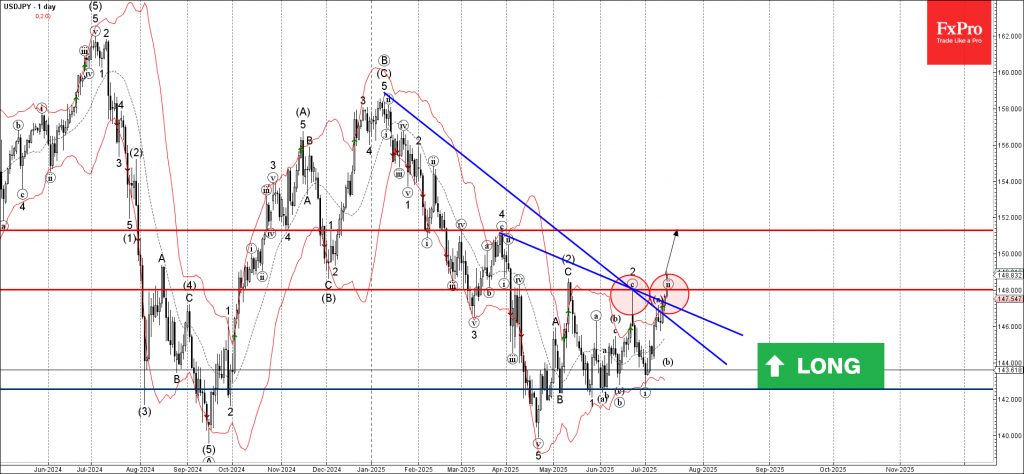
USDJPY Wave Analysis
USDJPY: ⬆️ Buy
- USDJPY broke the resistance area
- Likely to rise to resistance level 151.30
USDJPY currency pair recently broke the resistance area located at the intersection of the resistance level 148.00 and the two resistance trendlines from January and March.
The breakout of this resistance area should strengthen the bullish pressure on his currency pair.
Given the continuation of the widespread yen sales seen recently across FX markets, USDJPY currency pair index can be expected to rise to the next resistance level 151.30 (monthly high from March).
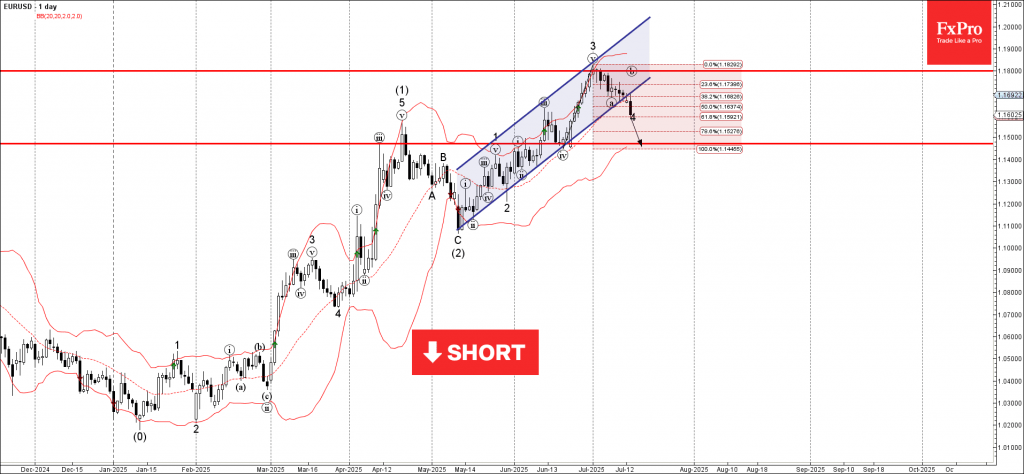
EURUSD Wave Analysis
EURUSD: ⬇️ Sell
- EURUSD broke daily up channel
- Likely to fall to support level 1.1470
EURUSD currency pair recently broke the support area located at the intersection of the support trendline of the daily up channel from May and the 38.2% Fibonacci correction of the upward impulse from June.
The breakout of this support area accelerated the active short-term ABC correction 4.
Given the strongly bullish US dollar sentiment coupled with significant euro pessimism seen today, EURUSD currency pair can be expected to fall further to the next support level 1.1470 (low of former wave iv).
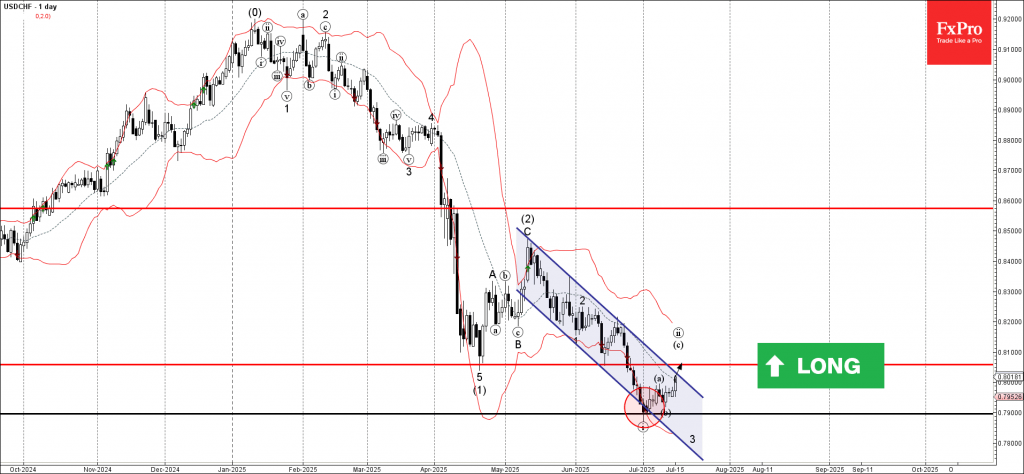
USDCHF Wave Analysis
USDCHF: ⬆️ Buy
- USDCHF reversed from support zone
- Likely to rise to resistance level 0.8055
USDCHF currency pair recently reversed from the support zone lying at the intersection of the support level 0.7900, lower daily Bollinger Band and the support trendline of the daily down channel from May.
The upward reversal from support zone started the active short-term ABC correction ii.
Given the strongly bullish US dollar sentiment seen today, USDCHF currency pair can be expected to rise to the next resistance level 0.8055 (former strong support from April and June).