Sample Category Title
Sunset Market Commentary
Markets
(Equity) markets of late showed remarkable resilience to multiple sources of (potential) risk. Those risks were supposed to remain risks that in the end won’t materialize. This attitude in some way again dominated trading this morning. President Trump signaling that multiple (150) countries would get a letter advocating tariffs of about 10-15%, can be seen as an indication that the trade war could be settled at a sub-optimal, but manageable, level. This is also the hoped for conclusion for the outcome of pending negotiations with other majors (EU, Japan en even China). Trump added a new layer of uncertainty as he steps up efforts to dismiss Fed Chair Powell. After a spike in risk aversion yesterday, this issue for now is also shelved. Market expectations on Fed policy show remarkable stability. Any indication on tariff-related inflation is still countered by easing services inflation, making the Fed’s by default wait-and-see stance the most logical option. There even was no additional headline news on the debt sustainability issue. This ‘’volatility narrative” allows (US) stocks to hold near record levels (S&P 500 unchanged). European indices also continue to perform well given recent euro strength (Eurostoxx 50 +1.0%). In this context, today’s US data (Philly Fed survey, jobless claims, retail sales) likely would only be of short-term relevance even in case of an outcome out of line with consensus. This was exactly what happened. All three series were better than expected. Headline retail sales rose 0.6% M/M (0.1% expected), control group sales 0.5% M/M. Jobless claims dropped further to 221k (from 227k). The Philly Fed business outlook jumped to 15.9 from (-4.0 and -1.0 expected). In line with other price data this week, headline import prices (0.1%M/M; -0.2% Y/Y) were softer than expected even as the likes of consumer goods (0.4% M/M) showed tentative signs of rising. US yields initially gained modestly after the release, but currently are trading modestly lower (<3 bps). Idem for German yields. For now, the combination of solid US data, yields discounting the Fed not rushing into easing and the debate on the replacement of Powell moving to the background, supports the recent technical rebound of the dollar. DXY trades at 98.75 (from 98.35). EUR/USD declines modestly (1.1590). USD/JPY also rebounds after yesterday’s setback, but at 148.6 still trades below this week’s peak levels. The UK labour market data showed a further decline in payrolled employment in June (-41k). The unemployment rate ticked higher to 4.7%. Weekly earnings eased but stay elevated (5% from 5.4%). UK yields are gaining modestly (up to 3 bps). The report doesn’t change the trajectory of gradual further BoE easing (August/Nov) with markets currently positioned in a cautious wait-and-see bias 25 bps Nov not yet fully discounted). Sterling eases modestly against a broadly stronger dollar (Cable 1.3395). Against the euro, sterling extends its technical comeback of the 0.87 barrier.
News & Views
The UK and Germany today signed a “Friendship and Bilateral Cooperation Treaty” in London. Both reaffirm their commitment to deepening cooperation to ensure a prosperous, secure, and sustainable future. They recognize the evolving geopolitical landscape, particularly the threat posed by Russia’s aggression in Europe, and emphasize the importance of defending democracy, human rights, and the rule of law. They aim to strengthen their partnership in areas such as security and defense, climate action, economic collaboration, technological innovation and respect for governance structures. They also highlight the importance of the UK-EU relationship and the legal frameworks that support it, and reaffirm their commitment to the Transatlantic Alliance. Separately, they drew up a list as part of an implementation plan to deliver on 17 priority projects (to be reviewed every two years). Ukraine recovery and reconstruction tops the list together with the Trinity House defense agreement.
EU Climate Commissioner Hoekstra told Bloomberg that the €400bn crisis tool presented by the EC in yesterday’s €2tn 2028-2034 budget proposal would be funded using joint borrowing. The crisis tool would provide loans to countries to react faster to adverse events, according to sources. Hoekstra added that the mechanism would be subject to strict controls such as unanimity among the 27 EU states..
EUR/USD Mid-Day Outlook
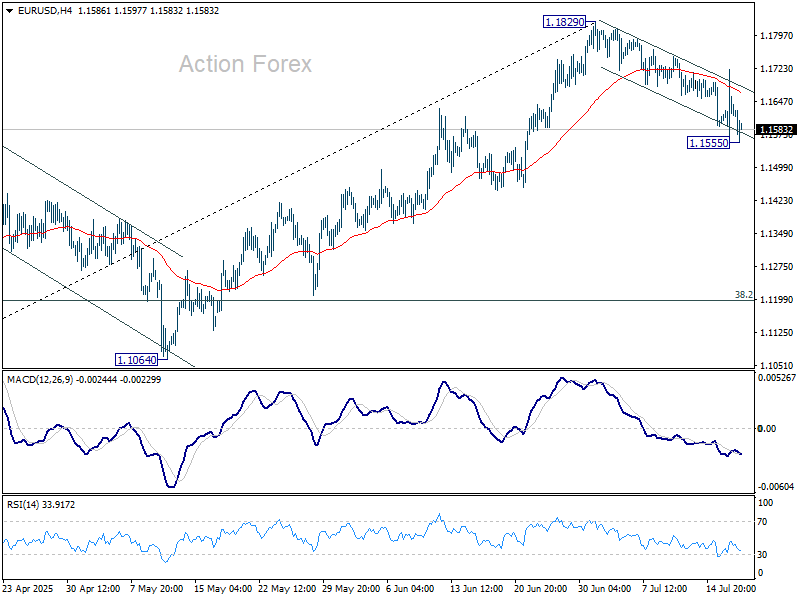
Daily Pivots: (S1) 1.1561; (P) 1.1642; (R1) 1.1721; More...
Intraday bias in EUR/USD remains neutral first. Risk Risk will stay mildly on the downside as long as 1.1829 resistance holds. Fall from there is correcting the rise from 1.1829 or whole rally from 1.0176. Below 1.1555 will target 55 D EMA (now at 1.1478). Sustained break there will target 38.2% retracement of 1.0176 to 1.1829 at 1.1198.
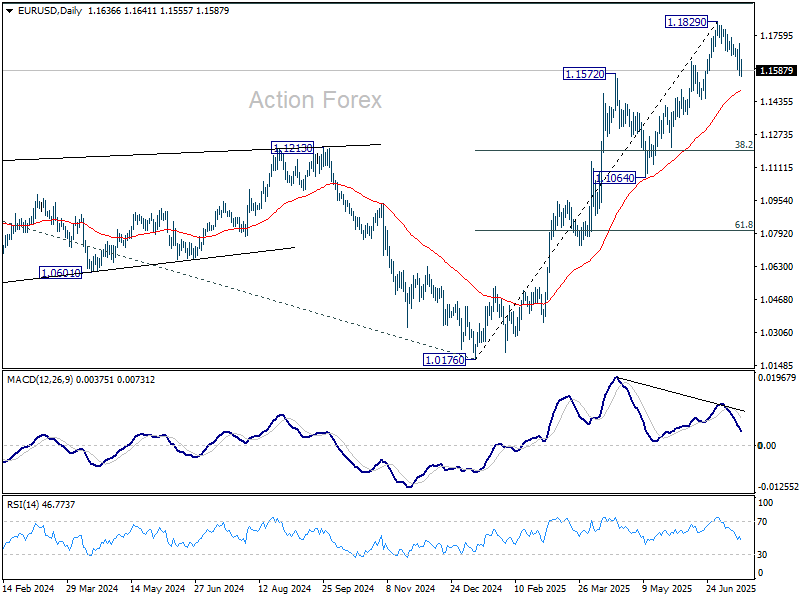
In the bigger picture, rise from 0.9534 long term bottom could be correcting the multi-decade downtrend or the start of a long term up trend. In either case, further rise should be seen to 100% projection of 0.9534 to 1.1274 from 1.0176 at 1.1916. This will remain the favored case as long as 1.1604 support holds.
GBP/USD Mid-Day Outlook
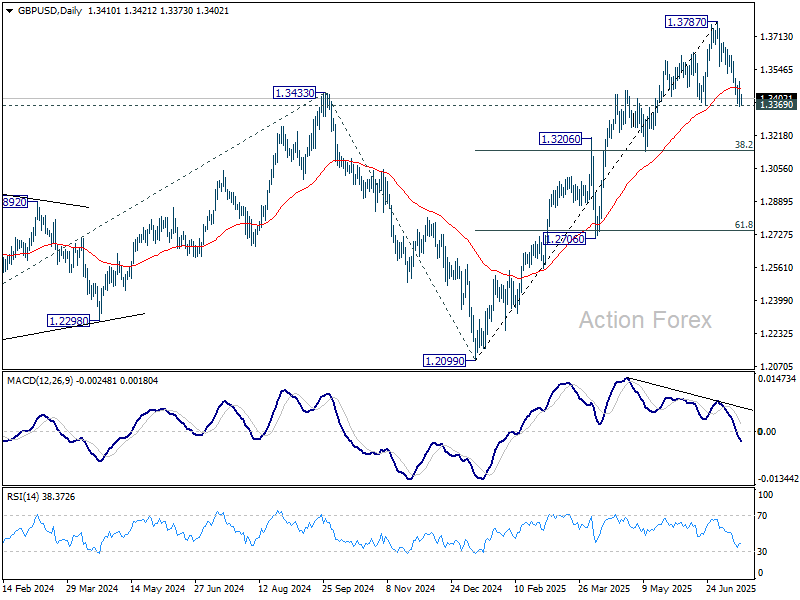
Daily Pivots: (S1) 1.3361; (P) 1.3424; (R1) 1.3482; More...
Intraday bias in GBP/USD remains neutral and focus stays on on 1.3369 support. Decisive break there will suggests that it's already correcting the rise from 1.2099. Deeper fall should then be seen to 1.3138 cluster support (38.2% retracement of 1.2099 to 1.3787 at 1.3142). Nevertheless, strong rebound from current level will retain near term bullishness. Break of 1.3561 support turned resistance will bring retest of 1.3787 high first.
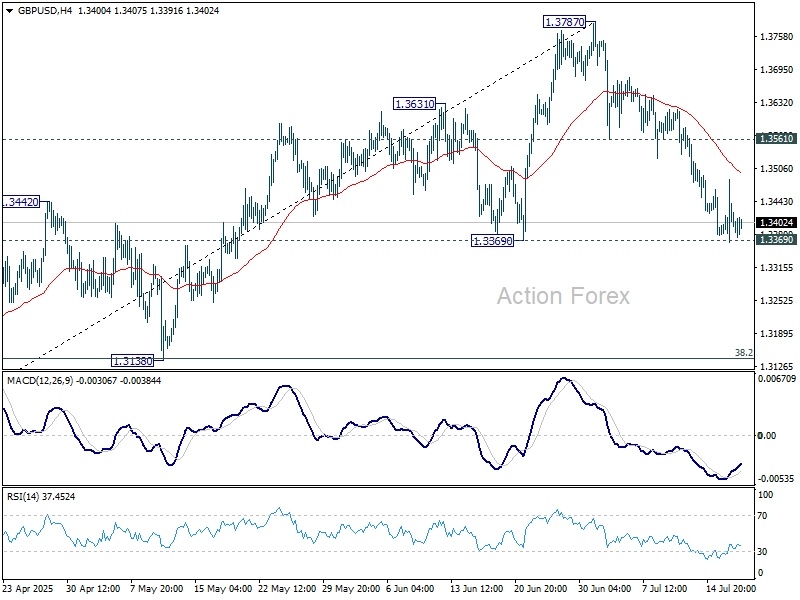
In the bigger picture, up trend from 1.3051 (2022 low) is in progress. Next medium term target is 61.8% projection of 1.0351 to 1.3433 from 1.2099 at 1.4004. Outlook will now stay bullish as long as 55 W EMA (now at 1.3019) holds, even in case of deep pullback.
USD/CHF Mid-Day Outlook
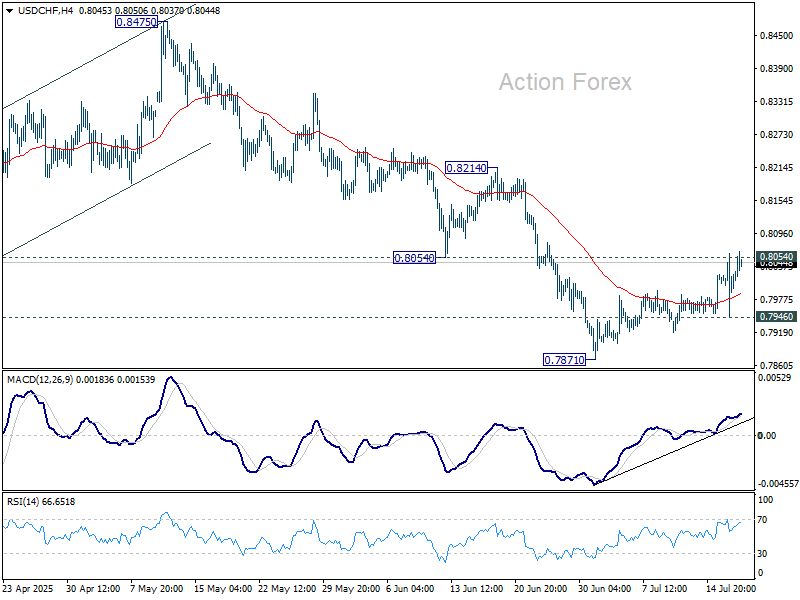
Daily Pivots: (S1) 0.7950; (P) 0.8006; (R1) 0.8065; More….
No change in USD/CHF's outlook. Intraday bias stays neutral with focus on 0.8054 support turned resistance. Decisive break there will suggest that it's at least correcting the fall from 0.8475. Further rise should then be seen to 55 D EMA (now at 0.8151). Nevertheless, rejection by 0.8054 will retain near term bearishness. Below 0.7946 minor support will bring retest of 0.7871 low.
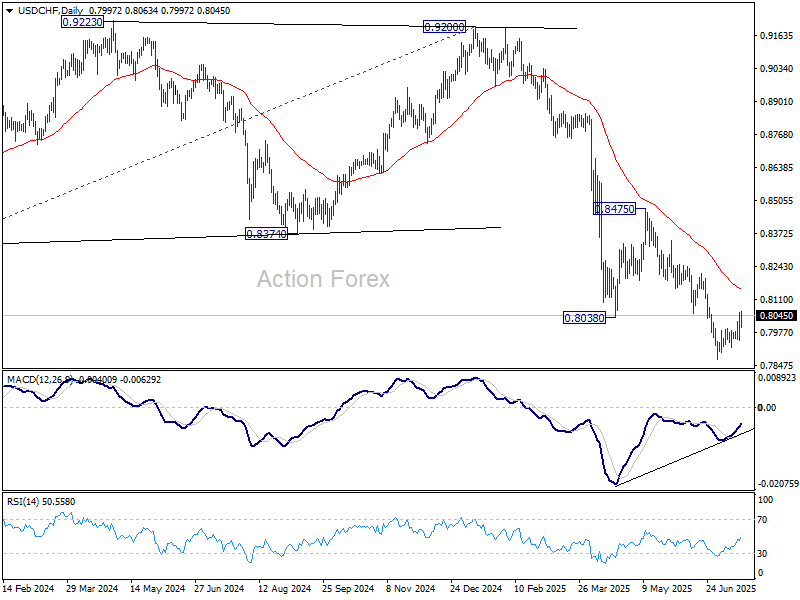
In the bigger picture, long term down trend from 1.0342 (2017 high) is still in progress. Next target is 100% projection of 1.0146 (2022 high) to 0.8332 from 0.9200 at 0.7382. In any case, outlook will stay bearish as long as 0.8475 resistance holds.
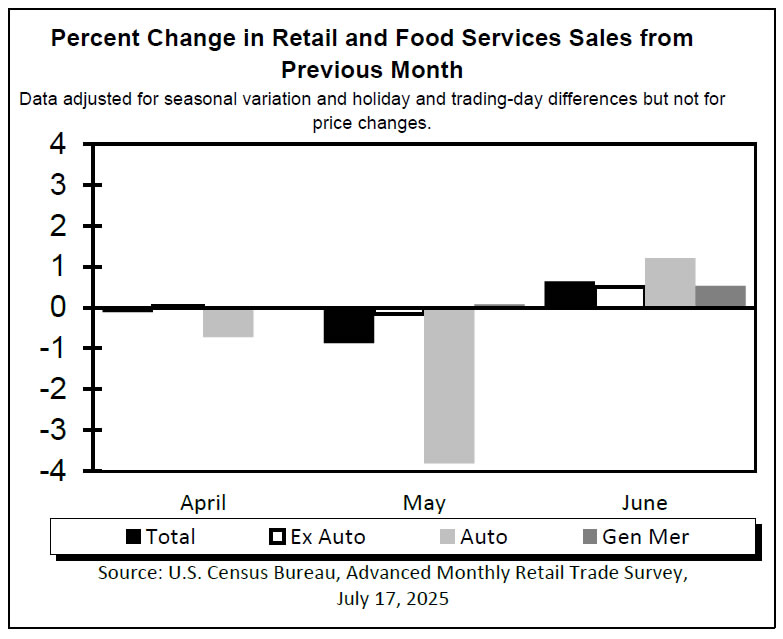
US: Retail Sales Rebound in June
After moving lower in April and May, retail and food services sales rebounded in June rising by 0.6% month-on-month (m/m) – well ahead of expectations for 0.1% gain.
Following two consecutive monthly declines, sales of motor vehicles & parts rose 1.2% m/m. Ditto for sales of building materials, garden equipment & supplies stores, which also moved higher (+0.9% m/m). Sales at gasoline stations were flat.
Sales in the "control group", which excludes the three volatile components mentioned above (i.e., autos, gasoline and building supplies) rose by 0.5% on the month, and were up 4% from the year-ago. Sales were higher across all categories, other than home furniture and electronics & appliance stores (-0.1% m/m). Miscellaneous store retailers led the way with sales up 1.8% on the month, followed by clothing & accessories stores and health & personal care stores.
Sales at bars and restaurants – the only service category in the report – rebounded by 0.6% reversing the slight decline in May, which is much smaller following revisions (-0.1% up from -0.9% reported previously).
Key Implications
After two consecutive monthly declines, retail spending rebounded in June, with sales rising across most categories. Notably, sales at bars and restaurants increased, and May’s decline now appears smaller following data revisions. The improvement in sales coincides with recent signs of stabilization in consumer confidence. Although still at a low level, sentiment has steadied in recent weeks as economic uncertainty eased somewhat, financial markets recovered, gas prices declined, and the labor market continued to churn out jobs.
Inflation too has so far not reared its head, easing concerns about the immediate impact of tariffs on consumer prices. However, we anticipate that tariff-related effects will become more visible in the coming months. June's inflation data already indicates emerging price pressures in categories such as home furnishings, recreational goods, and apparel—areas where tariffs are having a notable impact. While so far many businesses have tried to absorb higher costs and shield consumers, we expect greater pass through of tariff-related price increases over the summer. The outlook for consumer spending in the months ahead will largely depend on the extent of these price hikes.
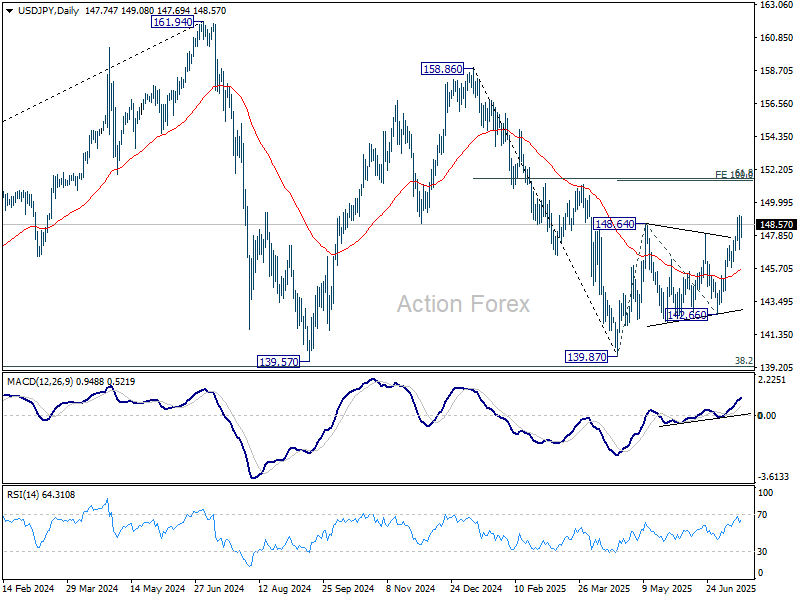
USD/JPY Mid-Day Outlook
Daily Pivots: (S1) 146.80; (P) 148.00; (R1) 149.08; More...
Intraday bias in USD/JPY stays neutral and more consolidations could be seen below 149.17. Downside should be contained by 55 D EMA (now at 145.56). Break of 149.17 will resume the whole rise from 139.87 to 100% projection of 139.87 to 148.64 from 142.66 at 151.43. That is close to 61.8% retracement of 158.86 to 139.87 at 151.22.
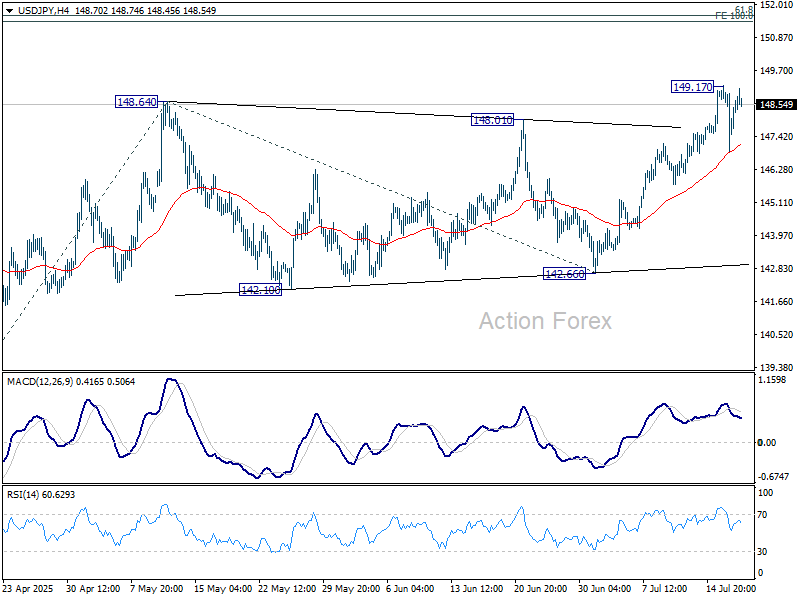
In the bigger picture, price actions from 161.94 (2024 high) are seen as a corrective pattern to rise from 102.58 (2021 low). There is no clear sign that the pattern has completed yet. But still, strong support is expected from 38.2% retracement of 102.58 to 161.94 at 139.26 to bring rebound.
Dollar Holds Firm on Solid Data, Aussie Lags After Jobs Miss, Japan Steps Up Tariff Talks
Dollar remains broadly firm in early US session after a round of stronger-than-expected data reaffirmed the resilience of the US economy. However, gains are being capped as traders digest lingering political risks, including uncertainty over the status of Fed Chair Jerome Powell, and wait for further clarity from upcoming sentiment data. U.S. futures are flat, reflecting a more cautious tone across broader markets.
The Powell firing speculation has temporarily faded, following President Trump's denial. Still, the issue could re-emerge at any moment, making it a latent risk for Dollar bulls. That’s prompting traders to hesitate before chasing the greenback higher despite the solid economic prints. Meanwhile, tomorrow's University of Michigan consumer sentiment and inflation expectations data will be closely watched for signs of how Trump’s renewed tariff campaign is starting to impact consumers.
In FX rankings this week so far, Dollar is the top performer, followed by Loonie and Sterling. At the bottom end, Aussie has slumped following soft jobs data that prompted markets to price in a higher chance of an RBA rate cut in August. Kiwi and Swiss Franc are also underperforming, while Euro and Yen sit in the middle of the pack.
On the trade front, Japan is accelerating efforts to avoid a damaging 25% US tariff due to take effect August 1. Japan’s top trade negotiator Ryosei Akazawa spoke with U.S. Commerce Secretary Howard Lutnick today in a call described by Tokyo as substantive. Talks will continue, and Japan has reaffirmed its desire to strike a deal without compromising its core economic interests.
Japanese Prime Minister Ishiba is scheduled to meet U.S. Treasury Secretary Scott Bessent in Tokyo on Friday. The meeting will coincide with Bessent’s visit to Osaka for the national day at the World Expo. Akazawa will also attend and host the US delegation. Diplomatic channels are clearly active, but time is running short before tariffs take hold.
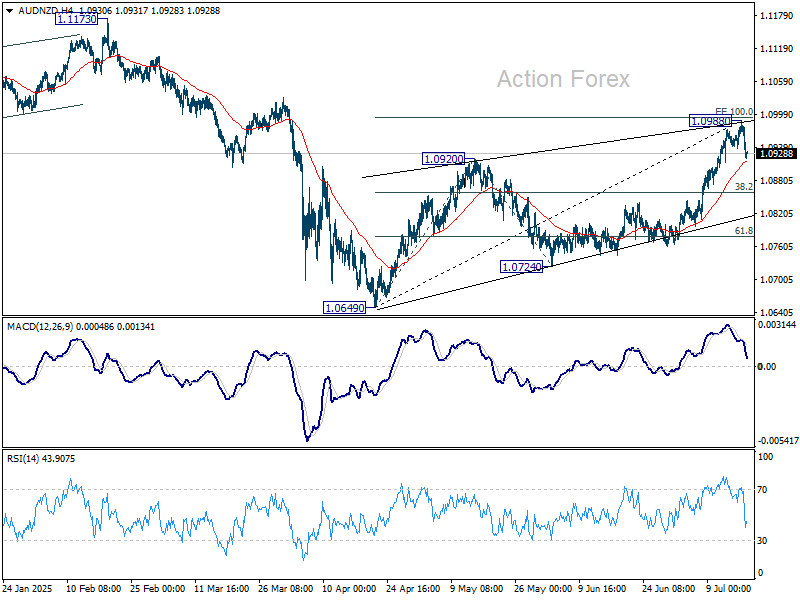
Technically, for AUD/NZD, focus is on 55 4H EMA (now at 1.0914) with today's decline. Sustained break there should confirm short term topping at 1.0988, after missing 100% projection of 1.0649 to 1.0920 from 1.0724 at 1.0995. Deeper fall should then be seen to 38.2% retracement of 1.0649 to 1.0988 at 1.0859. Further break there will argue that rise from 1.0649 has completed as a three-wave corrective move.
In Europe, at the time of writing, FTSE is up 0.41%. DAX is up 1.08%. CAC is up 1.12%. UK 10-year yield is up 0.023 at 4.663. Germany 10-year yield is down -0.002 at 2.693. Earlier in Asia, Nikkei rose 0.60%. Hong Kong HSI fell -0.08%. China Shanghai SSE rose 0.37%. Singapore Strait Times rose 0.71%. Japan 10-year JGB yield fell -0.017 to 1.559.
US retail sales rise 0.6% mom in June, ex-auto sales up 0.5% mom
US retail sales rose 0.6% mom to USD 7201.B in June, well above expectation of 0.2% mom. Ex-auto sales rose 0.5% mom to USD 583.3B, above expectation of 0.3% mom. Ex-gasoline sales rose 0.7% mom to USD 669.8B. Ex-auto& gasoline sales rose 0.6% mom to USD 533.0B. Total sales for the April through June period were up 4.1% from the same period a year ago.
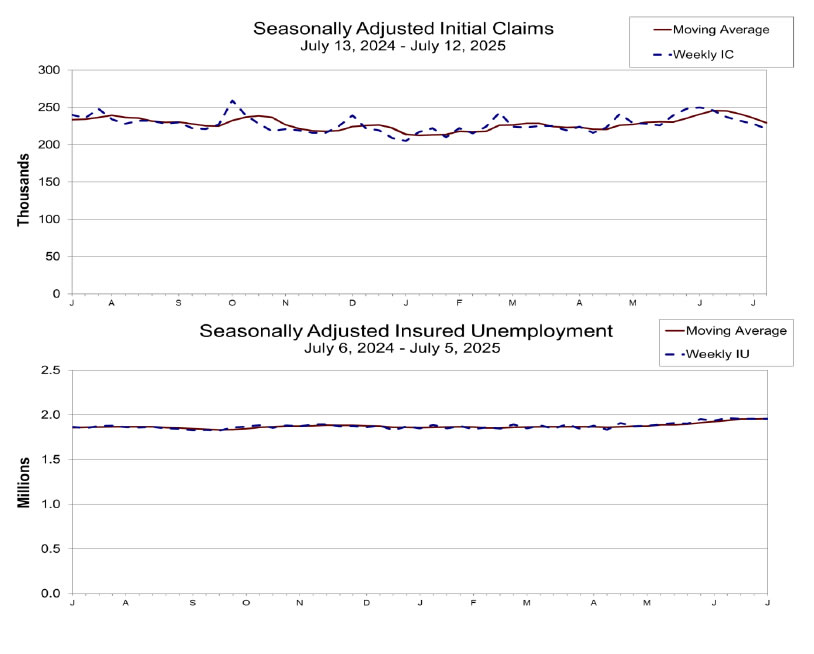
US initial jobless claims fall to 221k vs exp 234k
US initial jobless claims fell -7k to 221k in the week ending July 12, below expectation of 234k. Four-week moving average of initial claims fell -6k to 230k. Continuing claims rose 2k to 1956k. Four-week moving average of continuing claims rose 5k to 1958k, highest since November 20, 2021.
Eurozone CPI finalized at 2% in June, services remain main driver
Eurozone CPI was finalized at 2.0% yoy in June, slightly higher than May’s 1.9% yoy. Core CPI (ex energy, food, alcohol & tobacco) held steady at 2.3% for the second straight month.
Services contributed the bulk of annual Eurozone inflation (+1.51 percentage points), followed by food, alcohol and tobacco (+0.59 pp). Energy continued to exert a mild drag, subtracting -0.25 pp.
At the broader EU level, CPI rose to 2.3% yoy from 2.2% yoy the prior month. Cyprus and France saw sub-1% inflation, while Eastern European nations led the upside—Romania at 5.8% and Estonia at 5.2%. Inflation rose in 22 out of 27 EU states.
UK payrolled employment slips again, wage growth slows further
UK payrolled employment fell by -41k in June, marking a second straight monthly contraction. Though May’s drop was revised to a milder -24k from an initial -109k, the overall picture still points to a softening labor market. Claimant count rose more than expected by 25.8k. Unemployment rate in the three months to May edged higher from 4.6% to 4.7%.
Wage growth also lost some momentum, with median monthly pay rising 5.6% yoy in June, down from May’s 5.7% yoy. Average earnings growth in the three months to May slowed to 5.0% both with and without bonuses, with the latter still slightly hotter than the 4.9% expected.
Aussie unemployment rate surges to 4.3% as full-time jobs slide
Australia’s June jobs report came in well short of expectations, with only a 2k increase in employment and a sharp divergence between full-time and part-time work. Full-time employment plunged by -38.2k while part-time roles rose 40.2k. Unemployment rate rose to 4.3%, defying forecasts for it to hold at 4.1%, while participation rate remained unchanged at 67.0%.
According to the ABS, the rise in joblessness was driven by a 34k increase in the number of unemployed Australians. ABS labor head Sean Crick added that full-time hours worked declined -1.3% in the month, suggesting further weakness ahead. Despite a marginal rise in total hours worked of 0.1% mom, the data add to signs that the labor market is losing momentum.
Japan auto exports to US plunge -26.7% yoy as carmakers cut prices
Japan logged a trade surplus of JPY 153B in June, with exports down -0.5% yoy and imports up 0.2% yoy. The most striking detail was a sharp -11.4% yoy drop in exports to the US, the steepest decline since February 2021. Imports from the US also fell, declining -2.0% yoy.
Automobile shipments to the US fell -26.7% by value, while auto parts (-15.5% yoy) and pharmaceuticals (-40.9% yoy) also saw double-digit drops. Still, a 3.4% yoy rise in car export volumes suggests Japanese automakers are slashing prices and absorbing costs to maintain market share.
On a seasonally adjusted basis, exports dipped -0.4% mom while imports fell -1.0%, leaving a JPY 235B trade deficit.
The report comes just weeks before a 25% reciprocal US tariff on Japanese goods takes effect on August 1. That is one percentage point higher than the 24% rate first announced on "Liberation Day" in April.
USD/JPY Mid-Day Outlook
Daily Pivots: (S1) 146.80; (P) 148.00; (R1) 149.08; More...
Intraday bias in USD/JPY stays neutral and more consolidations could be seen below 149.17. Downside should be contained by 55 D EMA (now at 145.56). Break of 149.17 will resume the whole rise from 139.87 to 100% projection of 139.87 to 148.64 from 142.66 at 151.43. That is close to 61.8% retracement of 158.86 to 139.87 at 151.22.
In the bigger picture, price actions from 161.94 (2024 high) are seen as a corrective pattern to rise from 102.58 (2021 low). There is no clear sign that the pattern has completed yet. But still, strong support is expected from 38.2% retracement of 102.58 to 161.94 at 139.26 to bring rebound.
US initial jobless claims fall to 221k vs exp 234k
US initial jobless claims fell -7k to 221k in the week ending July 12, below expectation of 234k. Four-week moving average of initial claims fell -6k to 230k.
Continuing claims rose 2k to 1956k. Four-week moving average of continuing claims rose 5k to 1958k, highest since November 20, 2021.
US retail sales rise 0.6% mom in June, ex-auto sales up 0.5% mom
US retail sales rose 0.6% mom to USD 7201.B in June, well above expectation of 0.2% mom. Ex-auto sales rose 0.5% mom to USD 583.3B, above expectation of 0.3% mom. Ex-gasoline sales rose 0.7% mom to USD 669.8B. Ex-auto& gasoline sales rose 0.6% mom to USD 533.0B.
Total sales for the April through June period were up 4.1% from the same period a year ago.
Ethereum (ETHUSD) Elliott Wave : Bullish Sequences Point to Further Rally
Hello fellow traders. In this technical article, we are going to present Elliott Wave charts of Ethereum ETHUSD . As our members know, ETHUSD has been showing impulsive bullish sequences in the cycle from the 2,115.6 low, pointing to further strength ahead. We have been calling for a rally in ETHUSD since the beginning of July, based on the higher high bullish sequences the crypto was forming.
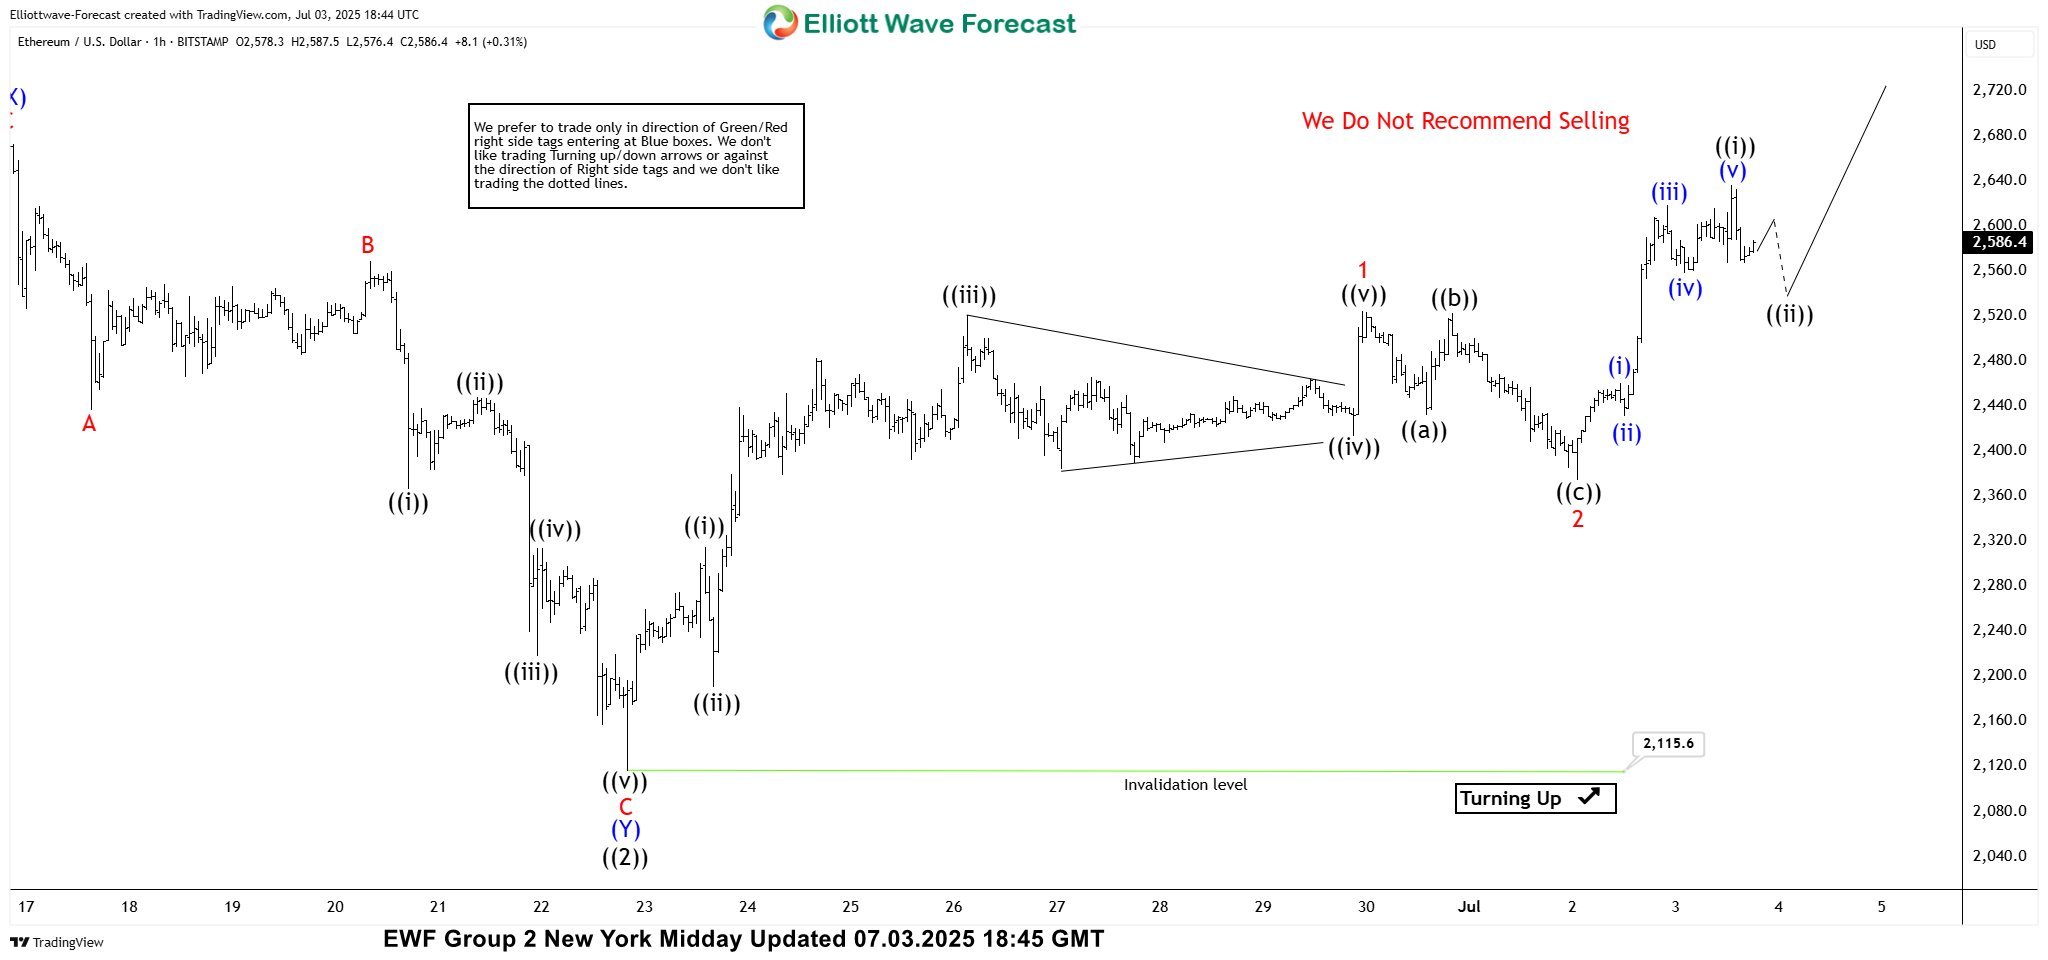
ETHUSD Elliott Wave 1 Hour Chart 07.03.2025
The current analysis suggests that ETHUSD is trading within the cycle from the 2,115.6 low. The price structure is showing higher high bullish sequences. Intraday pullback 2 is counted as completed at the 2,377.5 low. While price stays above that level, we expect further strength in the crypto, within wave 3 red.
As Elliott Wave practitioners know, wave 3 is usually the strongest wave in an impulsive sequence and often reaches the 1.618–2.618 Fibonacci extension of wave 1. In this case, that projects potential targets in the 3,036.5–3,441.1 area.
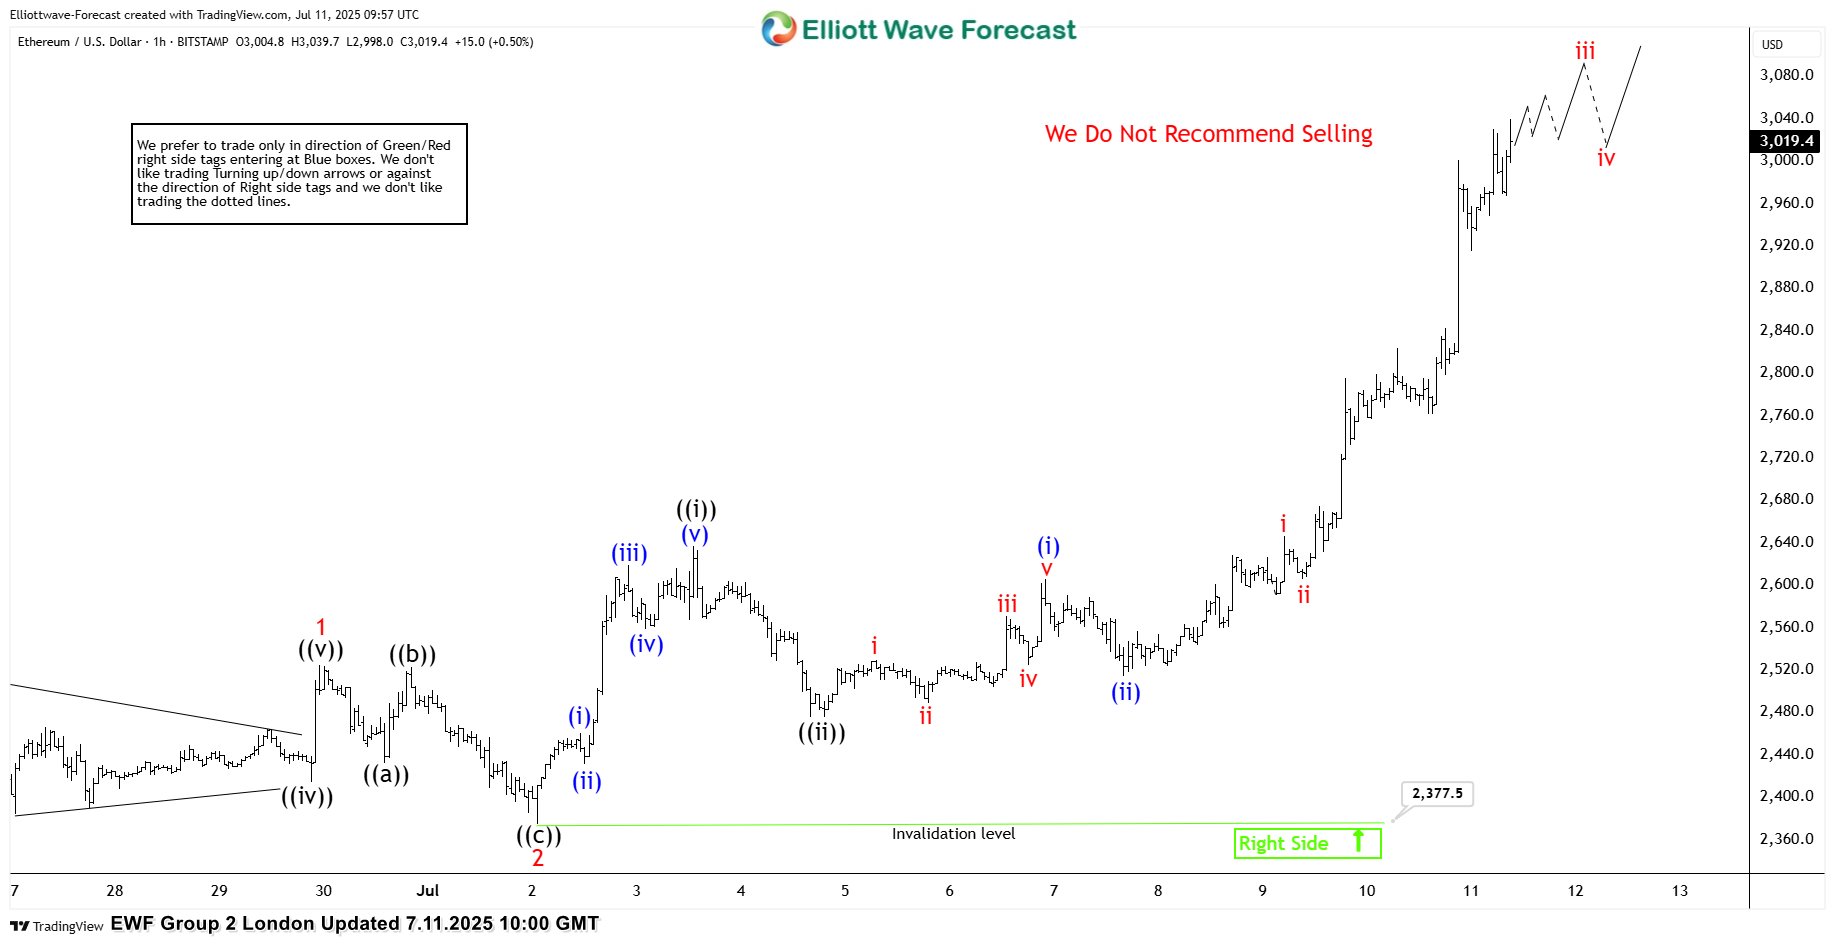
ETHUSD Elliott Wave 1 Hour Chart 07.11.2025
The crypto held above the 2,377.5 low and continued to rally, as expected. The price made a break toward new highs. We do not recommend selling the crypto at this time and favor the long side. Ethereum is reaching our proposed target at 3,036.5–3,441.1 area and should ideally keep trading higher within that zone in upcoming days.