Sample Category Title
GBP/USD Rate Falls to Key Support Level
As of today, the GBP/USD chart indicates that the British pound has declined by more than 2% against the US dollar since the beginning of July. Notably, the pace of the decline accelerated on Friday and continued into Monday.
According to Reuters, the pound is under pressure due to market concerns over a potential economic slowdown amid an escalating trade war. Last week’s data confirmed a contraction in UK GDP, which could have far-reaching implications. In this context, criticism of the UK government’s failure to reduce public spending is becoming more pronounced.
What’s next for GBP/USD?
Technical Analysis of the GBP/USD Chart
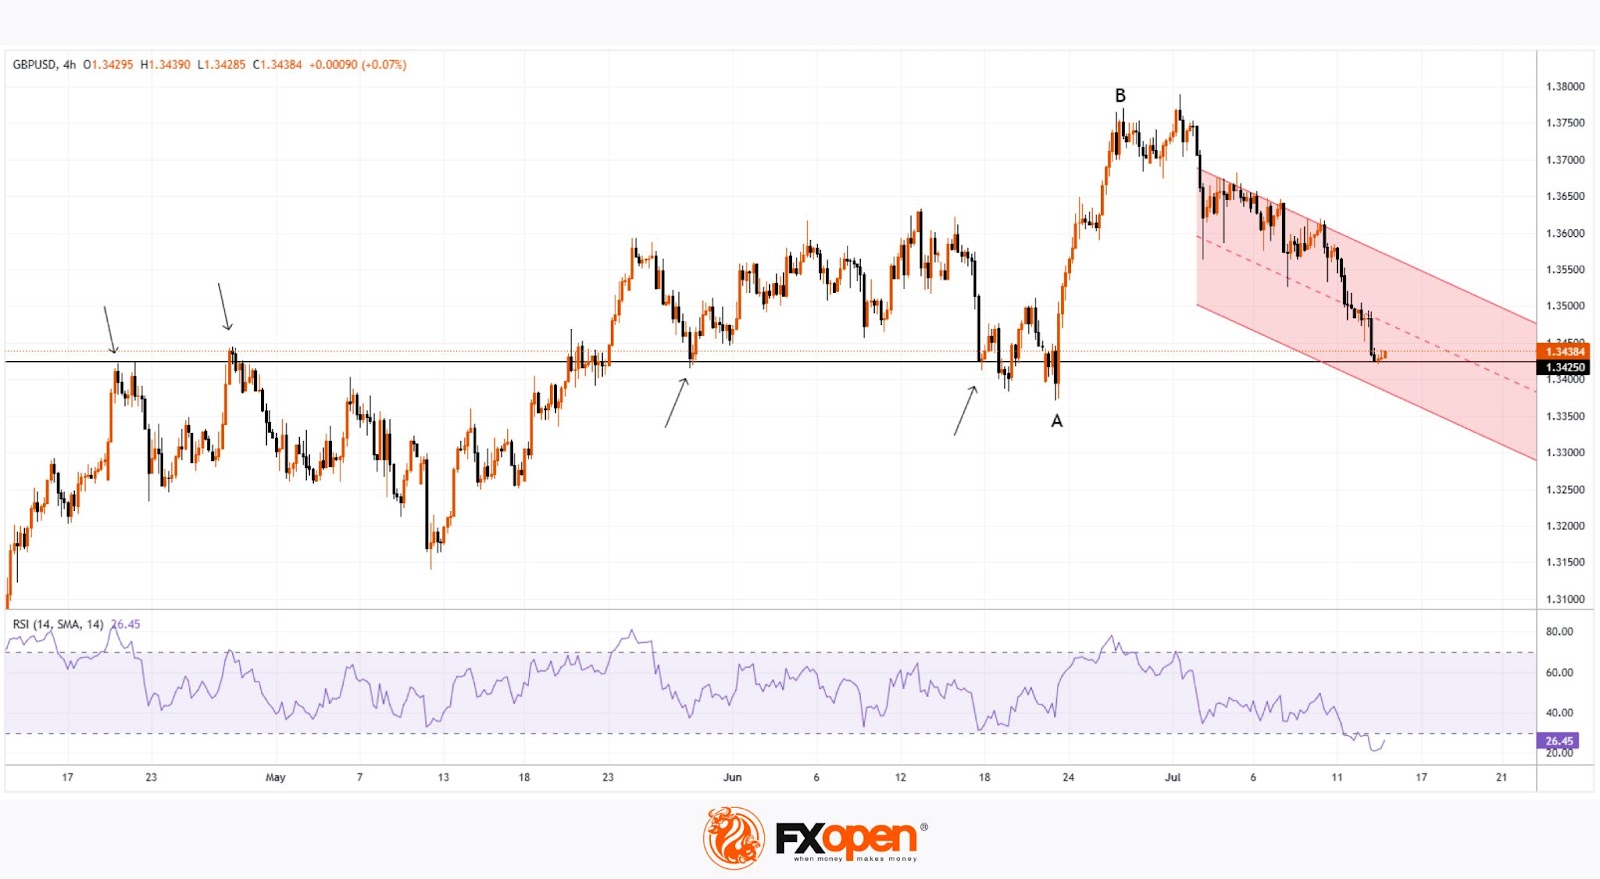
From a bullish perspective, it is worth noting that the pair has fallen to a significant support level around 1.3425. This level previously acted as resistance in the spring, but after a breakout, it has now turned into support (as indicated by arrows on the chart). Additionally, the RSI indicator shows strong oversold conditions, which suggests a potential short-term rebound.
From a bearish standpoint, it is concerning that the sharp rally from point A to point B has been entirely erased by the July decline. This indicates that despite significant gains by the bulls, they failed to hold them—casting doubt on GBP/USD's ability to sustain growth in the medium term.
Ongoing pressure may lead to an attempt by bears to push GBP/USD below the June low at point A. However, it is also possible that bearish momentum will weaken thereafter, potentially leading to a recovery within the developing downward channel (marked in red).
Trade over 50 forex markets 24 hours a day with FXOpen. Take advantage of low commissions, deep liquidity, and spreads from 0.0 pips. Open your FXOpen account now or learn more about trading forex with FXOpen.
This article represents the opinion of the Companies operating under the FXOpen brand only. It is not to be construed as an offer, solicitation, or recommendation with respect to products and services provided by the Companies operating under the FXOpen brand, nor is it to be considered financial advice.
Gold Holds Steady But Could Rise on Tariff Developments
The price of gold remains stable at $3,354 per troy ounce this Tuesday, recovering some of the previous day’s losses. Market attention remains firmly fixed on US trade policy developments.
President Donald Trump has formally notified leaders from 25 countries of new tariffs, including a 30% levy on imports from the EU and Mexico, set to take effect on 1 August. Trump warned that nations responding with retaliatory measures could face even stricter US restrictions, though he left room for further negotiations before the tariffs are imposed.
Investors are now awaiting the release of the US Consumer Price Index (CPI) for July, which may offer fresh clues on the Federal Reserve’s next steps regarding interest rates.
While physical gold demand remains steady, central bank purchases continue to provide strong strategic support for prices. Meanwhile, the US dollar’s trajectory is having little immediate impact on gold’s movements.
Technical Analysis: XAU/USD
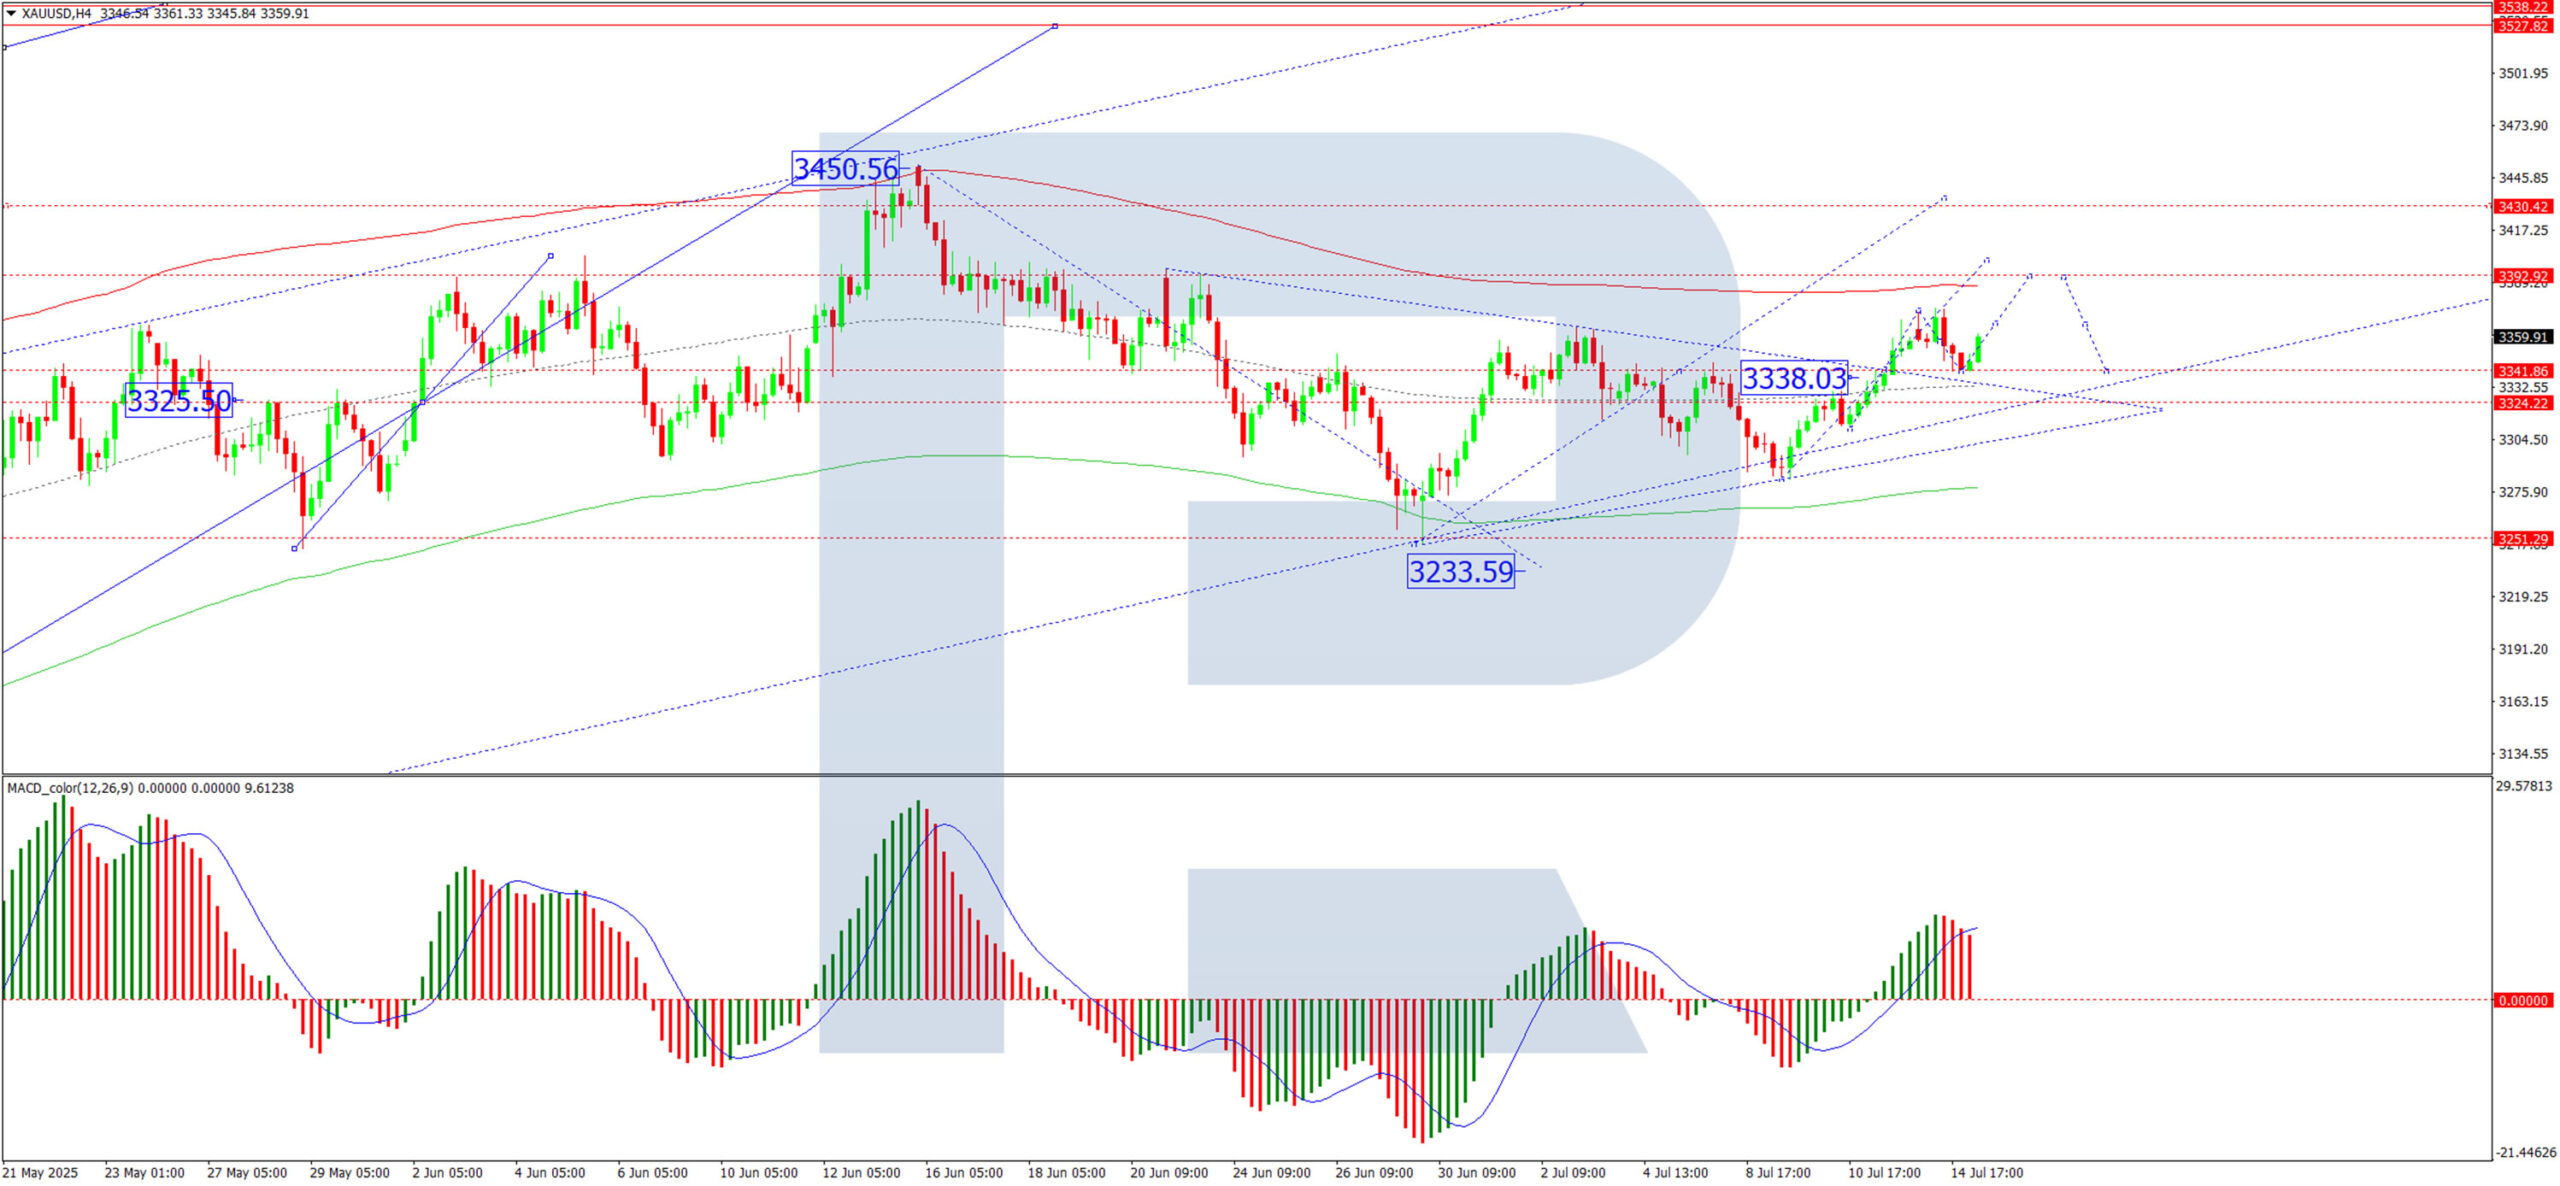
H4 Chart:
On the H4 chart, XAU/USD broke above the 3,340 level, hitting its local target of 3,373. Today, the market has seen a technical pullback to 3,340 (testing from above) before initiating a new upward wave towards 3,400. Once this wave concludes, we anticipate a corrective retracement to 3,340, followed by a potential further rise to 3,434. This scenario is supported by the MACD indicator, where the signal line remains above zero and pointing firmly upwards.
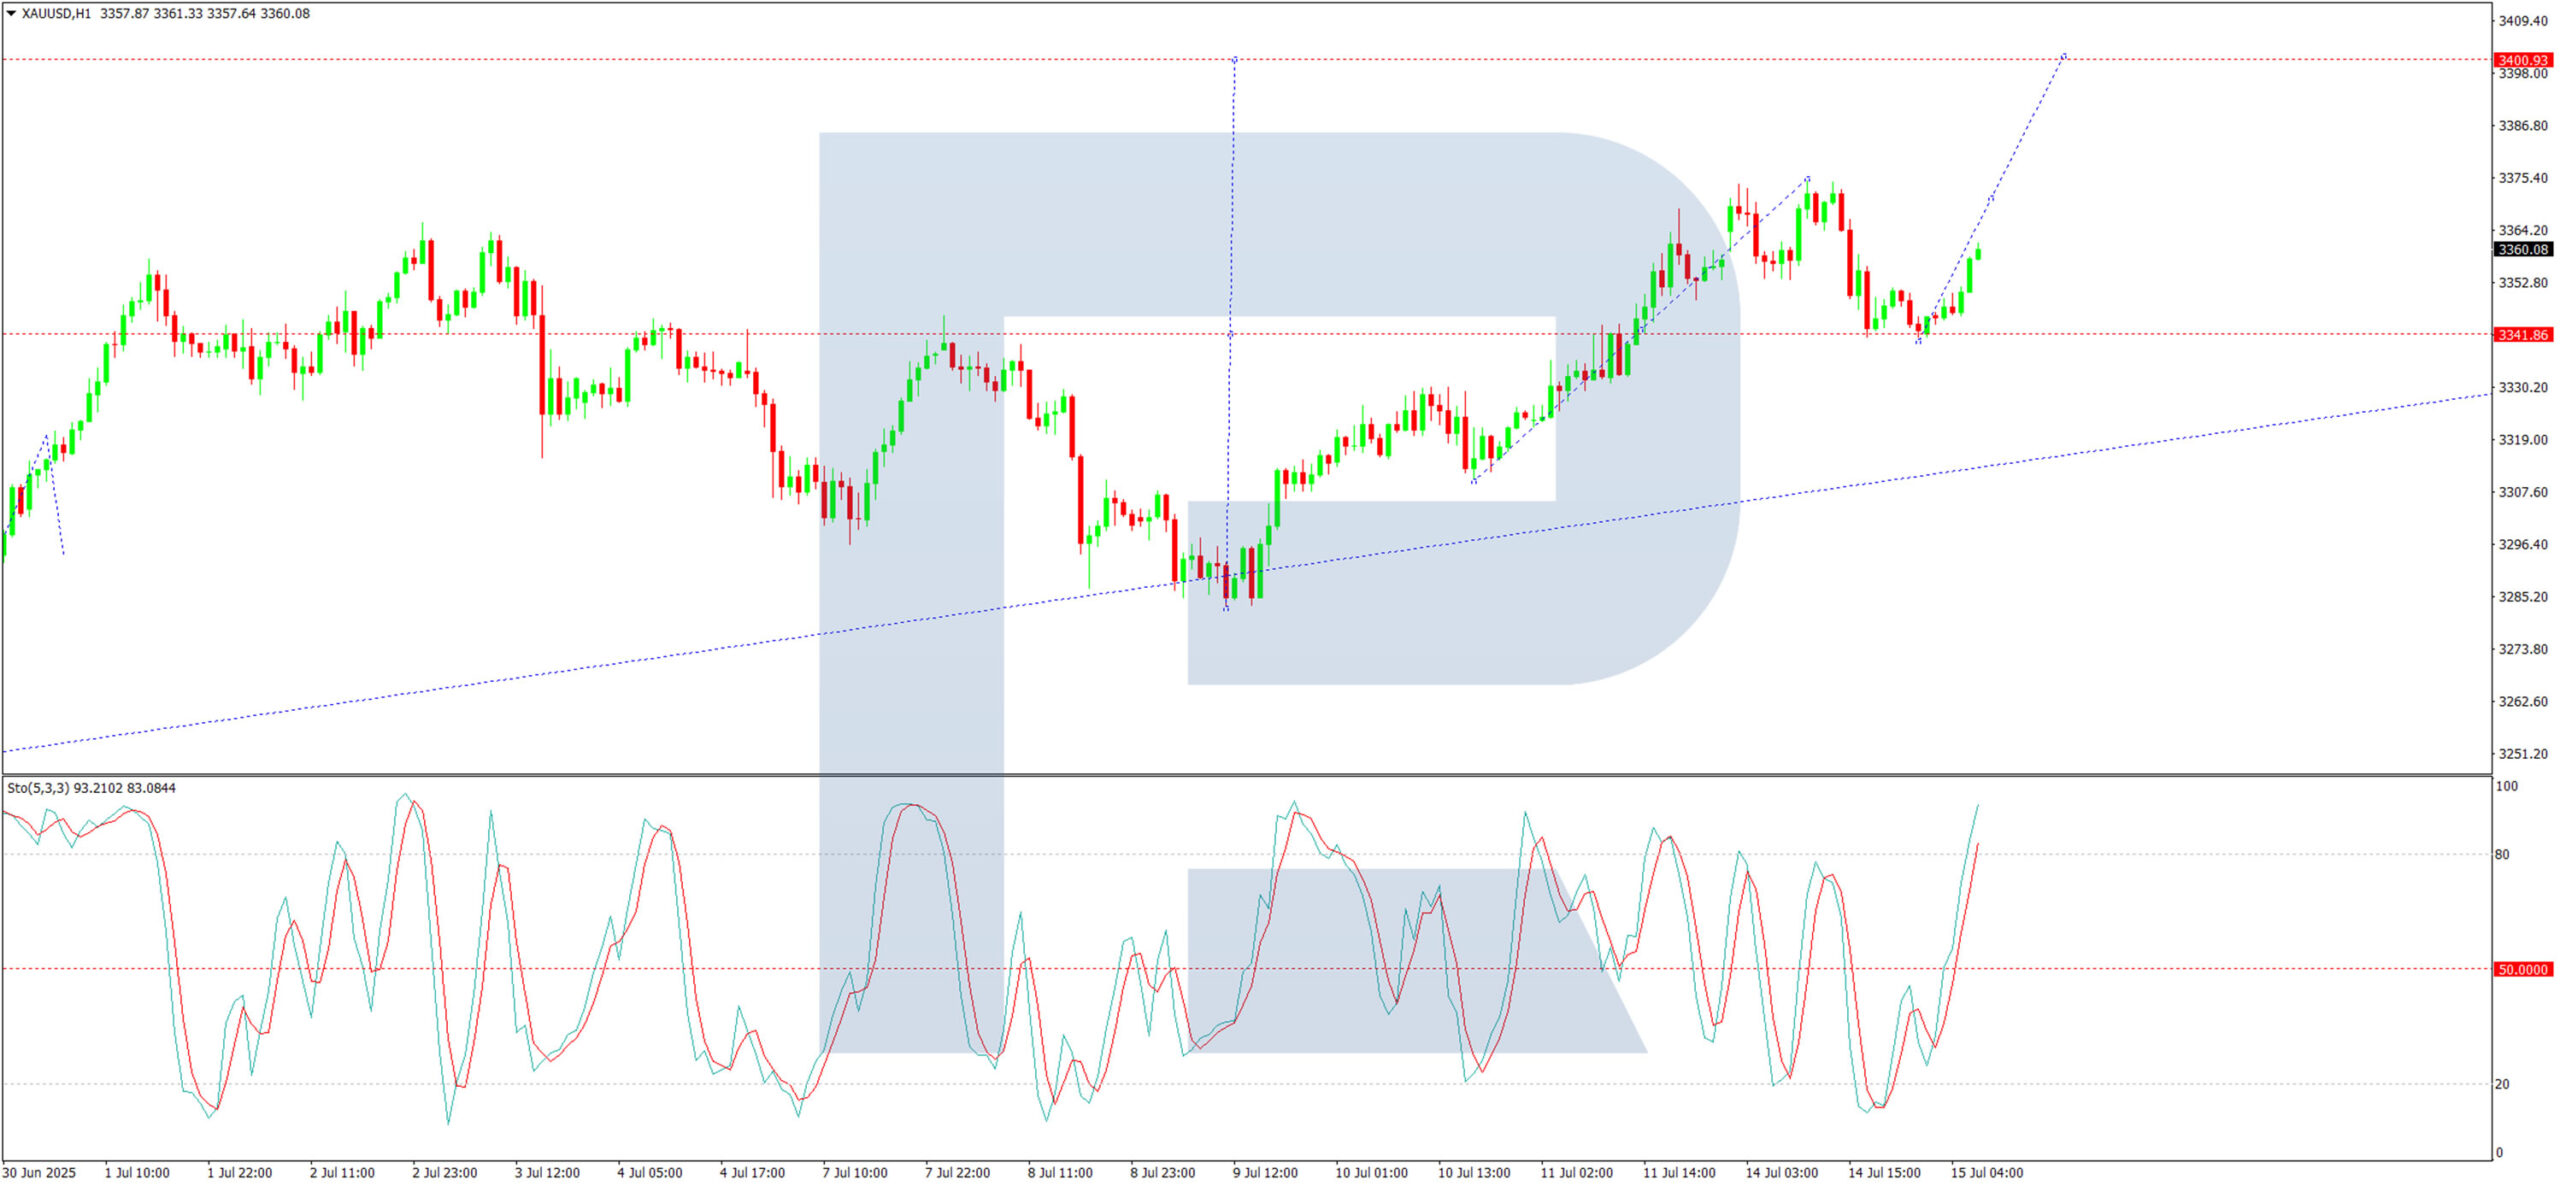
H1 Chart:
On the H1 chart, the correction to 3,340 has completed, and the next growth wave towards 3,400 is underway. Today, we expect an advance to 3,370, after which a brief consolidation phase may form. A breakout above this range would reinforce bullish momentum towards 3,400. The Stochastic oscillator aligns with this outlook, with its signal line above 50 and rising sharply towards 80.
Conclusion
Gold’s near-term trajectory hinges on trade policy shifts and US economic data, while technical indicators suggest further upside potential after consolidation.
US Yield Curve Showed Some Gentle Bear Steepening
Markets
The US 30-yr yield was a whisker away from touching the psychological 5% mark yesterday as Friday’s tariff-driven sell-off in US Treasuries slowed. Still the US yield curve showed some gentle bear steepening with daily yield changes ranging between +1.4 bps (2-yr) and +2.8 bps (30-yr). The jury is still out with June US CPI inflation numbers up for release today. It’s the first of three “Summer” prints ahead of the September FOMC meeting which Fed Chair Powell referred to as key in determining the impact of US tariffs on price levels (higher or lower) and the Fed’s reaction function (cutting sooner rather than later). Consensus expects both headline and core CPI to accelerate to 0.3% M/M (2.6% Y/Y & 2.9% Y/Y respectively). Energy and food prices are expected to contribute positively, but attention will center on the pace of goods price inflation (clothing, furniture, toys, cars,…) as more and more firms hinted at passing through costs to consumers after initially shielding them by running down inventories or lowering margins. From a market point of view, anything in line or below market consensus will be seen as evidence of a subdued impact from tariffs, tipping the balance on the US money market further in the direction of a September Fed rate cut (currently 60% discounted). It can pull the US 2-yr yield back from 3.9% currently to this month’s low around 3.75% and halt the modest comeback of the dollar we’ve witnessed over the past couple of trading sessions. An upward beat can start moving the market needle to a first rate cut in December (currently almost two discounted) and push the front end of the curve back towards 4%, giving the dollar some additional backing. We expect the impact at the long end of the (US) yield curve to be bigger in the second (upside) scenario than in the first one given the lingering trade war and the structural deterioration in public finances stemming from Trump’s big beautiful bill. Both the Japanese 10-yr and 30-yr yield this morning tested the YtD high at respectively 1.6% and 3.2%.
Apart from US inflation numbers, we keep an eye at Bank of England governor Bailey’s Mansion House Speech tonight after market close. Previous BoE governors used that annual occasion in the past to announce a change of course. Bailey recently warned about signs of slack in the economy and a weakening labour market and tied that in a weekend interview with potential action by the BoE (switching to larger rate cuts). UK Gilts yesterday outperformed, especially at the front end of the curve, pulling sterling down. EUR/GBP is close to recording 0.87+ levels for only the second session since end 2023. The YtD top at 0.8738 and is a first target.
News & Views
The Chinese economy grew by 1.1% Q/Q and 5.2% Y/Y in the second quarter, from 1.2% Q/Q and 5.4% Y/Y in Q1 and slightly beating consensus estimates. YTD growth was reported at 5.3% compared to the same period last year. The monthly data published for June indicated better than expected production growth at 6.8% Y/Y (6.3% YTD) suggesting a still solid supply-side performance. At the same time, retail sales growth was weaker than expected at 4.8% Y/Y (5% YTD). Fixed asset investment slowed to 2.8%Y/Y from 3.8%. Property investment was 11.2% lower than in the same month last year. The external sector contributed positively to growth as exports rose 7.2% YTD, while imports declined 2.7%. The surveyed jobless rate remained unchanged at 5%. The data confirm the ongoing discrepancy between a solid/decent production & export-driven growth and lagging domestic demand in a context of deflation. In this respect new home prices declined by 0.27% M/M and 3.69% Y/Y. As trade tensions are likely to put pressure on exports going forward, the data support the case for further (targeted) stimulus of domestic demand. The yuan eases slightly this morning (USD/CNY 7.175).
The Czech Finance Minister yesterday gave a first assessment on the potential impact of the 30% tariff on EU imports by the US on Czech growth. Such a scenario might reduce this year’s growth by 0.4% from August and by 1.1 ppts in 2026, bringing growth at respectively 1.6% and 1.3%. Finance Minister Stanjura admitted that exports to the US only account for less than 3% of total exports, but the Czech economy will also be hit indirectly as its economy delivers components and other goods to EU trading partners.
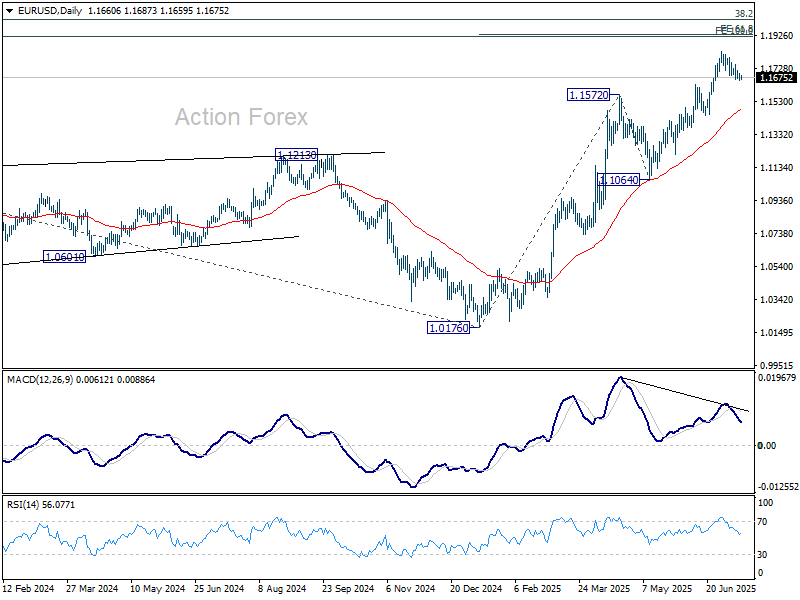
EUR/USD Daily Outlook
Daily Pivots: (S1) 1.1648; (P) 1.1673; (R1) 1.1691; More...
Intraday bias in EUR/USD remains neutral for the moment. Consolidations from 1.1829 could extend further. Downside should be 1.1630 resistance turned support to bring rebound. Firm break of 1.1829 will resume the rise from 1.0176 and target 61.8% projection of 1.0176 to 1.1572 from 1.1064 at 1.1927. However, sustained break of 1.1630 will bring deeper fall to 55 D EMA (now at 1.1481) instead.
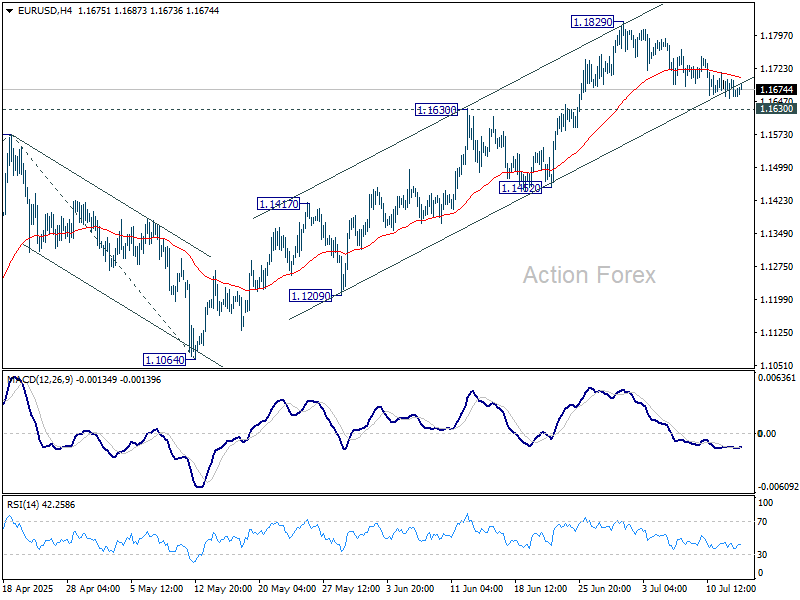
In the bigger picture, rise from 0.9534 long term bottom could be correcting the multi-decade downtrend or the start of a long term up trend. In either case, further rise should be seen to 100% projection of 0.9534 to 1.1274 from 1.0176 at 1.1916. This will now remain the favored case as long as 1.1604 support holds.
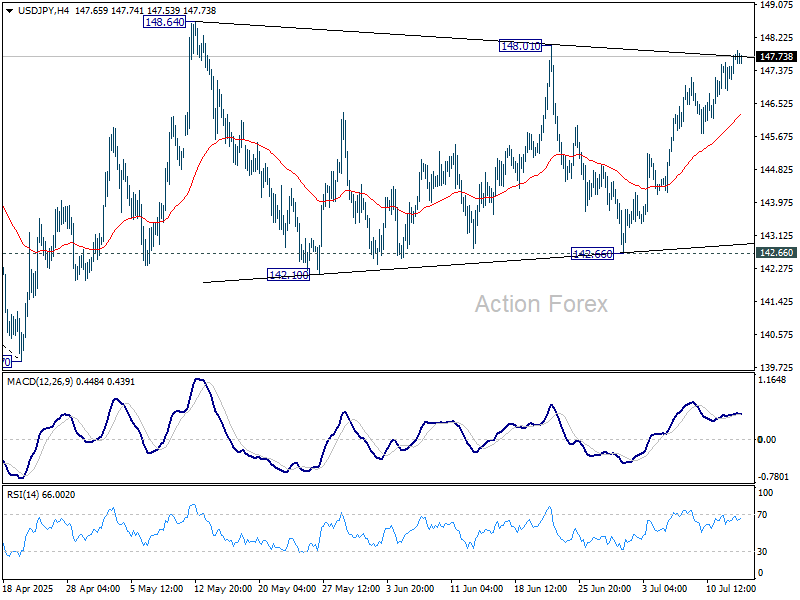
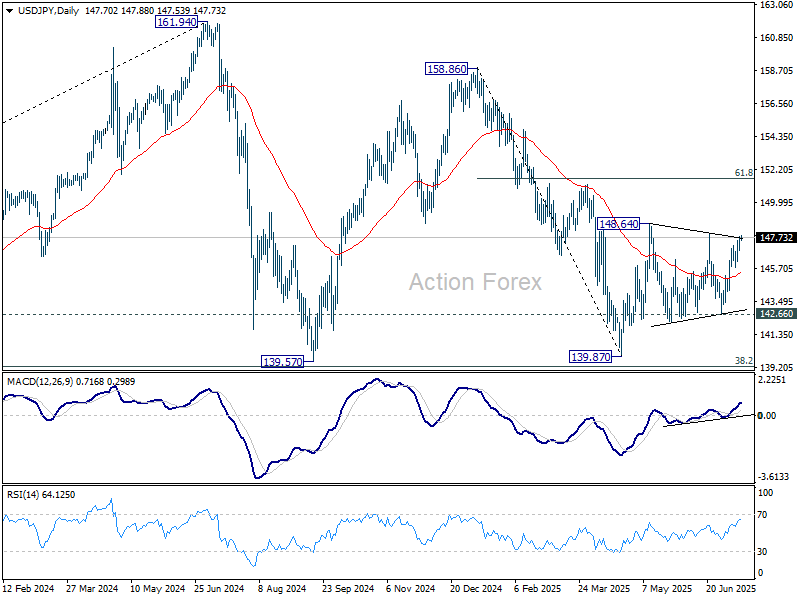
USD/JPY Daily Outlook
Daily Pivots: (S1) 147.13; (P) 147.46; (R1) 148.05; More...
Intraday bias in USD/JPY remains neutral with focus on 148.01 resistance. Firm break there will indicate that consolidations pattern from 148.64 has completed. Further rise should then be seen to resume the rally from 139.87, to 61.8% retracement of 158.86 to 139.87 at 151.22.
In the bigger picture, price actions from 161.94 (2024 high) are seen as a corrective pattern to rise from 102.58 (2021 low). There is no clear sign that the pattern has completed yet. But still, strong support is expected from 38.2% retracement of 102.58 to 161.94 at 139.26 to bring rebound.
GBP/USD Daily Outlook
Daily Pivots: (S1) 1.3396; (P) 1.3454; (R1) 1.3484; More...
Intraday bias in GBP/USD remains neutral. Pullback from 1.3787 could extend lower but downside is expected to be contained by 1.3369 support to bring rebound. On the upside, above 1.3680 minor resistance will bring retest of 1.3787. Firm break of 1.3787 will resume larger up trend to 100% projection of 1.2099 to 1.3206 from 1.3138 at 1.3813. However, firm break of 1.3369 will bring deeper correction back to 1.2706/3206 support zone.
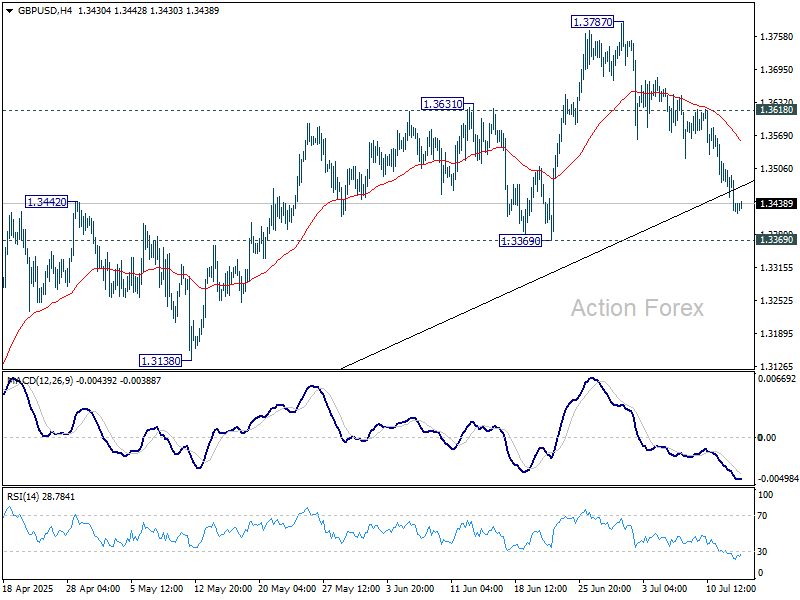
In the bigger picture, up trend from 1.3051 (2022 low) is in progress. Next medium term target is 61.8% projection of 1.0351 to 1.3433 from 1.2099 at 1.4004. Outlook will now stay bullish as long as 55 W EMA (now at 1.3019) holds, even in case of deep pullback.
USD/CHF Daily Outlook
Daily Pivots: (S1) 0.7962; (P) 0.7973; (R1) 0.7992; More….
Intraday bias in USD/CHF remains neutral as consolidations continue above 0.7871. Stronger recovery might be seen but upside should be limited by 0.8054 support turned resistance. On the downside, firm break of 0.7871 will extend the larger down trend to 61.8% projection of 0.9200 to 0.8038 from 0.8475 at 0.7757.
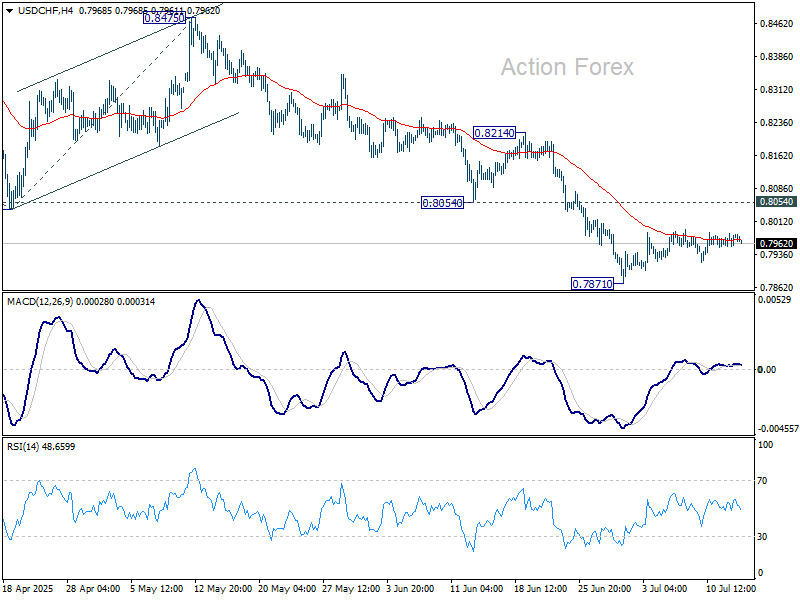
In the bigger picture, long term down trend from 1.0342 (2017 high) is still in progress. Next target is 100% projection of 1.0146 (2022 high) to 0.8332 from 0.9200 at 0.7382. In any case, outlook will stay bearish as long as 0.8475 resistance holds.
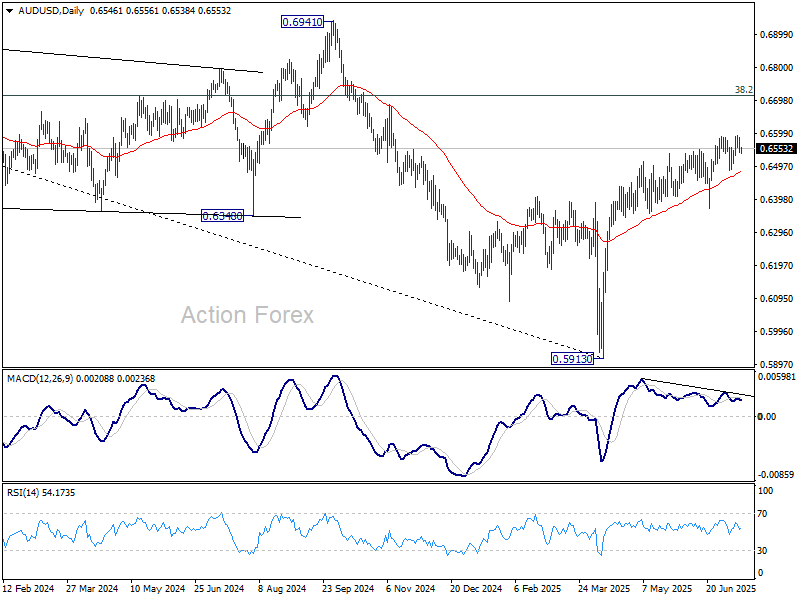
AUD/USD Daily Report
Daily Pivots: (S1) 0.6530; (P) 0.6559; (R1) 0.6575; More...
Intraday bias in AUD/USD remains neutral and more consolidations would be seen below 0.6594. Further rise is expected as long as 0.6484 support holds. Above 0.6594 will resume the rally from 0.5913 and target 0.6713 fibonacci level.
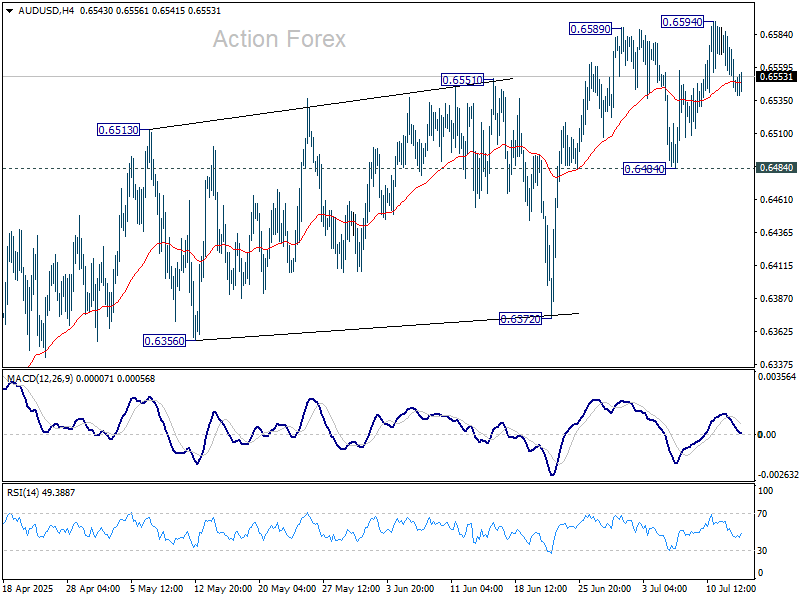
In the bigger picture, there is no clear sign that down trend from 0.8006 (2021 high) has completed. Rebound from 0.5913 is seen as a corrective move. While stronger rally cannot be ruled out, outlook will remain bearish as long as 38.2% retracement of 0.8006 to 0.5913 at 0.6713 holds. Nevertheless, considering bullish convergence condition in W MACD, even in case of another fall through 0.5913, downside should be contained above 0.5506 (2020 low).
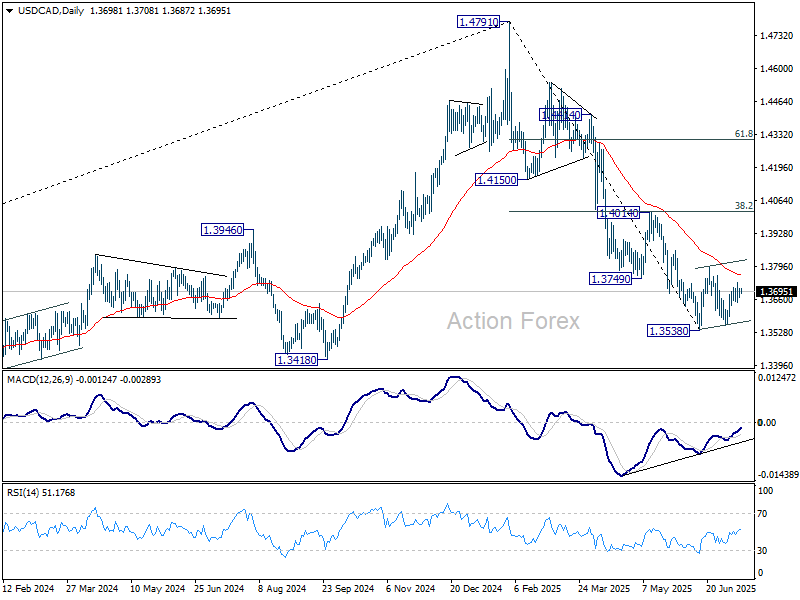
USD/CAD Daily Outlook
Daily Pivots: (S1) 1.3680; (P) 1.3695; (R1) 1.3719; More...
Intraday bias in USD/CAD stays neutral for the moment. Overall, price actions from 1.3538 are seen as a corrective pattern, which is now in its third leg. Stronger rise could be seen and above 1.3728 will target 1.3797 resistance and probably above. On the downside, break of 1.3637 minor support will bring retest of 1.3538/55 support zone.
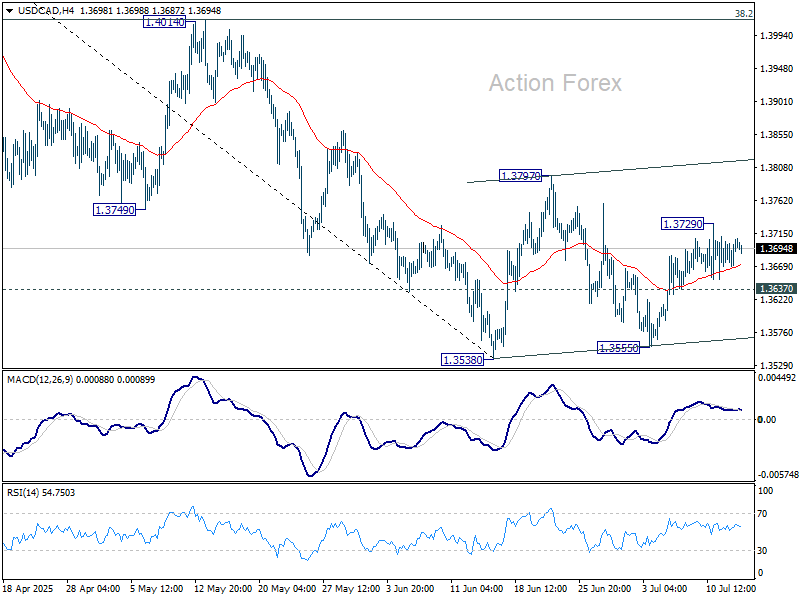
In the bigger picture, price actions from 1.4791 medium term top could either be a correction to rise from 1.2005 (2021 low), or trend reversal. In either case, further decline is expected as long as 1.4014 resistance holds. Next target is 61.8% retracement of 1.2005 (2021 low) to 1.4791 at 1.3069.
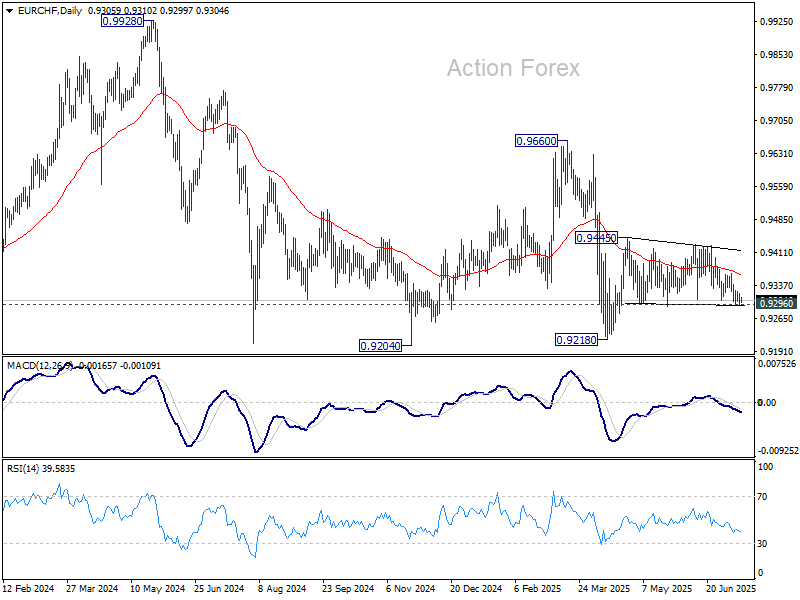
EUR/CHF Daily Outlook
Daily Pivots: (S1) 0.9298; (P) 0.9309; (R1) 0.9322; More....
Intraday bias in EUR/CHF remains neutral for the moment. . On the upside, break of 0.9428/45 resistance zone will resume the rebound from 0.9218. On the downside, firm break of 0.9296 support will bring retest of 0.9218 low instead.
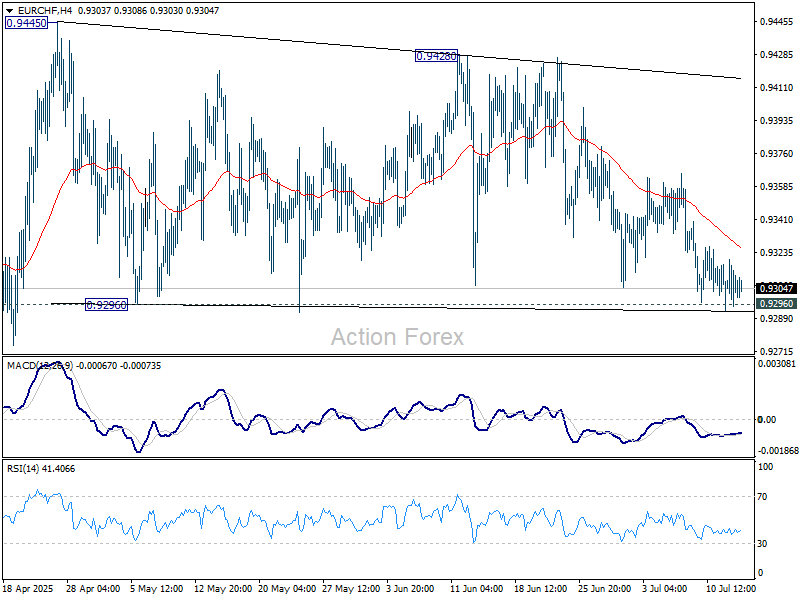
In the bigger picture, while downside momentum has been diminishing as seen in W MACD, there is no sign of bottoming yet. EUR/CHF is still staying below 55 W EMA (now at 0.9437) and well inside long term falling channel. Outlook will stay bearish as long as 0.9660 resistance holds. Break of 0.9204 (2024 low) will confirm resumption of down trend from 1.2004 (2018 high).