
Sample Category Title
USD/JPY Mid-Day Outlook
Daily Pivots: (S1) 147.13; (P) 147.46; (R1) 148.05; More...
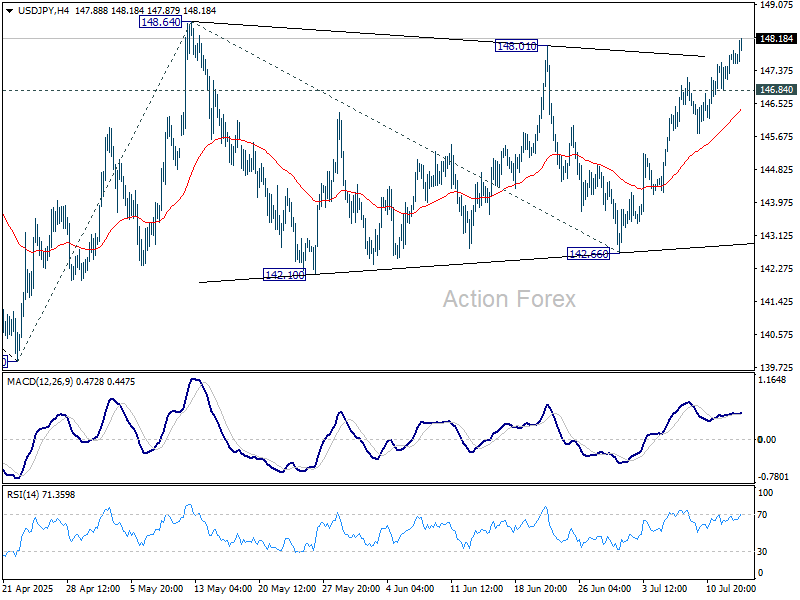
USD/JPY's breach of 148.01 resistance suggests that corrective pattern from 148.64 has completed with three waves to 142.66. Intraday bias is on the upside for 148.64 resistance first. Firm break there will confirm and target 100% projection of 139.87 to 148.64 from 142.66 at 151.43. That is close to 61.8% retracement of 158.86 to 139.87 at 151.22. On the downside, below 146.84 minor support will mix up the outlook and turn intraday bias neutral again first.
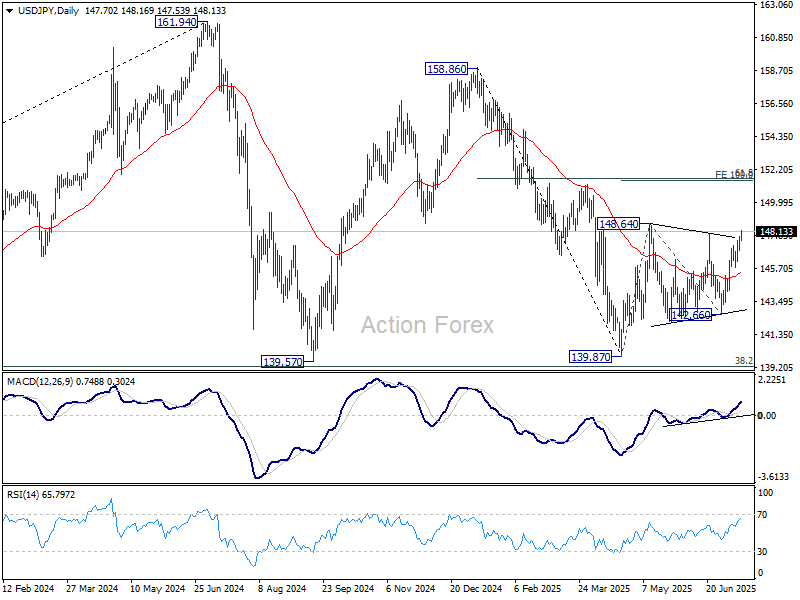
In the bigger picture, price actions from 161.94 (2024 high) are seen as a corrective pattern to rise from 102.58 (2021 low). There is no clear sign that the pattern has completed yet. But still, strong support is expected from 38.2% retracement of 102.58 to 161.94 at 139.26 to bring rebound.
Markets Calm as US CPI Leaves Fed Outlook Unchanged, Yen Slides Continue
Markets shrugged off the latest US CPI release, with muted reactions across assets. While annual core inflation ticked slightly higher, the modest rise appears to be a relief for Fed and investors alike. Overall, the data does little to shift expectations around the Fed’s easing path.
The July FOMC meeting remains firmly priced for a hold, with over 97% probability. As for September, futures imply around 60% odds of a rate cut. However, with US tariffs set to escalate from August 1 and trade talks still ongoing, there is considerable uncertainty over the coming weeks.
In FX, the standout move is the continued weakness in Yen. The currency is under pressure as investors position cautiously ahead of this weekend’s upper house elections. Sharp gains in long-dated JGB yields reflect growing anxiety over future fiscal policies and deficit spending, regardless of the outcome.
Elsewhere, the Dollar and Euro are also softer. Sterling and Swiss Franc are trading closer to the middle of the pack. Commodity currencies are outperforming, led by Kiwi and Aussie, followed by the Loonie.
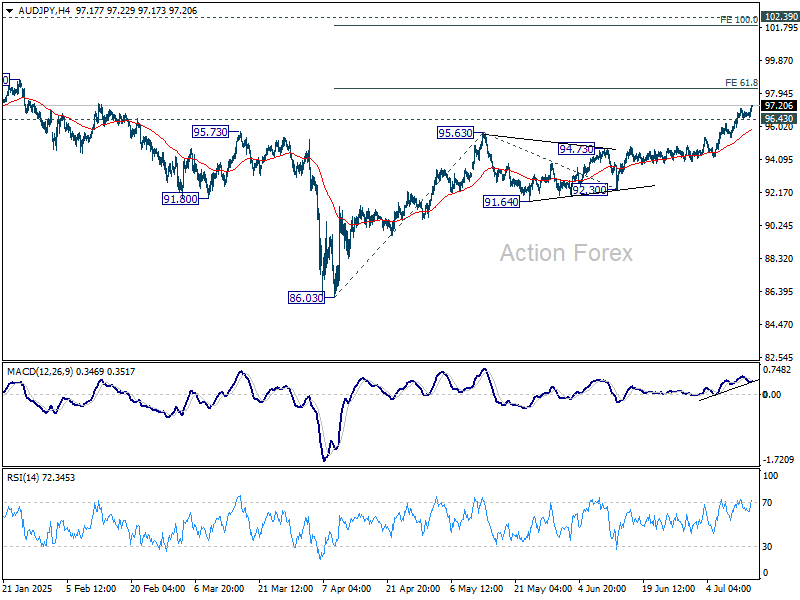
Technically, AUD/JPY's rally continues today and is on track to 61.8% projection of 86.03 to 95.63 from 92.30 at 98.23. Decisive break there could prompt further upside acceleration to 100% projection at 101.90. On the downside, break of 96.43 support will bring consolidations first.
In Europe, at the time of writing, FTSE is up 0.03%. DAX is up 0.14%. CAC is up 0.01%. UK 10-year yield is down -0.044 at 4.564. Germany 10-year yield is down -0.054 at 2.678. Earlier in Asia, Nikkei rose 0.55%. Hong Kong HSI rose 1.60%. China Shanghai SSE fell -0.42%. Singapore Strait Times rose 0.26%. Japan 10-year JGB yield rose 0.015 to 1.592.
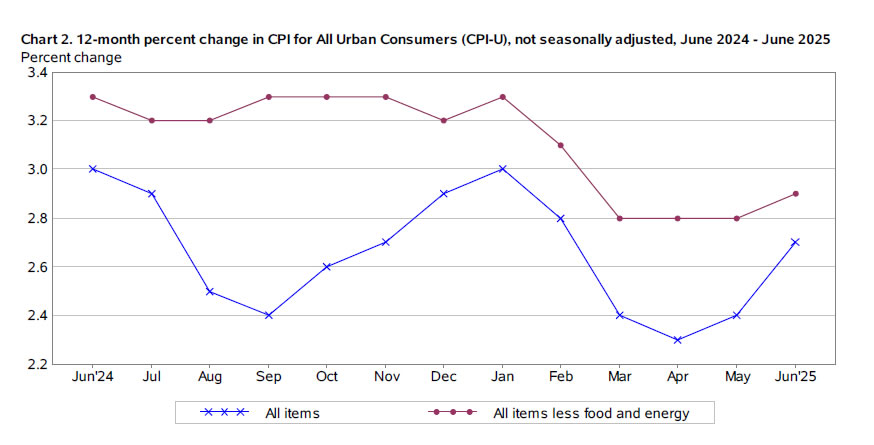
US CPI jumps to 2.7% yoy in June, core CPI undershoots expectation at 2.9% yoy
US CPI climbed 0.3% mom in June, matching forecasts, with the increase largely driven by a 0.2% mom rise in shelter costs and a 0.9% mom gain in energy prices. Food prices also edged higher, up 0.3% mom on the month. While the headline data aligned with expectations, the core CPI—excluding food and energy—rose just 0.2% mom, slightly below the anticipated 0.3% mom gain.
On a year-over-year basis, headline inflation jumped from 2.4% to 2.7%, in line with projections. However, core inflation ticked up only marginally from 2.8% to 2.9%, coming in under the 3.0% consensus. The annual energy index fell -0.8%, offering some offset to stickier components like food, which rose 3.0% over the year.
Canada's CPI rises to 1.9% yoy in June, core measures unchanged
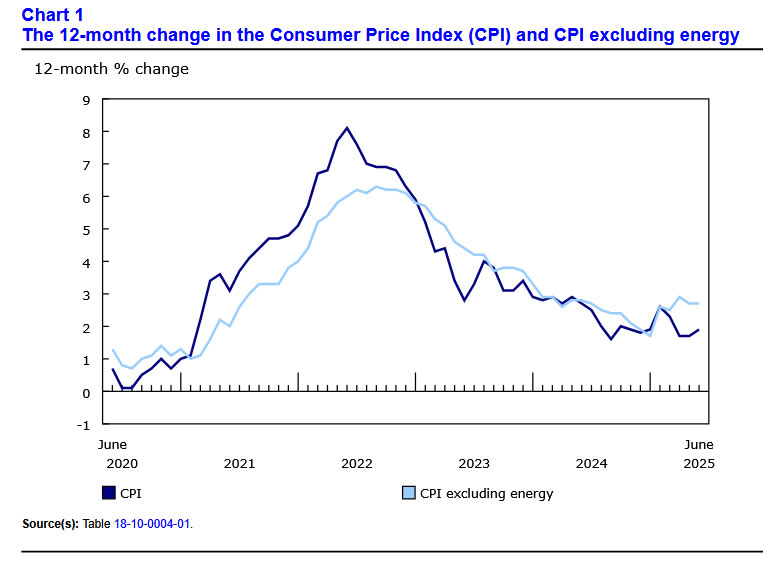
Canada’s CPI rose 0.1% mom in June, falling short of the expected 0.2% mom gain. On an annual basis, headline inflation accelerated from 1.7% yoy to 1.9% yoy, matching expectations. The increase was driven partly by a smaller year-on-year decline in gasoline prices and firmer price gains in durable goods like vehicles and furniture.
Meanwhile, BoC’s preferred core inflation measures remained unchanged, with median and trimmed CPI steady at 3.0% and the common measure holding at 2.6%.
German ZEW jumps to 52.7, positive sentiment firmly established
Germany’s ZEW Economic Sentiment index jumped from 47.5 to 52.7 in July, beating expectations of 50.2 and marking the third consecutive monthly rise. Current Situation Index also improved sharply from -72 to -59.5, above forecast of -66.0. The data suggests that investor confidence is firming despite lingering global trade tensions, likely supported by hopes for a de-escalation in US-EU tariff threats and anticipated domestic fiscal stimulus.
Eurozone sentiment also edged up modestly, with the expectations index rising from 35.3 to 36.1, though falling short of the 37.8 consensus. The current conditions measure rose by 6.5 points to -24.2, signaling a gradual improvement in the broader bloc’s outlook.
ZEW President Achim Wambach noted that nearly two-thirds of respondents expect Germany’s economy to improve, citing optimism tied to a resolution of the US-EU trade standoff and government-led investment. Expectations were especially upbeat in sectors like machinery, metals, and electrical manufacturing.
Eurozone industrial production grows 1.7% mom in May, EU up 1.5% mom
Eurozone industrial production jumped 1.7% mom in May, comfortably beating market expectations of 1.1% mom. The strength was broad-based across key sectors, with notable gains in energy (+3.7%), capital goods (+2.7%), and non-durable consumer goods (+8.5%). However, weakness in intermediate goods (-1.7%) and durable consumer goods (-1.9%) tempered the overall picture.
Across the broader EU, industrial production rose 1.5% mom. At the national level, Ireland led the surge with a sharp 12.4% mom rise, followed by Malta (+3.4%) and Germany (+2.2%). On the flip side, industrial activity contracted most in Croatia (-2.9%), Slovakia (-2.8%), and Belgium (-2.7%).
Australia Westpac consumer sentiment edges up to 93.1, RBA hold damps household optimism
Australia’s Westpac Consumer Sentiment index edged up 0.6% mom to 93.1 in July, but the modest gain masked a clear sense of disappointment among households.
Westpac noted that sentiment was noticeably stronger before the RBA’s July meeting, with those surveyed prior to the decision reporting a reading of 95.6. That slipped to 92 among those surveyed after the RBA unexpectedly held rates steady, suggesting the decision dashed hopes for relief.
As a result, consumer confidence remains stuck at what Westpac called “cautiously pessimistic” levels.
Looking ahead, markets are eyeing the RBA’s next meeting on August 11–12. While the central bank may pause again if Q2 inflation overshoots, the more likely scenario is a confirmation that inflation stays inside the 2–3% target range. That would pave the way for a 25bps rate cut in August, with another expected in November.
China Q2 GDP growth slows to 5.2%, but beats expectations
China’s economy expanded 5.2% yoy in Q2, slightly above expectations of 5.1% yoy but down from 5.4% yoy in Q1. Sector data showed balanced growth across industries—primary output rose 3.7%, secondary 5.3%, and tertiary 5.5%. The National Bureau of Statistics noted that macroeconomic policies have supported stability, but also flagged persistent weakness in domestic demand and external headwinds.
June’s data painted a mixed picture. Industrial production accelerated from 5.8% yoy to 6.8% yoy, beating forecasts of 5.6% yoy and suggesting continued strength in export-facing sectors and manufacturing. However, retail sales cooled to 4.8% yoy, down sharply from May’s 6.4% yoy and missed expectation of 5.2% yoy.
Fixed asset investment year-to-date slowed to 2.8%, well below expectations of 3.7%. The decline in property investment deepened, falling -11.2% in H1, and private investment contracted -0.6%.
USD/JPY Mid-Day Outlook
Daily Pivots: (S1) 147.13; (P) 147.46; (R1) 148.05; More...
USD/JPY's breach of 148.01 resistance suggests that corrective pattern from 148.64 has completed with three waves to 142.66. Intraday bias is on the upside for 148.64 resistance first. Firm break there will confirm and target 100% projection of 139.87 to 148.64 from 142.66 at 151.43. That is close to 61.8% retracement of 158.86 to 139.87 at 151.22. On the downside, below 146.84 minor support will mix up the outlook and turn intraday bias neutral again first.
In the bigger picture, price actions from 161.94 (2024 high) are seen as a corrective pattern to rise from 102.58 (2021 low). There is no clear sign that the pattern has completed yet. But still, strong support is expected from 38.2% retracement of 102.58 to 161.94 at 139.26 to bring rebound.
Canada’s CPI rises to 1.9% yoy in June, core measures unchanged
Canada’s CPI rose 0.1% mom in June, falling short of the expected 0.2% mom gain. On an annual basis, headline inflation accelerated from 1.7% yoy to 1.9% yoy, matching expectations. The increase was driven partly by a smaller year-on-year decline in gasoline prices and firmer price gains in durable goods like vehicles and furniture.
Meanwhile, BoC’s preferred core inflation measures remained unchanged, with median and trimmed CPI steady at 3.0% and the common measure holding at 2.6%.
US CPI jumps to 2.7% yoy in June, core CPI undershoots expectation at 2.9% yoy
US CPI climbed 0.3% mom in June, matching forecasts, with the increase largely driven by a 0.2% mom rise in shelter costs and a 0.9% mom gain in energy prices. Food prices also edged higher, up 0.3% mom on the month. While the headline data aligned with expectations, the core CPI—excluding food and energy—rose just 0.2% mom, slightly below the anticipated 0.3% mom gain.
On a year-over-year basis, headline inflation jumped from 2.4% to 2.7%, in line with projections. However, core inflation ticked up only marginally from 2.8% to 2.9%, coming in under the 3.0% consensus. The annual energy index fell -0.8%, offering some offset to stickier components like food, which rose 3.0% over the year.
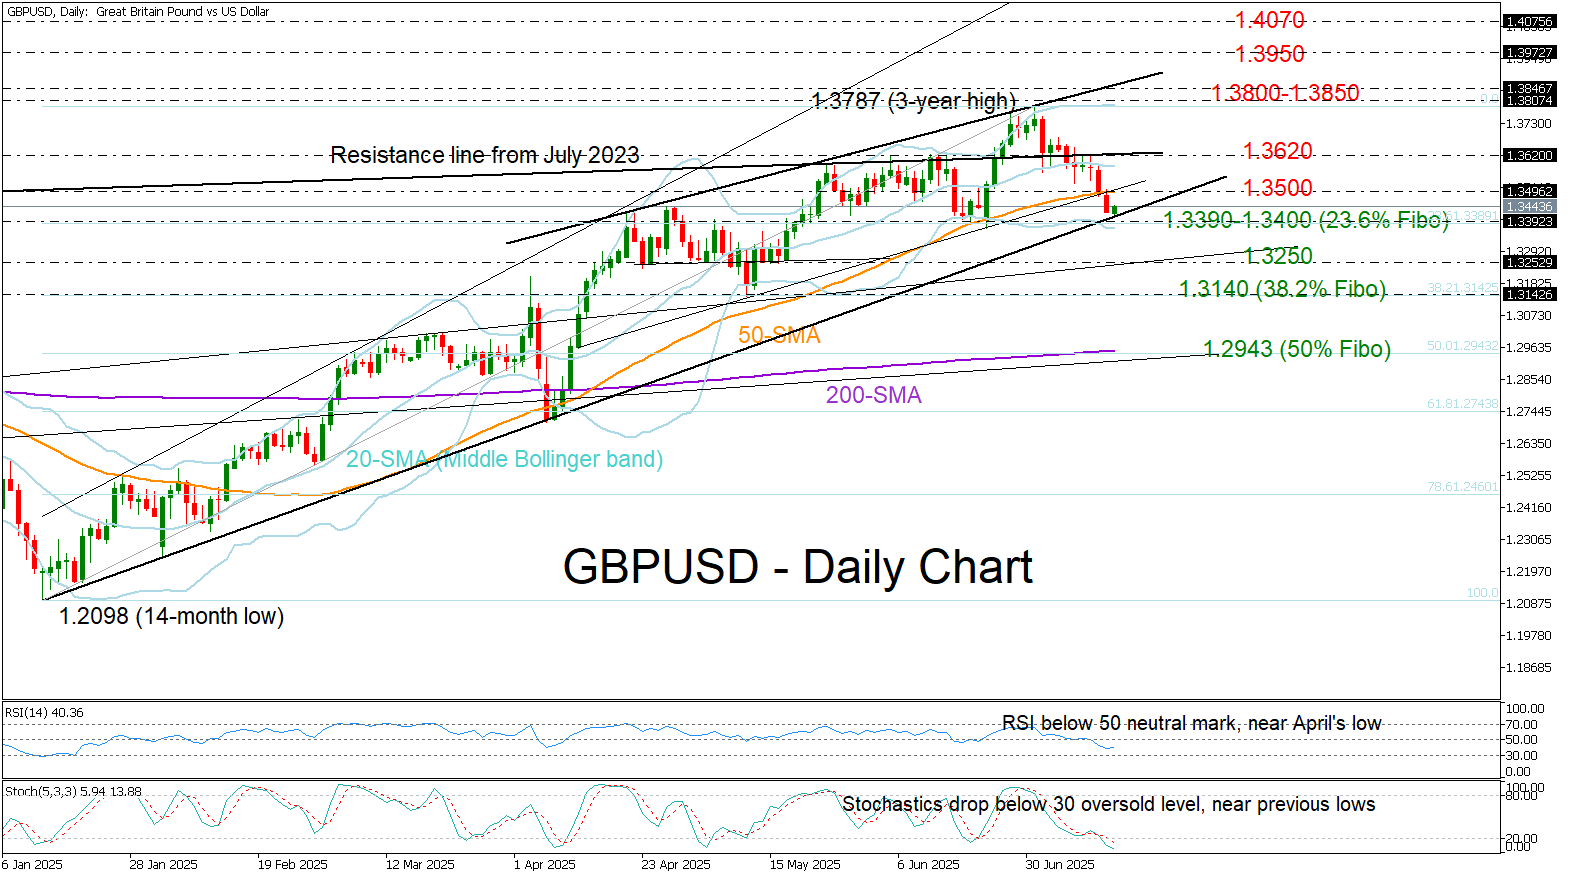
GBP/USD at Breaking Point: Will Bulls Roar Back?
- GBP/USD falls below SMAs but one last opportunity for rebound remains.
- Short-term signals point to oversold conditions; eyes on 1.3400.
GBP/USD extended its decline below the 50-day simple moving average (SMA) after Bank of England Governor Andrew Bailey expressed a willingness to implement larger rate cuts if the labor market shows signs of weakness, according to an interview with The Times.
U.S. and UK CPI figures, due today and tomorrow respectively, are expected to show some persistence in inflation, and the pair is already hovering near a potential pivot zone, trading around the 2025 support trendline at 1.3400. Notably, the 23.6% Fibonacci retracement of the 2025 uptrend is also nearby, at 1.3390.
The stochastic oscillator has dipped into the oversold region, the price is nearing the lower Bollinger Band, and the RSI is testing its April low – all suggesting that the recent bearish cycle may be nearing exhaustion. If this proves to be the case, the bulls will need to reclaim the 50-day SMA at 1.3500 and then push past the 1.3620 barrier to target again the key 1.3800–1.3860 resistance zone.
Conversely, if selling pressure intensifies below 1.3400, the bears could aim for the 1.3250 constraining zone, followed by the May low at 1.3138. A decisive close below the latter could pave the way toward the 1.3000 level or even lower to the 50% Fibonacci of 1.2943.
In brief, GBPUSD is currently trading near a critical make-or-break point around 1.3400, with the technical picture slightly favoring a potential rebound.
Canadian Dollar on Hold Ahead of Canada, US CPIs
The Canadian dollar continues to drift but that could change with the release of Canadian and US inflation later today. In the North American session, USD/CAD is trading at 1.3687, down 0.13% on the day.
Canadian, US CPI expected to have accelerated in June
It promises to be an interesting day as both Canada and the US release the June inflation reports.
In Canada, headline CPI is expected to rise to 1.9% y/y from 1.7% in May, while the monthly rate is projected to ease to 0.1% from 0.6%. Two key core CPI indicators are expected to show an average of 3.0% y/y, unchanged from May.
In the US, the markets are also bracing for higher inflation. The consensus for headline CPI is 2.7% y/y, compared to 2.4% in May. Monthly, CPI is expected to rise to 0.3%, up from 0.1% in May. Core CPI is expected to rise to 3.0% y/y from 2.8% and monthly to 0.3% from 0.1%.
How will the Bank of Canada and the Federal Reserve view the inflation numbers? The BoC won't have any problem with a CPI of around 2%, which is the Bank's inflation target. Still, core CPI, which is a better gauge of long-term inflation than headline CPI, is uncomfortably high at 3%, and the BOC would like to see the core rate move lower before lowering interest rates.
Have the Trump tariffs boosted inflation?
In the US, if June inflation rises as is expected, fingers will quickly point at President Trump's tariffs as finally having an impact. Recent inflation reports have not shown a significant spike higher to the tariffs, which were first imposed in April. However, the tariffs may have needed time to filter throughout the economy and could be felt for the first time in the June inflation reading.
The Fed is widely expected to hold rates at the July 30 meeting, with the markets pricing in a 95% chance of a hold, according to CME's FedWatch. For September, the odds of a rate cut stand at 59%. Today's inflation report could cause a shift in these numbers.
USDCAD Technical
- USD/CAD is testing support at 1.3695. Next, 1.3680 is a weak support line, followed by 1.3656
- There is resistance at 1.3719 and 1.3734
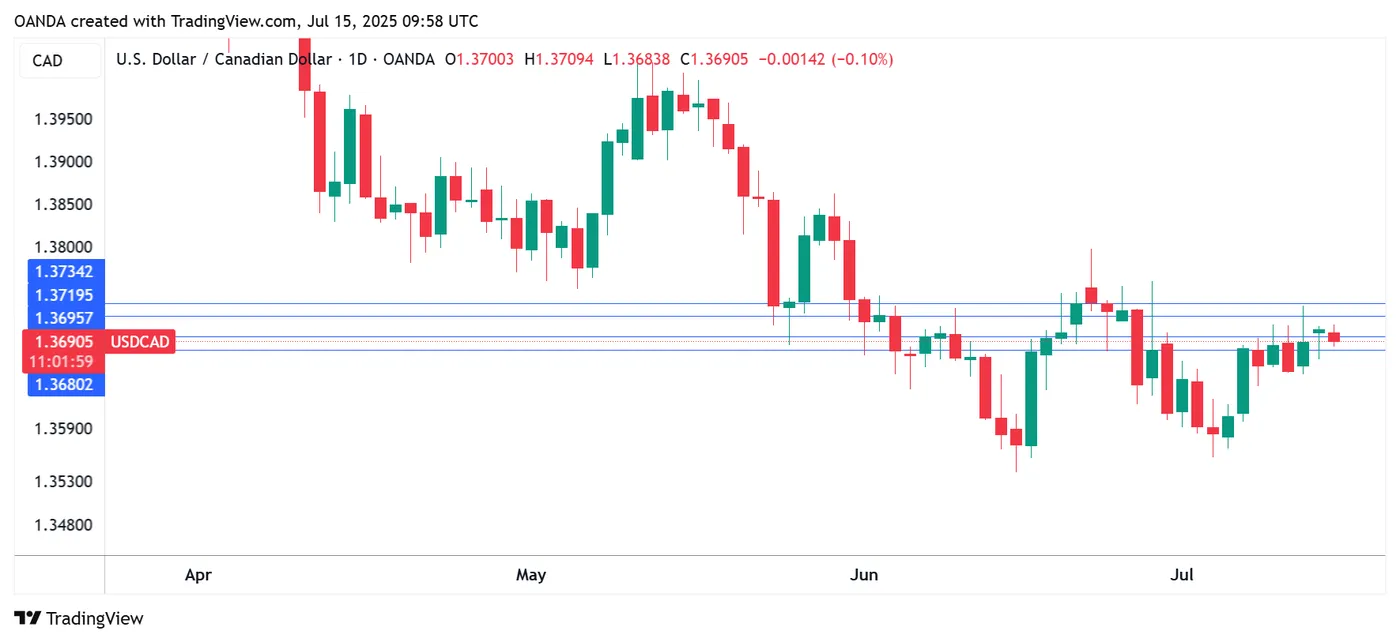
USDCAD 1-Day Chart, July 15, 2025
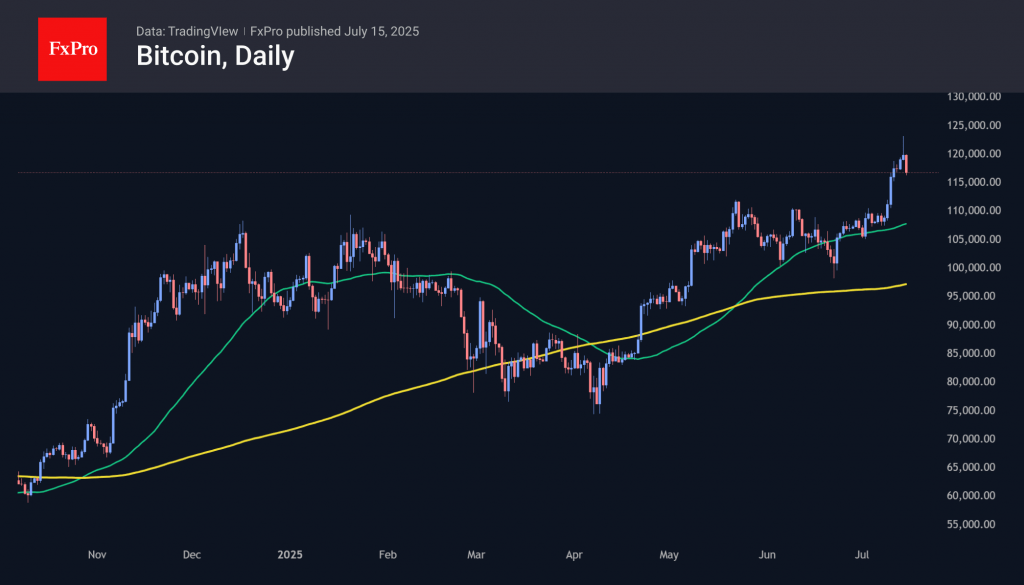
Bitcoin Corrects, But Market Not Worried
Market Overview
The crypto market cap retreated 3.5% to $3.67 over 24h after Bitcoin’s sharp dive in the middle of the European session on Monday. Notably, stock indices continued to move upwards, confirming no radical change in risk appetite.
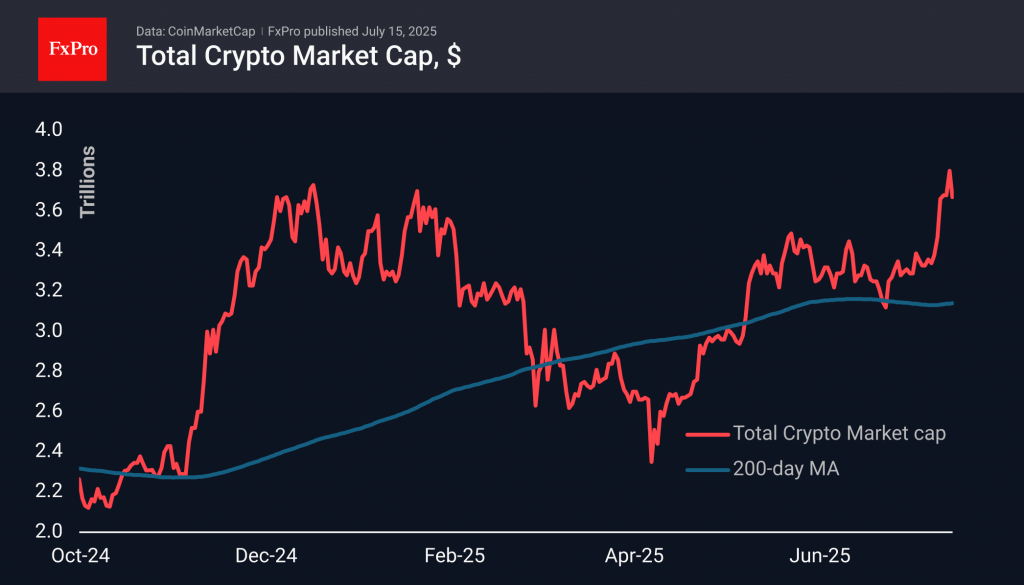
Bitcoin was one of the main victims of sharp profit-taking, falling 4% in 24 hours to $117K after setting a record at $123K. This is significantly higher than the last peak of $112K, so there is no point in talking about a reversal. At the same time, we are getting further confirmation of a change in the nature of the market with more frequent profit-taking. It is becoming the norm for very long-term buyers to join in the selling.
Ethereum also experienced a 5% pullback to $2930 from its latest peak but quickly returned to growth on Tuesday morning to $2980. Judging by its dynamics, crypto traders are bullish, assuming only a short-term pullback.
News Background
According to CoinShares, global investment inflows into crypto funds last week amounted to $3.717 billion, the second largest in recorded history. Investments in Bitcoin increased by $2.731 billion, Ethereum by $990 million, Solana by $93 million, and Sui by $4 million. The XRP token saw a record weekly outflow of $104 million.
Cryptocurrency ETFs saw inflows for the 13th consecutive week, increasing investments since the beginning of the year (YTD) to $22.7 billion. Assets under management (AuM) reached a new record of $211 billion. Bitcoin ETF AuM exceeded $179 billion, already accounting for 54% of gold ETF AuM, according to CoinShares.
Bitcoin’s market capitalisation reached $2.4 trillion. This figure exceeded the capitalisation of Amazon ($2.3 trillion) and silver ($2.2 trillion).
There are no signs of active coin selling on the market. According to CryptoQuant, crypto wallets that only buy Bitcoin have increased their activity by 71% over the past month.
The latest recalculation increased the difficulty of mining Bitcoin by 7.96% to 126.27 T. The indicator approached the historical maximum of 126.98 T recorded in May.
Market data indicates the start of the altcoin season, but according to Santiment, there are warning signs. CoinMarketCap’s alt season index is at 27, indicating that market participants still prefer Bitcoin.
German ZEW jumps to 52.7, positive sentiment firmly established
Germany’s ZEW Economic Sentiment index jumped from 47.5 to 52.7 in July, beating expectations of 50.2 and marking the third consecutive monthly rise. Current Situation Index also improved sharply from -72 to -59.5, above forecast of -66.0. The data suggests that investor confidence is firming despite lingering global trade tensions, likely supported by hopes for a de-escalation in US-EU tariff threats and anticipated domestic fiscal stimulus.
Eurozone sentiment also edged up modestly, with the expectations index rising from 35.3 to 36.1, though falling short of the 37.8 consensus. The current conditions measure rose by 6.5 points to -24.2, signaling a gradual improvement in the broader bloc’s outlook.
ZEW President Achim Wambach noted that nearly two-thirds of respondents expect Germany’s economy to improve, citing optimism tied to a resolution of the US-EU trade standoff and government-led investment. Expectations were especially upbeat in sectors like machinery, metals, and electrical manufacturing.

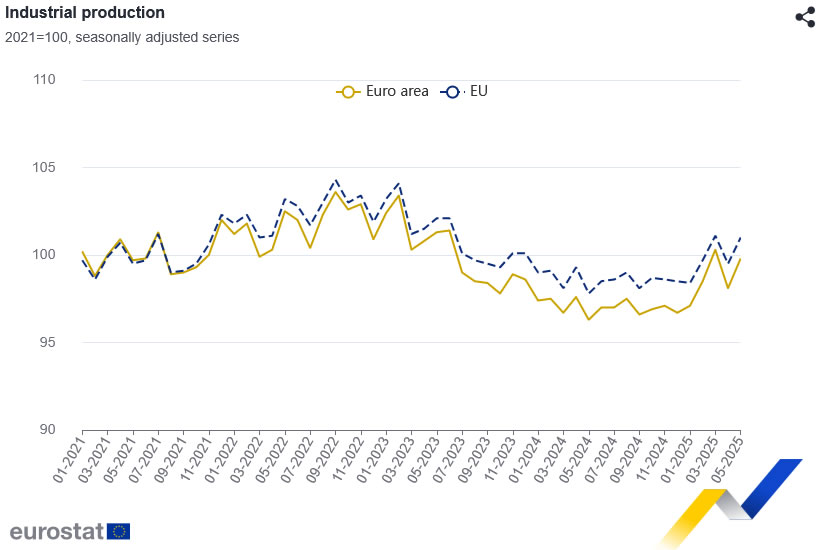
Eurozone industrial production grows 1.7% mom in May, EU up 1.5% mom
Eurozone industrial production jumped 1.7% mom in May, comfortably beating market expectations of 1.1% mom. The strength was broad-based across key sectors, with notable gains in energy (+3.7%), capital goods (+2.7%), and non-durable consumer goods (+8.5%). However, weakness in intermediate goods (-1.7%) and durable consumer goods (-1.9%) tempered the overall picture.
Across the broader EU, industrial production rose 1.5% mom. At the national level, Ireland led the surge with a sharp 12.4% mom rise, followed by Malta (+3.4%) and Germany (+2.2%). On the flip side, industrial activity contracted most in Croatia (-2.9%), Slovakia (-2.8%), and Belgium (-2.7%).
Asian Stocks Rise on China Data, Gold Gains as US Dollar Softens; EUR/USD
US benchmark indices inched upward on Monday, 14 July, with the S&P 500 rising 0.1% and the Nasdaq 100 gaining 0.3%, as investors looked ahead to the release of June's US Consumer Price Index (CPI) data and key Q2 earnings reports from major financial institutions including JPMorgan, Citigroup, Wells Fargo, and BlackRock.
In the early Asian session today (9:00 a.m. SGT), the S&P 500 and Nasdaq 100 E-mini futures spiked 0.5%, pushing the US SPX 500 CFD Index and US Nasdaq 100 CFD Index toward key short-term resistance levels at 6,290 and 22,920, respectively.
Nvidia boosts market sentiment on AI chip news
The sudden rally in US stock index futures was largely driven by a positive update from AI leader Nvidia. In a blog post, Nvidia revealed it had received assurances from the US government allowing it to resume shipments of its lower-end H20 AI accelerator chips to China, reversing earlier concerns over billions of dollars in unsold inventory.
China’s economic data lifts regional stock market optimism
A wave of stronger-than-expected economic data (except for retail sales) from China supported positive sentiment in Asian markets. Key highlights from June include:
New home prices in 70 cities declined at a slower pace (-3.2% y/y vs. -3.5% y/y in May), marking the slowest drop since April 2024.
Q2 GDP rose 5.2% y/y (above consensus of 5.1%), slightly down from Q1’s 5.4%.
Industrial production surged 6.8% y/y (fastest since March), up from 5.8% in May and beating forecasts of 5.6%.
Retail sales slowed to 4.8% y/y, below expectations of 5.6%, marking the weakest growth since February.
Buoyed by China’s economic resilience, the Hang Seng Index extended its winning streak to a fourth session, gaining 1% intraday to test its 24,490 resistance level established since 25 June. Japan’s Nikkei 225 rebounded 0.6% intraday after a successful retest of its 20-day moving average (support near 39,390). Meanwhile, Singapore’s Straits Times Index broke above the psychological 4,100 level with a 0.4% gain, marking a seventh straight record-high session.
US dollar retreats, Gold reclaims key levels
The US dollar began to pull back in the Asian session after three days of strength, as markets potentially priced in a hotter-than-expected US core CPI print of 3% y/y for June (vs. 2.8% in May). The Swiss franc, New Zealand dollar, and euro led the rebound, each rising 0.1% to 0.2% against the greenback.
Gold (XAU/USD) benefited from the softer dollar, climbing 0.4% intraday. The yellow metal traded above its 20-day and 50-day moving averages and approached the key intermediate resistance at US$3,360, reinforcing its short-term bullish momentum.
Economic data releases
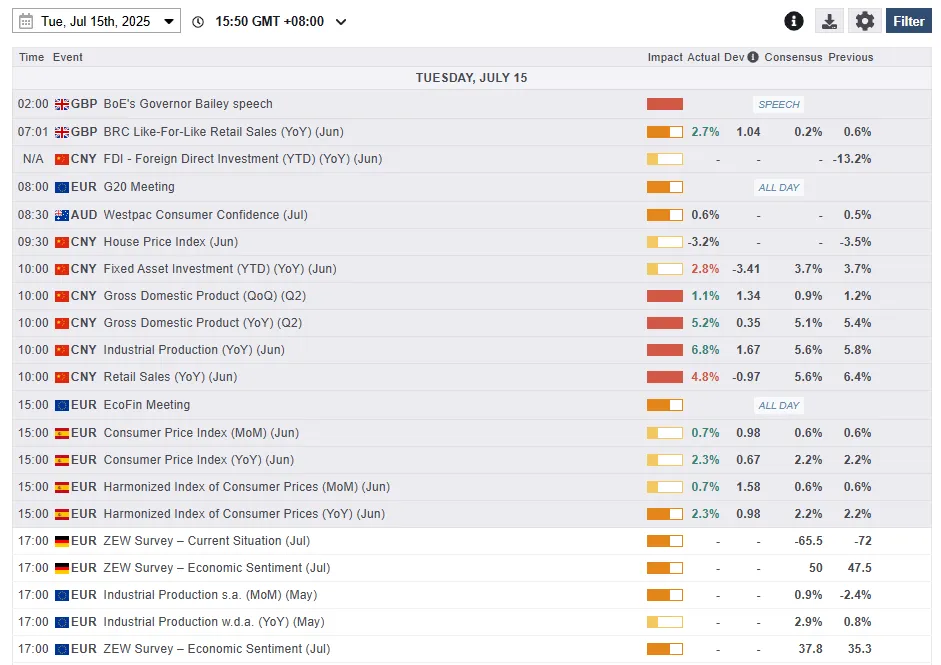
Fig 1: Key data for today’s Asia mid-session (Source: MarketPulse)
Chart of the day – EUR/USD minor corrective decline stalls at 20-day moving average, bullish reversal looms
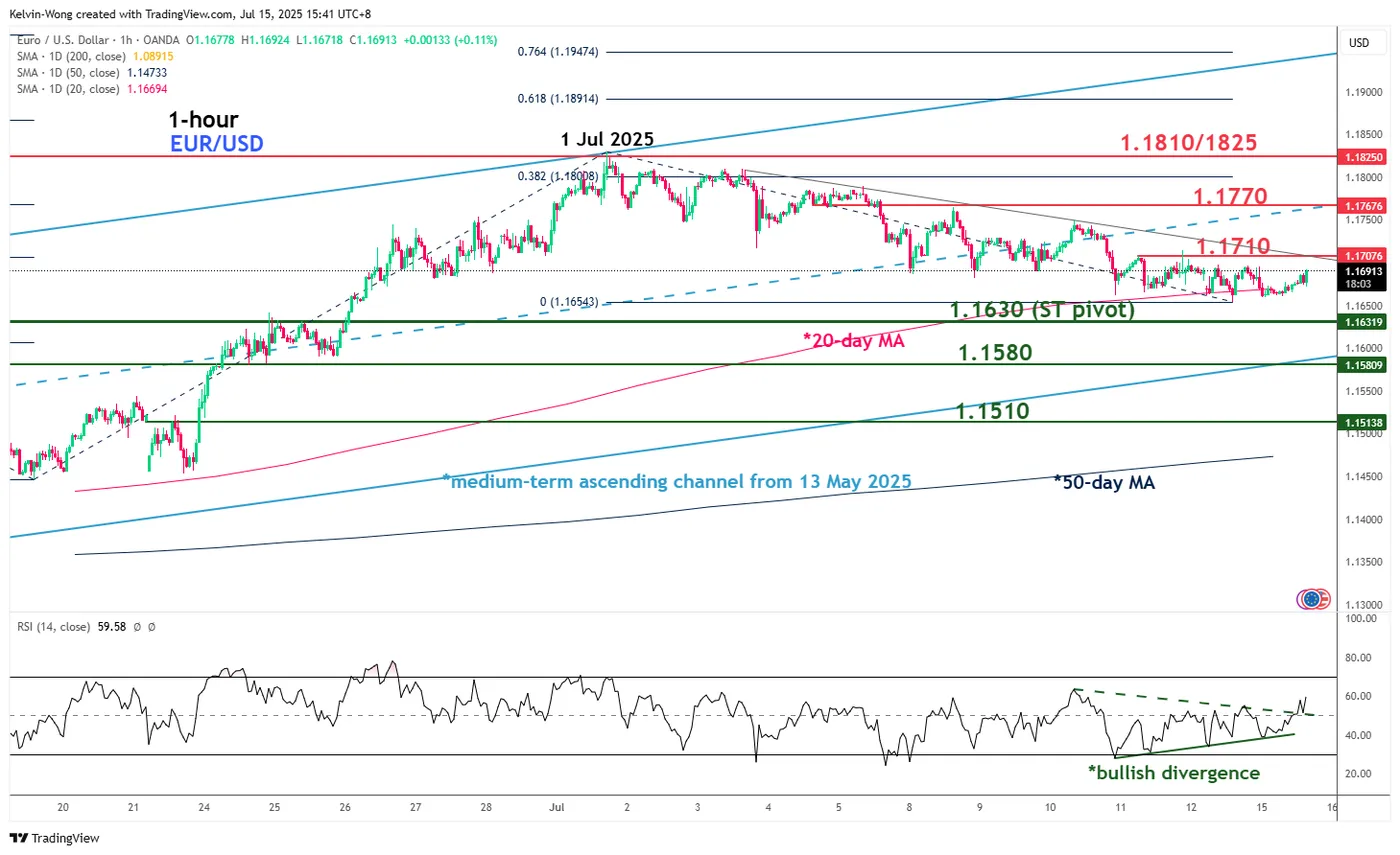
Fig 2: EUR/USD minor trend as of 15 July 2025 (Source: TradingView)
The recent price actions and key technical elements of the EUR/USD suggest that the three-week period of minor corrective decline from the 1 July 2025 high may have ended, where the EUR/USD is likely in the process of forming a potential fresh bullish impulsive up move sequence within its ongoing medium-term uptrend phase.
The hourly RSI momentum indicator has flashed out a bullish divergence condition since it reached its oversold region last Thursday, 10 July, and now managed to stage a bullish breakout above the 50 level (see Fig 2).
Watch the 1.1630 key short-term pivotal support, and a clearance above 1.1710 (minor descending trendline that capped prior rebound since 3 July) increases the odds of the start of the bullish impulsive up move sequence for the next intermediate resistances to come in at 1.1770 and 1.1810/1.1825 in the first step.
On the flip side, failure to hold at 1.1630 invalidates the bullish reversal scenario for an extension of the minor corrective decline to expose the next immediate support at 1.1580 (the lower boundary of the medium-term ascending channel from 13 May 2025 swing low).