
Sample Category Title
EUR/GBP Daily Outlook
Daily Pivots: (S1) 0.8658; (P) 0.8675; (R1) 0.8707; More...
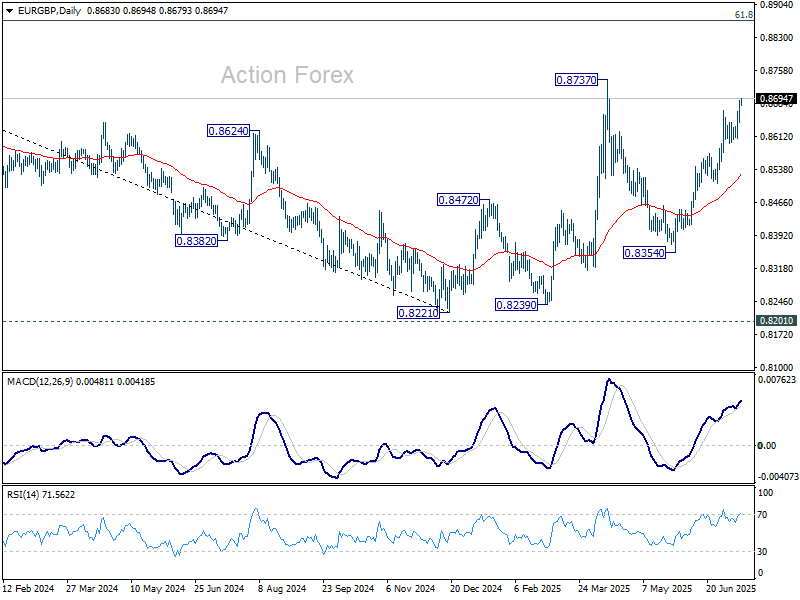
EUR/GBP's rally from 0.8354 resumed by breaking through 0.8668. Intraday bias is back on the upside for 0.8737 high. Decisive break there will resume the whole rise from 0.8221 low, and target 0.8867 fibonacci level. For now, near term outlook will remains bullish as long as 0.8607 support holds.
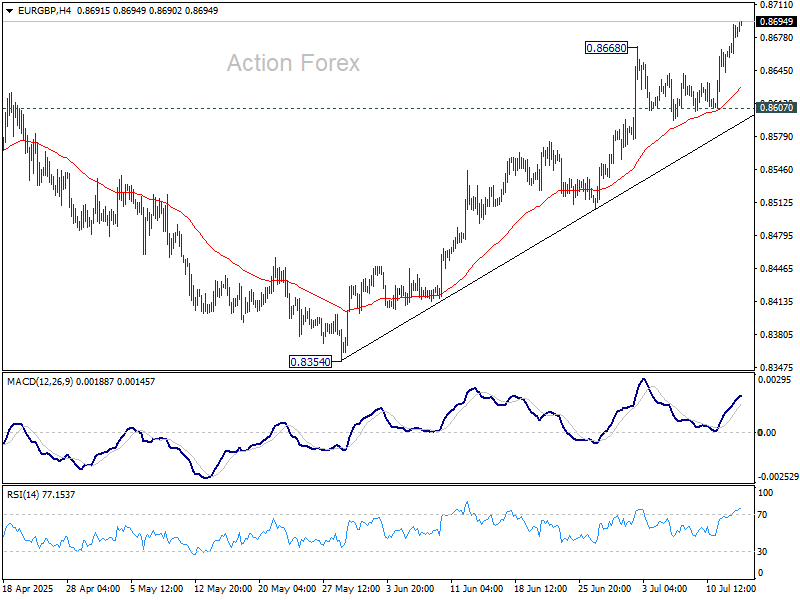
In the bigger picture, the structure from 0.8221 medium term bottom are not impulsive enough to suggest that it's reversing the down trend from 0.9267 (2022 high). But even if it's a correction, firm break of 0.8737 will still pave the way to 61.8% retracement of 0.9267 to 0.8221 at 0.8867.
Bond Market Signals Deepening Japan Risk , But Yen Finds No Lift from Surging Yields
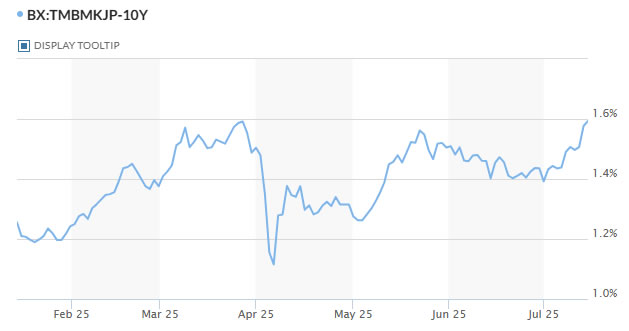
Japanese bond markets are flashing warning signs ahead of a politically uncertain weekend. The 10-year JGB yield surged to its highest level since March and is on the cusp of breaking 1.6% for the first time since 2007. Long-dated yields have moved even more aggressively: the 30-year hit a record 3.21%, while 20-year yields spiked to their highest since 1999. The sell-off reflects growing concern over Japan’s fiscal direction and political stability as the upper house election looms.
Polls suggest Prime Minister Ishiba’s ruling coalition may fall short of even modest expectations. A new NHK survey shows the LDP at its weakest since returning to power more than a decade ago. Investors are worried that a weaker mandate or outright power shift could unleash a wave of populist fiscal proposals—chief among them, sweeping consumption tax cuts or even VAT elimination, as proposed by the right-wing Sanseito party.
Fears of fiscal slippage are not new. In late May, similar concerns drove a steep sell-off in the super-long end, prompting the Ministry of Finance to announce cuts to bond issuance across the 20-, 30-, and 40-year tenors. But that intervention only provided temporary relief. With opposition parties openly campaigning on fiscal expansion, investors are once again questioning Japan’s ability to maintain fiscal discipline.
Despite the surge in yields, Yen has failed to capitalize. The disconnect highlights how fiscal risk may be outweighing any potential monetary policy adjustments. There is some speculation that rising fiscal stimulus could push the BoJ to upgrade its inflation forecasts and consider hiking rates sooner. But for now, that view remains a secondary consideration to market worries about uncontrolled debt issuance.
On the global trade front, tensions between the US and EU are heating up again. Brussels accused Washington of resisting a trade resolution and warned of countermeasures if US President Donald Trump’s 30% tariffs are imposed on August 1. EU ministers signaled growing frustration, with Trade Chief Maros Sefcovic warning that while negotiations may continue, retaliation is now firmly on the table if talks fail to progress.
In FX, risk currencies are currently lagging. Aussie leads losses this week, followed by Kiwi and Sterling. Swiss Franc is the top performer, with Dollar and Loonie also holding firm. Euro and Yen are trading mid-pack.
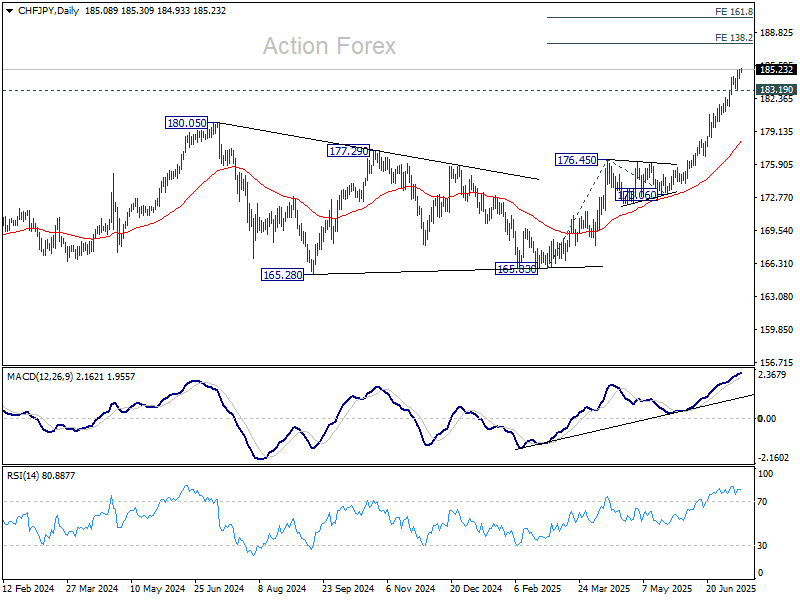
Technically, CHF/JPY's up trend continues this week and hit as high as 185.30 so far. Near term outlook will stay bullish as long as 183.19 support holds. Next target is 138.2% projection of 165.83 to 176.45 from 173.06 at 187.73. But overbought condition is likely to cap upside at 161.8% projection at 190.24.
In Asia, at the time of writing, Nikkei is up 0.37%. Hong Kong HSI is up 0.73%. China Shanghai SSE is down -0.61%. Singapore Strait Times is up 0.25%. Japan 10-year JGB yield is up 0.015 at 1.592. Overnight, DOW rose 0.20%. S&P 500 rose 0.14%. NASDAQ rose 0.27%. 10-year yield rose 0.004 to 4.427.
Looking ahead, German ZEW economic sentiment is the main focus in European session. Later in the day, Canada CPI and US CPI are the main events.
Australia Westpac consumer sentiment edges up to 93.1, RBA hold damps household optimism
Australia’s Westpac Consumer Sentiment index edged up 0.6% mom to 93.1 in July, but the modest gain masked a clear sense of disappointment among households.
Westpac noted that sentiment was noticeably stronger before the RBA’s July meeting, with those surveyed prior to the decision reporting a reading of 95.6. That slipped to 92 among those surveyed after the RBA unexpectedly held rates steady, suggesting the decision dashed hopes for relief.
As a result, consumer confidence remains stuck at what Westpac called “cautiously pessimistic” levels.
Looking ahead, markets are eyeing the RBA’s next meeting on August 11–12. While the central bank may pause again if Q2 inflation overshoots, the more likely scenario is a confirmation that inflation stays inside the 2–3% target range. That would pave the way for a 25bps rate cut in August, with another expected in November.
China Q2 GDP growth slows to 5.2%, but beats expectations
China’s economy expanded 5.2% yoy in Q2, slightly above expectations of 5.1% yoy but down from 5.4% yoy in Q1. Sector data showed balanced growth across industries—primary output rose 3.7%, secondary 5.3%, and tertiary 5.5%. The National Bureau of Statistics noted that macroeconomic policies have supported stability, but also flagged persistent weakness in domestic demand and external headwinds.
June’s data painted a mixed picture. Industrial production accelerated from 5.8% yoy to 6.8% yoy, beating forecasts of 5.6% yoy and suggesting continued strength in export-facing sectors and manufacturing. However, retail sales cooled to 4.8% yoy, down sharply from May’s 6.4% yoy and missed expectation of 5.2% yoy.
Fixed asset investment year-to-date slowed to 2.8%, well below expectations of 3.7%. The decline in property investment deepened, falling -11.2% in H1, and private investment contracted -0.6%.
EUR/GBP Daily Outlook
Daily Pivots: (S1) 0.8658; (P) 0.8675; (R1) 0.8707; More...
EUR/GBP's rally from 0.8354 resumed by breaking through 0.8668. Intraday bias is back on the upside for 0.8737 high. Decisive break there will resume the whole rise from 0.8221 low, and target 0.8867 fibonacci level. For now, near term outlook will remains bullish as long as 0.8607 support holds.
In the bigger picture, the structure from 0.8221 medium term bottom are not impulsive enough to suggest that it's reversing the down trend from 0.9267 (2022 high). But even if it's a correction, firm break of 0.8737 will still pave the way to 61.8% retracement of 0.9267 to 0.8221 at 0.8867.
Bitcoin Hits $120K+ — Bullish Breakout Extends to Record Levels
Key Highlights
- Bitcoin started a fresh increase and traded to a new high above the $120,000 resistance.
- BTC/USD is following a bullish trend line with support at $119,500 on the 4-hour chart.
- Ethereum climbed higher above $3,000 resistance.
- XRP price rallied above the $2.80 level and tested the $3.00 zone.
Bitcoin Price Technical Analysis
Bitcoin price started a fresh increase above the $112,000 zone against the US Dollar. BTC was able to surpass the $115,000 and $116,500 resistance levels.
Looking at the 4-hour chart, the price settled above the $115,000 level, the 100 simple moving average (red, 4-hour), and the 200 simple moving average (green, 4-hour). The bulls even pumped the price above the $120,000 resistance.
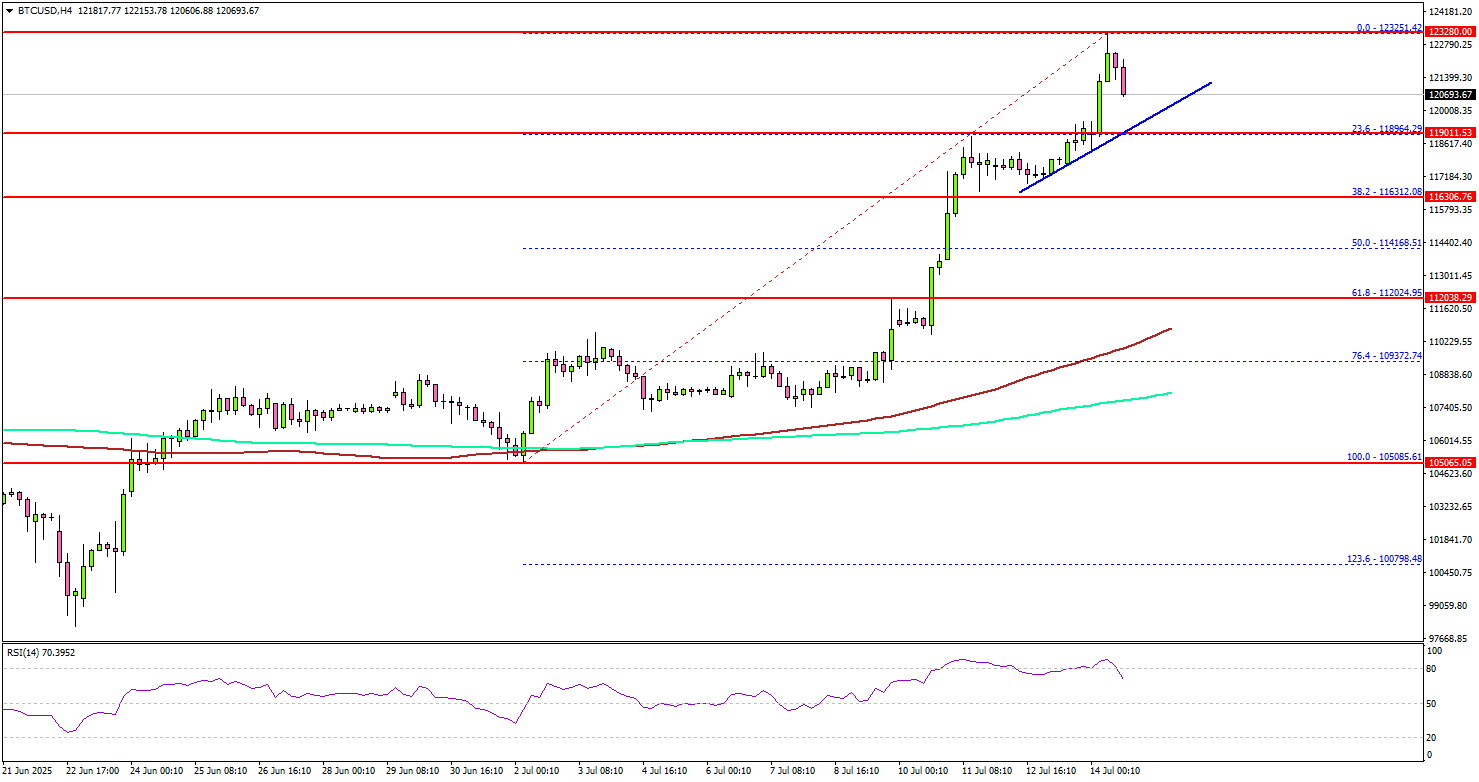
A new all-time high was formed near $123,200 and the price is now consolidating gains. If there is a pullback, Bitcoin might find support near the $119,500 level.
There is also a bullish trend line forming with support at $119,500 on the same chart. A downside break below $119,500 might send BTC toward the $117,500 support. Any more losses might send the price toward the $115,000 support zone.
On the upside, the price could face resistance near the $123,200 level. The next key resistance is $125,000. A successful close above $125,000 might start another steady increase.
In the stated case, the price may perhaps rise toward the $126,500 level. Any more gains might call for a test of $128,000.
Looking at Ethereum, the bulls seem to be in control, and they were able to push the price above the $3,000 resistance zone.
Today’s Economic Releases
- US Consumer Price Index for June 2025 (MoM) – Forecast +0.3%, versus +0.1% previous.
- US Consumer Price Index for June 2025 (YoY) – Forecast +2.7%, versus +2.4% previous.
- US Consumer Price Index Ex Food & Energy for June 2025 (YoY) – Forecast +3.0%, versus +2.8% previous.
China Q2 GDP growth slows to 5.2%, but beats expectations
China’s economy expanded 5.2% yoy in Q2, slightly above expectations of 5.1% yoy but down from 5.4% yoy in Q1. Sector data showed balanced growth across industries—primary output rose 3.7%, secondary 5.3%, and tertiary 5.5%. The National Bureau of Statistics noted that macroeconomic policies have supported stability, but also flagged persistent weakness in domestic demand and external headwinds.
June’s data painted a mixed picture. Industrial production accelerated from 5.8% yoy to 6.8% yoy, beating forecasts of 5.6% yoy and suggesting continued strength in export-facing sectors and manufacturing. However, retail sales cooled to 4.8% yoy, down sharply from May’s 6.4% yoy and missed expectation of 5.2% yoy.
Fixed asset investment year-to-date slowed to 2.8%, well below expectations of 3.7%. The decline in property investment deepened, falling -11.2% in H1, and private investment contracted -0.6%.
Australia Westpac consumer sentiment edges up to 93.1, RBA hold damps household optimism
Australia’s Westpac Consumer Sentiment index edged up 0.6% mom to 93.1 in July, but the modest gain masked a clear sense of disappointment among households.
Westpac noted that sentiment was noticeably stronger before the RBA’s July meeting, with those surveyed prior to the decision reporting a reading of 95.6. That slipped to 92 among those surveyed after the RBA unexpectedly held rates steady, suggesting the decision dashed hopes for relief.
As a result, consumer confidence remains stuck at what Westpac called “cautiously pessimistic” levels.
Looking ahead, markets are eyeing the RBA’s next meeting on August 11–12. While the central bank may pause again if Q2 inflation overshoots, the more likely scenario is a confirmation that inflation stays inside the 2–3% target range. That would pave the way for a 25bps rate cut in August, with another expected in November.

US CPI Preview – Potential Reactions and Major Forex Pairs Overview
Tomorrow’s July 15th Consumer Price Index inflation report has built some anticipation in the past week as markets try to cover some of their Dollar-selling positions, which took the Dollar Index to 96.50 lows on July 1st.
Since then, positive US Job reports and another leg of the tech-AI boom have brought the USD back to the 98.00 handle, where Markets are close to trading.
Nasdaq is again very close to record highs, and the S&P 500 is doing the same. Only the Dow Jones has been lagging on this move, based on the structural reshaping towards Tech, particularly in the past week: Bitcoin rallied consequently to new highs (around $123,200), and NVIDIA passed $4 trillion in Market Cap.
Today’s CPI Preview will primarily focus on Forex pairs, where a decent turn in the US Dollar may shape currency flows for the ongoing second half. Let’s see where the Markets currently stand to get ready for the big number.
Expectations for the July CPI Report
Expectations are for a decent increase both to the Headline and Core CPI data – both at + 0.3% month-over-month – This will take the Headline CPI to 2.4% Y/Y and the Core to 2.8% Y/Y.
As a reminder, the Core excludes more volatile Food and Energy Prices but keeps a closer look on Services inflation which has stayed high throughout the past 3 to 4 years now and is a stickier problem for the FED, one of the reasons why Central Banks tend to focus more on the Core numbers.
One thing about this month's release which, as a reminder, looks back at the June consumer prices, may have a fair difference between Headline and Core due to a spectacular week and a half rise in Oil prices during the Israel-Iran War, which may have also impacted fertilizer prices, hence food prices throughout the end of the month.
This report will also be one of the last reports before the tariffs actually get implemented (if the TACO doesn't materialize once again) – Therefore markets may interpret this report as a basis for a before-after comparison.
Potential reactions to the number
Predicting market reactions will be a quasi-impossible task, due to the current state of Markets – There is uncertainty all-around, with one ongoing theme being the post-TACO trade turning into real Tariff Fears, something to monitor in the absence of progress in trade discussions.
One sure thing is that, as mentioned in the introduction, there is some position covering in US Dollar selling which has created some immediate tops and bottoms in some major currency pairs.
My take on potential reactions to the data (Due to the unpredictable nature of Markets, reactions may differ heavily):
A major beat (over +0.1%, the bigger the beat, the heavier the reaction) will create the most panic, leading to Equities retracting from their highs, a major rise in Yields (US Treasuries selling) and US Dollar strengthening significantly and pricing out of September cuts.
A miss would most likely lead to some downside in the USD, a continued rally in Stock Indices and some relief in Bond demand, Yields falling and the pricing of some more cuts in September.
A flat reading would be leading to a small rise then some consolidation in the USD and a potential minor top in Equities due to the still high expectations for the data – July cuts get priced out further and cut premium in September starts to erode progressively for later meetings.
Technical outlook for Forex Major pairs
EURUSD 4H Chart
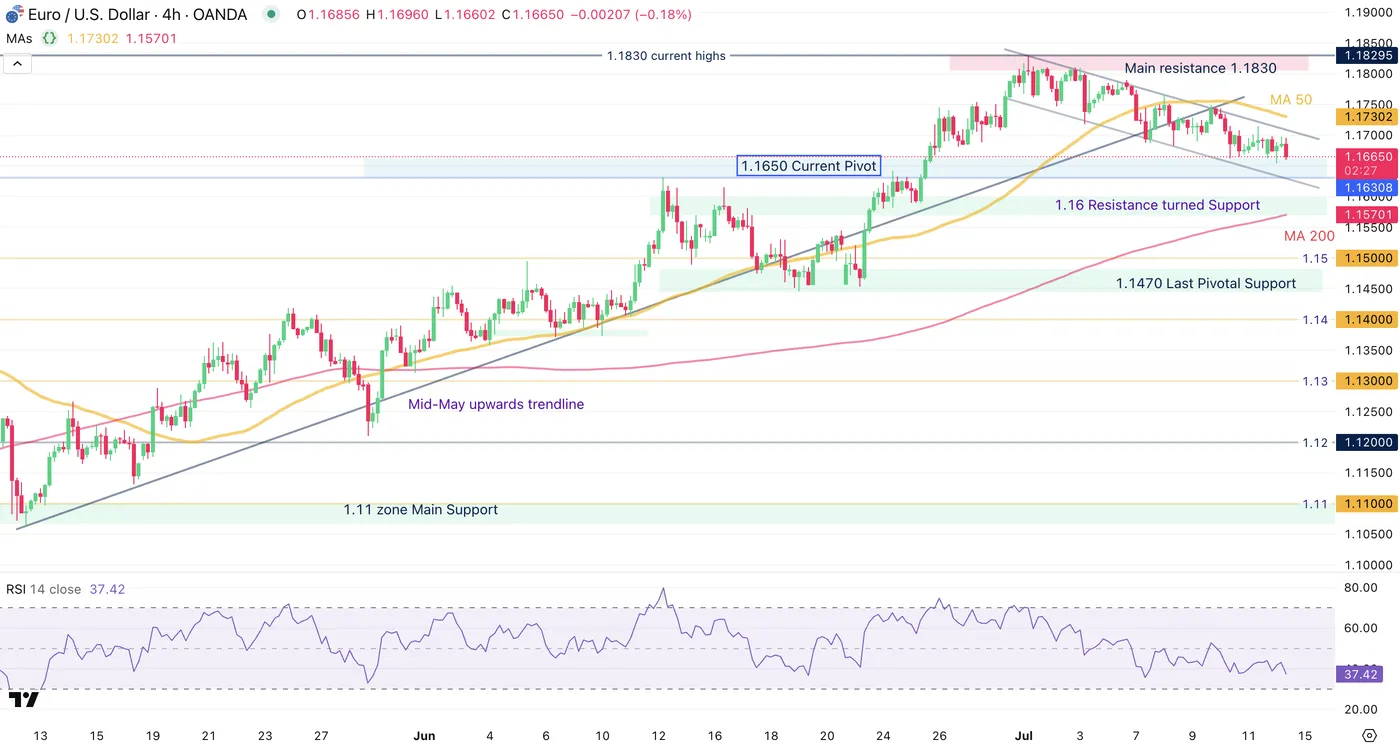
EURUSD 4H Chart, July 14, 2025 – Source: TradingView
EURUSD has marked an intermediate Top since July 1st reversal in the USD marked at 1.1830. and prices recently broke the Mid-May upward trendline that propusled the pair to its 2025 highs.
Since, Markets have formed an 800 pip-wide downwards channel which is an element to keep an eye on for reversal of acceleration of the intermediate trend.
Levels to watch for:
Support Levels:
- 1.1650 Current Pivot
- 1.16 Resistance Zone turned Support (+/- 150 pips)
- 1.1450 to 1.1470 Last Pivotal Support
Resistance Levels:
- 1.1710 Channel Highs
- 1.17280 4H MA 50
- Main resistance 1.1830
GBPUSD 4H Chart
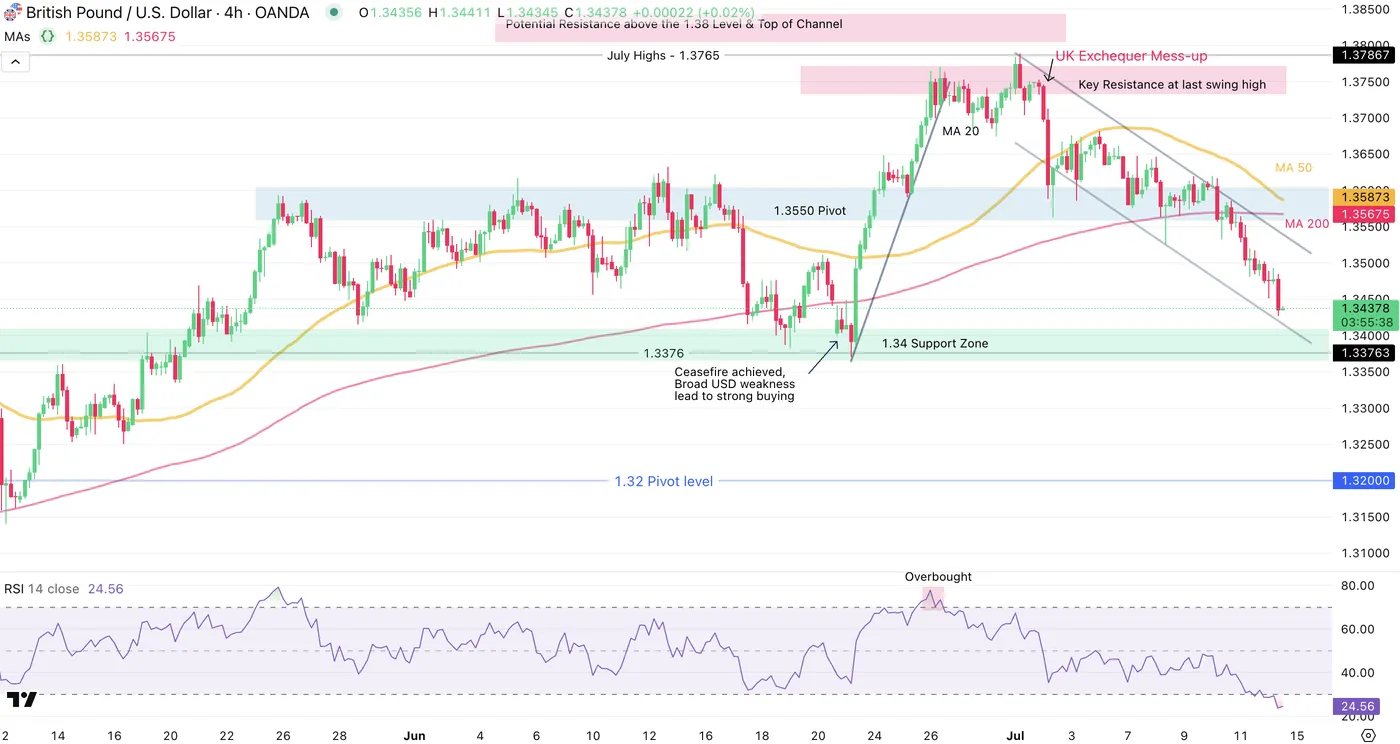
GBPUSD 4H Chart, July 14, 2025 – Source: TradingView
GBPUSD has retracted strongly since its 1.3750 July Highs overpassing 2022 levels. Some Political mess-ups and general USD Strength has led to a strong reaction, with prices currently in oversold territory and nearing a key support.
One bigger thing to look at is a Death-Cross (50 MA going below 200) further strengthening the bearish momentum – A break of the 1.34 support will hint at an acceleration of the selloff.
Support Levels:
- 1.34 Support Zone
- 1.32 to 1.3250 Major higher timeframe support
Resistance Levels:
- 1.3550 Pivot in Confluence with MA 50 and 200
- 1.3750 to 1.3765 Main Resistance
USDCAD 4H Chart
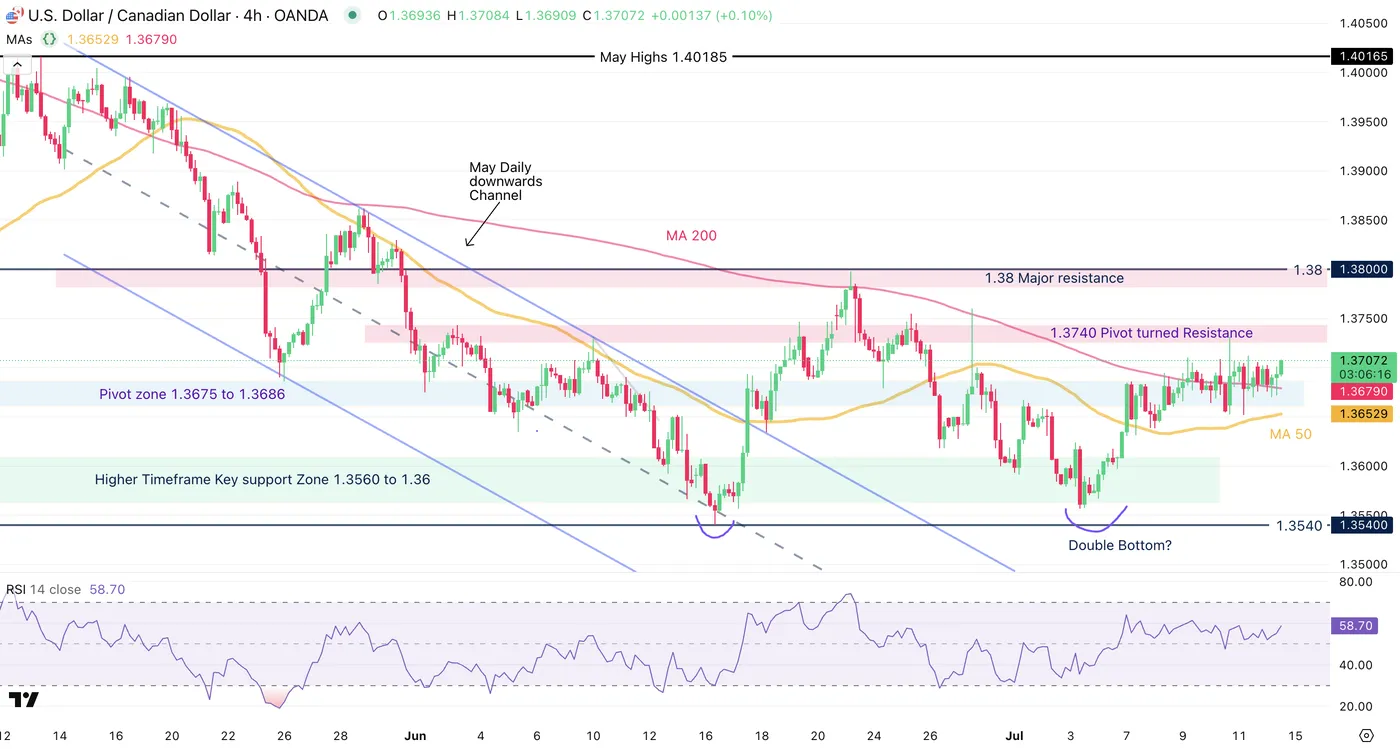
USDCAD 4H Chart, July 14, 2025 – Source: TradingView
The pair is hanging right above the 1.37 handle which will be acting as a key barometer for demand.
Overall, the price action is still contained within a 2,500 pip range – US-Canada trade talks seem to be dawdling, therefore before seeing any further continuation in prices, it seems that Markets are mostly moving on USD Demand, despite some continuous beats in Canadian data.
Support Levels:
- Pivot zone 1.3675 to 1.3686 and 4H MA 200
- 1.3650 4H MA 50
- Higher Timeframe Key support Zone 1.3560 to 1.36
Resistance Levels:
- 1.3740 Pivot turned Resistance
- 1.38 Main Resistance
USDCHF 4H Chart
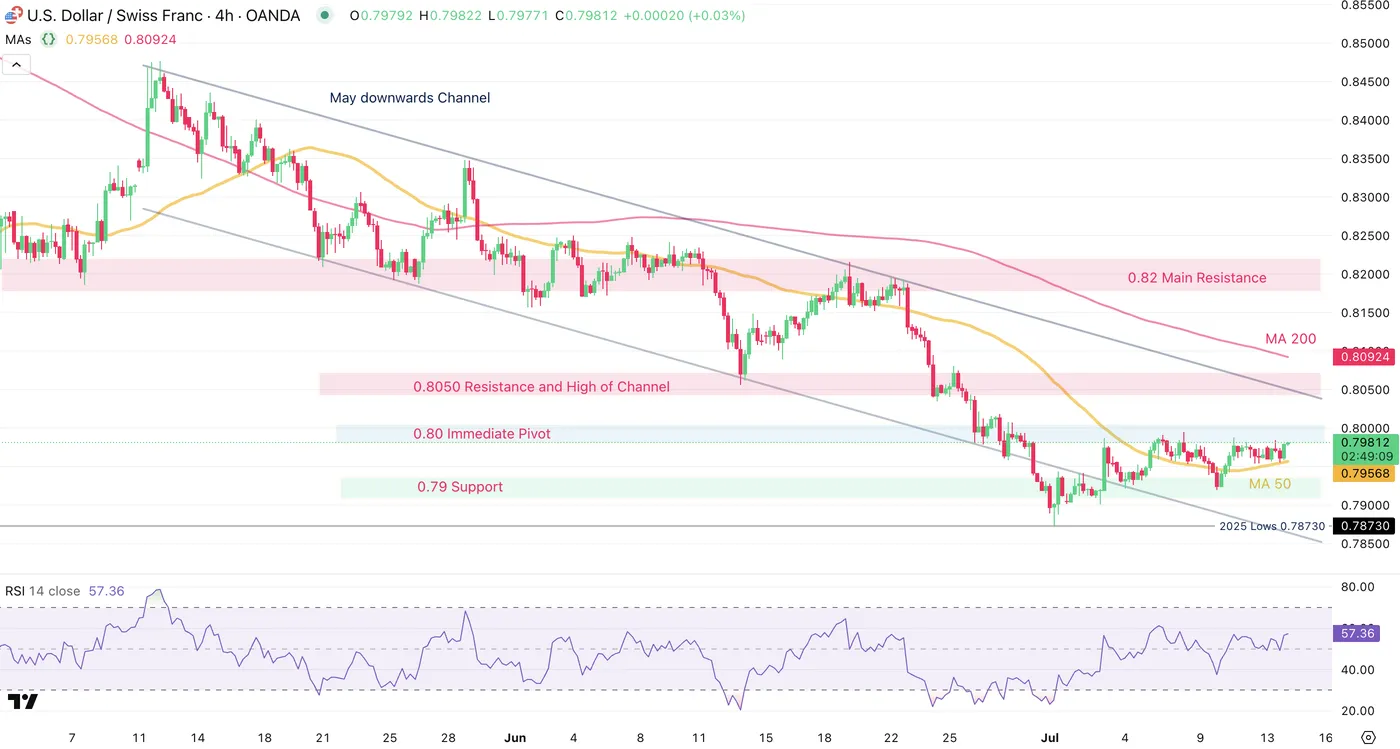
USDCHF 4H Chart, July 14, 2025 – Source: TradingView
USDCHF has marked a first rebound at 2011 14 year lows and re-integrated its downwards channel – The pair has however not regained such high momentum compared to other Majors, trading in a tight (600 pip) range since the middle of last week.
The downtrend had been very consistent in the pair, with more than broader USD strength required for the pair to regain bullish momentum – One element to note for Bulls however is the pair passing above its 4H 50-period MA for the first time since early in May, a development to monitor closely.
Support Levels:
- 0.7956
- 0.79 Support
- 0.7873 Lows
Resistance Levels:
- Immediate Pivot 0.80
- 0.8050 Resistance and High of Channel
- 0.81320 MA 200
- 0.82 Main Resistance
NZDUSD 4H Chart
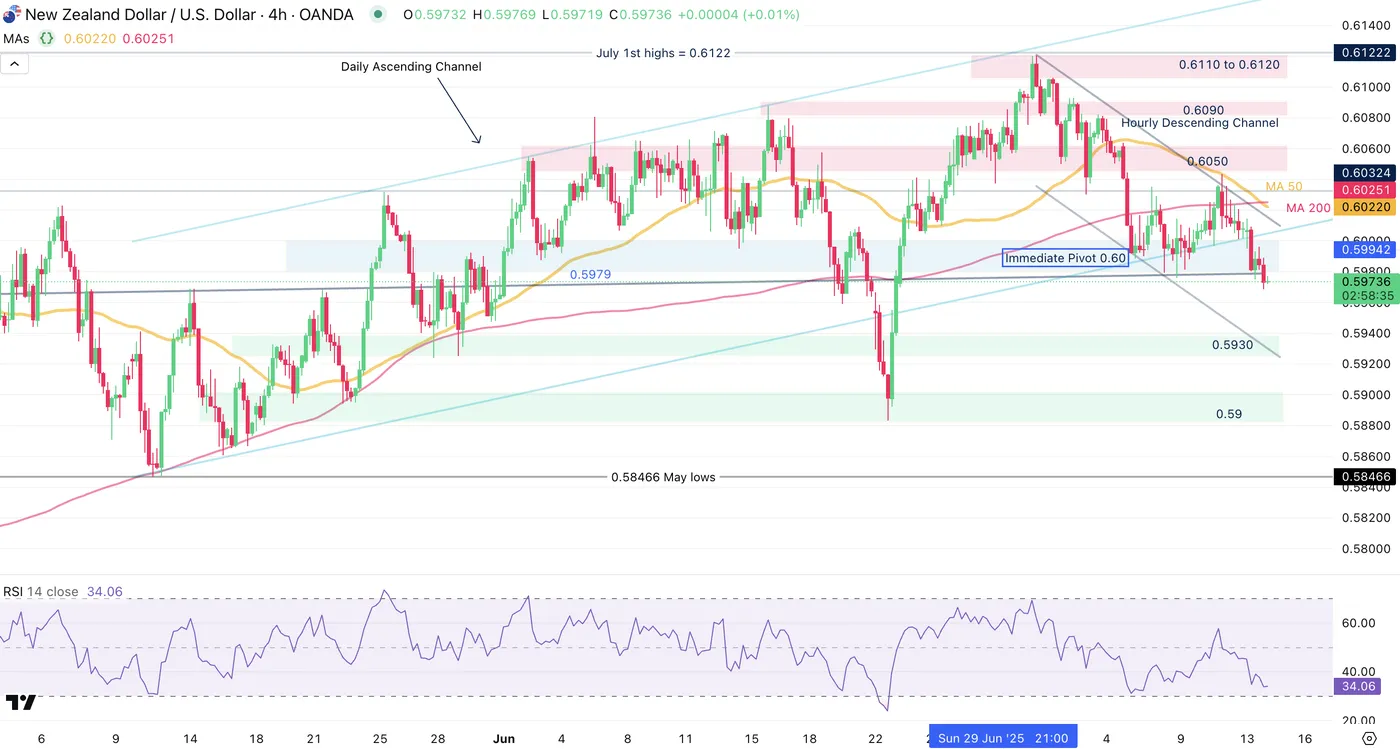
NZDUSD 4H Chart, July 14, 2025 – Source: TradingView
The Kiwi is starting to form some bearish signs, just breaking down from its yearly ascending channel and now trading below the 0.60 Psychological level.
Depending on the continuation of the US Dollar covering, the move may amplify but this will depend on the result of tomorrow's inflation data.
Two elements to look for NZDUSD trading is: A re-entry or confirmation of the ascending range (light blue limits) and the confirmation of the 4H Death-Cross
Support Levels:
- 0.5930
- 0.59 Psychological Level
- 0.58466 May lows
Resistance Levels:
- Immediate Pivot 0.60
- 0.60220 to 0.60250 4H MA 50 and 200
- 0.6050
- 0.6110 to 0.6120 2025 Highs
AUDUSD 4H Chart
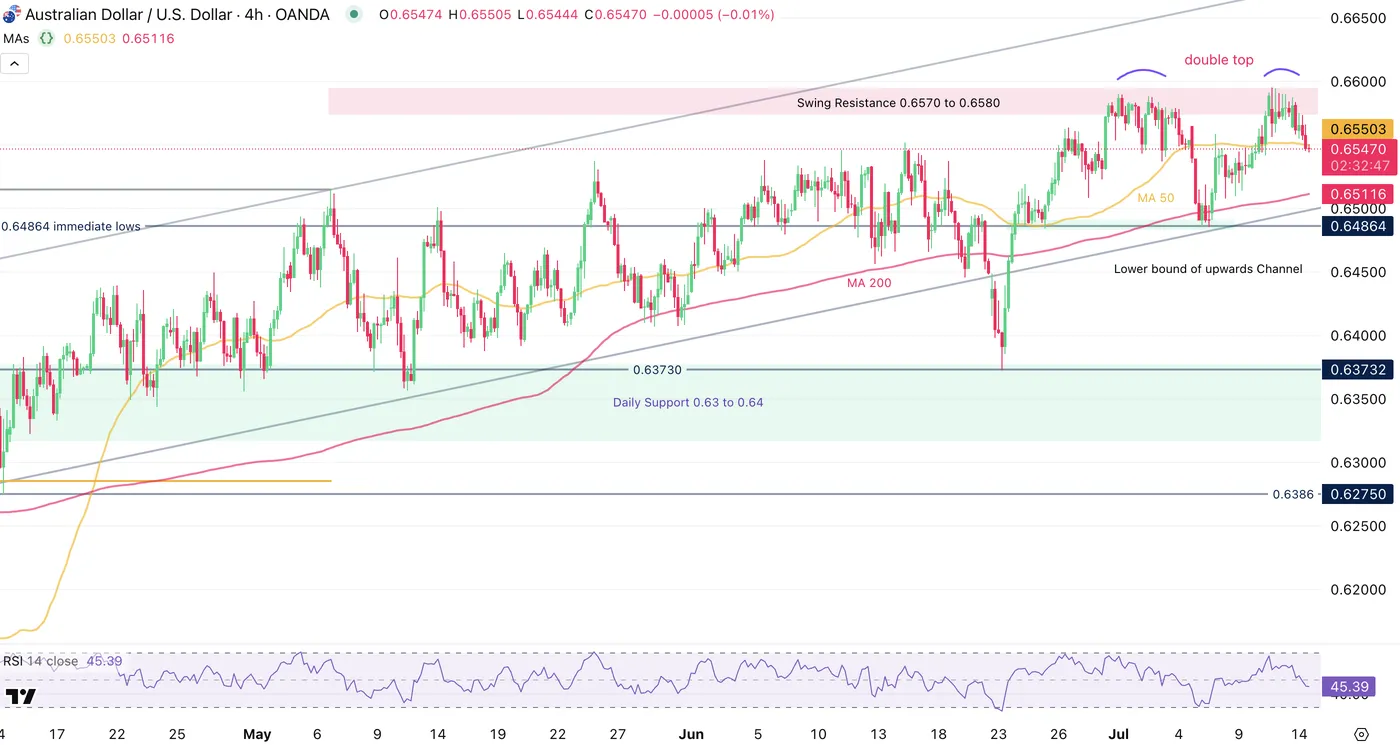
AUDUSD 4H Chart, July 14, 2025 – Source: TradingView
AUDUSD had been holding strong, particularly after last week's surprise hold (cut expected) that added to some fundamental strength in the currency.
Recent retests of the previous week highs and consequent rejection is leading to the formation of a double top. If this holds tomorrow's number, the following outlook will start to look more bearish. For now, AUDUSD is still holding its daily ascending range.
Support Levels:
- 0.6550 4H MA 50 as immediate Pivot
- 0.65 to 0.6510 Low of Channel and 4H MA 200
Resistance Levels:
- Swing Resistance and Double Top 0.6570 to 0.6580
- 0.66730 High of upwards channel
Bonne fête nationale Française (Happy French National Day) and Safe Trades going into tomorrow's Key Number!
Dow Jones (DJIA): Dow Steady at $44,417 Ahead of Key Inflation Data
The Dow Jones (US30USD) has rallied ~0.29% higher today, having found support at the bottom of the current daily range, trading at around $44,471.
Dow 30 (DJIA): Key takeaways from today’s session
- Having ended last week’s trading on a sour note, the Dow Jones has found support in today’s session and continues to trade in a period of consolidation
- Markets now turn their gaze toward tomorrow’s CPI release, with the effect of previous tariffs on otherwise cooling inflation yet to be fully understood
Dow 30 (DJIA): Trade tariffs remain a significant macroeconomic headwind for US equities
In a return to regularly scheduled programming, trade tariffs and the associated renewal of commitments to negotiation deadlines remain one of, if not the largest, determining factors in US equity performance.
Recently offered a period of comparative respite, the Dow Jones has proven particularly vulnerable to trade-related news in recent memory, especially compared to tech-led US indices like the Nasdaq-100.
For now, the $1,000,000 question remains whether Trump will remain firm with his new deadline. Naturally, much of the success of Trump’s current strong-arm tactics on trade will be determined by whether other nations believe this will be their last chance to strike a deal, or whether ongoing negotiations will allow for an extension in the deadline, not for the first time.
At the time of writing, the EU and Mexico are the latest to be caught in Trump’s crosshairs. On Saturday, Trump announced that a 30% tariff would be imposed if an agreement isn’t reached before August 1st.
With the so-called ‘Liberation Day’ sell-off still fresh in the collective mind, Trump will need to carefully navigate the next twenty days or risk inviting downside to otherwise buoyant stock market.
The markets remain primarily concerned about how tariffs could affect inflation and, therefore, the Federal Reserve’s monetary policy decisions, alongside how changes in trade relations will affect economic performance.
If put in one word, any increase in market uncertainty will harm risk appetite, which will likely bode poorly for US equities and other risk-on markets.
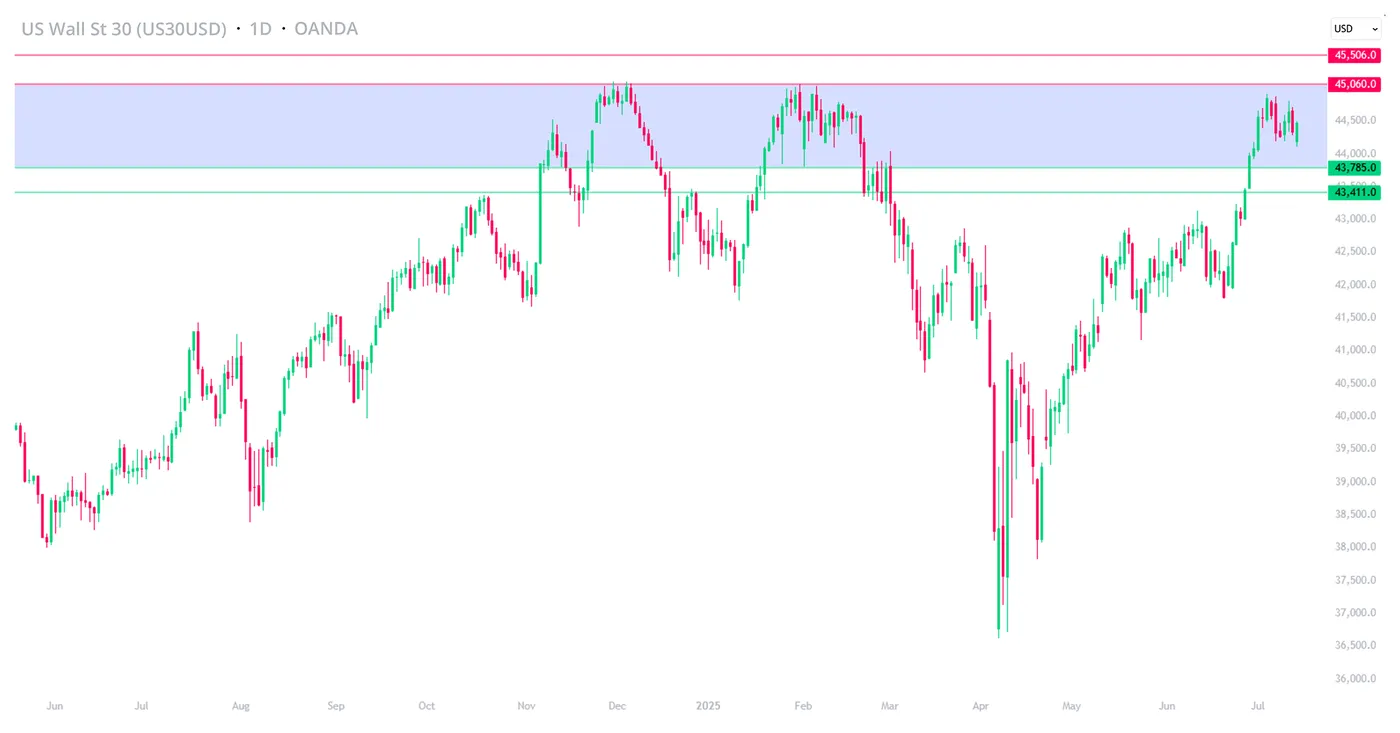
DJIA (US30USD), OANDA, TradingView, 14/07/2025
Dow 30 (DJIA): Tuesday’s CPI report remains key focus ahead of Fed rate decision
While at least ‘a couple’ of policymakers were shown to be at least considering rate cuts courtesy of last week’s FOMC minutes, a July rate cut remains overwhelmingly unlikely.
That said, markets keenly await tomorrow’s CPI release to confirm whether inflation is continuing to cool and whether previous Trump tariffs will have any adverse consequences on the data.
If inflation continues to cool, pressure will continue to mount on the Fed, which, by all accounts, will have a harder time justifying higher rates in the short term.
The above goes double as this month’s PCE report falls on July 31st, meaning that tomorrow’s report will be the last to offer any data on inflation before the Federal Reserve’s July 30th decision.
Naturally, any inclination that a potential rate cut may come sooner than expected, July or otherwise, will likely offer some buying support for US equities, the Dow Jones included.
As can be expected, US equity markets are relatively flat today ahead of tomorrow’s report.
Upcoming US Events (Tuesday 15th 2025):
- 08:30 EDT US Consumer Price Index June (MoM)
- 08:30 EDT US Consumer Price Index June (YoY)
- 08:30 EDT US Consumer Price Index Core s.a. June
- 08:30 EDT US Consumer Price Index n.s.a. June (MoM)
- 08:30 EDT US Consumer Price Index ex. Food & Energy June (MoM)
- 08:30 EDT US Consumer Price Index ex. Food & Energy June (YoY)
- 08:30 EDT US NY Empire State Manufacturing Index (Jul)
- 08:55 EDT Redbook Index (YoY)
- 09:15 EDT Fed’s Bowman speech
- 12:15 EDT Fed’s Barr speech
- 14:45 EDT Fed’s Collins speech
- 16:30 EDT API Weekly Crude Oil Stock
- 19:45 EDT Fed’s Logan speech
Silver Wave Analysis
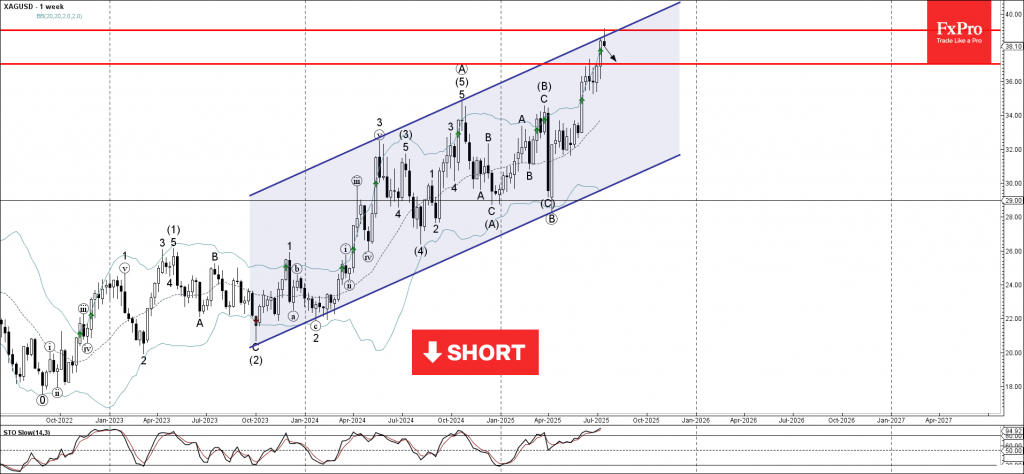
Silver: ⬇️ Sell
- Silver reversed from resistance zone
- Likely to fall to support level 37.00
Silver recently reversed down from the resistance zone lying at the intersection of the resistance level 39.00, upper weekly Bollinger Band and the resistance trendline of the weekly up channel from 2023.
The downward reversal from resistance zone created the daily Japanese candlesticks reversal pattern Shooting Star.
Given the strength of the nearby resistance zone and the overbought weekly Stochastic, Silver can be expected to fall to the next support level 37.00.
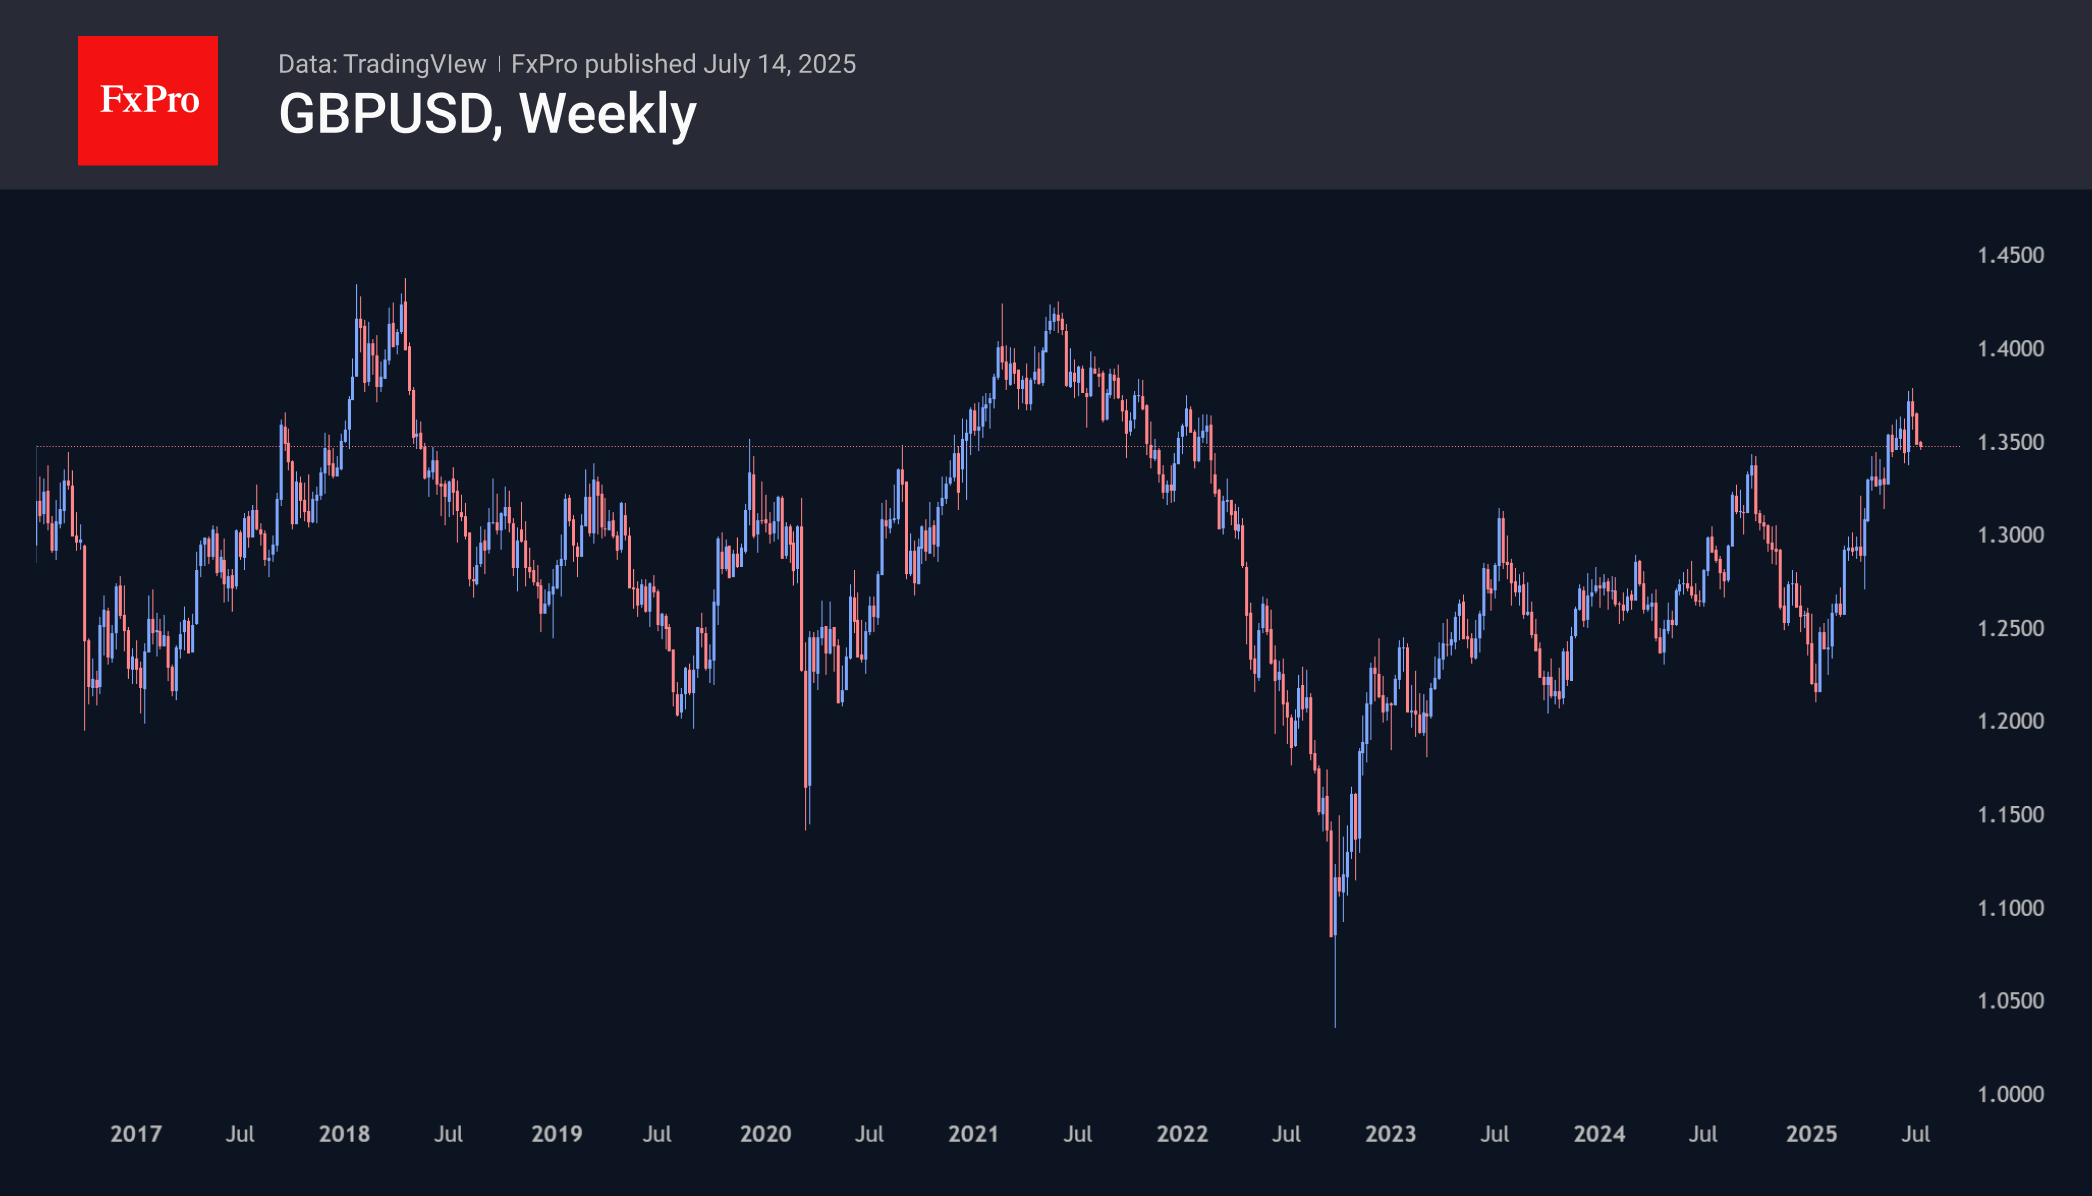
British Pound Testing Support, Risking Breaking It
The British pound fell below $1.35, confirming the downward trend since the beginning of the month. However, in recent days, this profit-taking after growth has been accompanied by the possibility of a deeper dive.
The upward trend in GBPUSD since the beginning of the year has formed a trend of higher local lows and higher highs. In April, May and June, touching the 50-day moving average spurred buyers, stopping the local retreat.
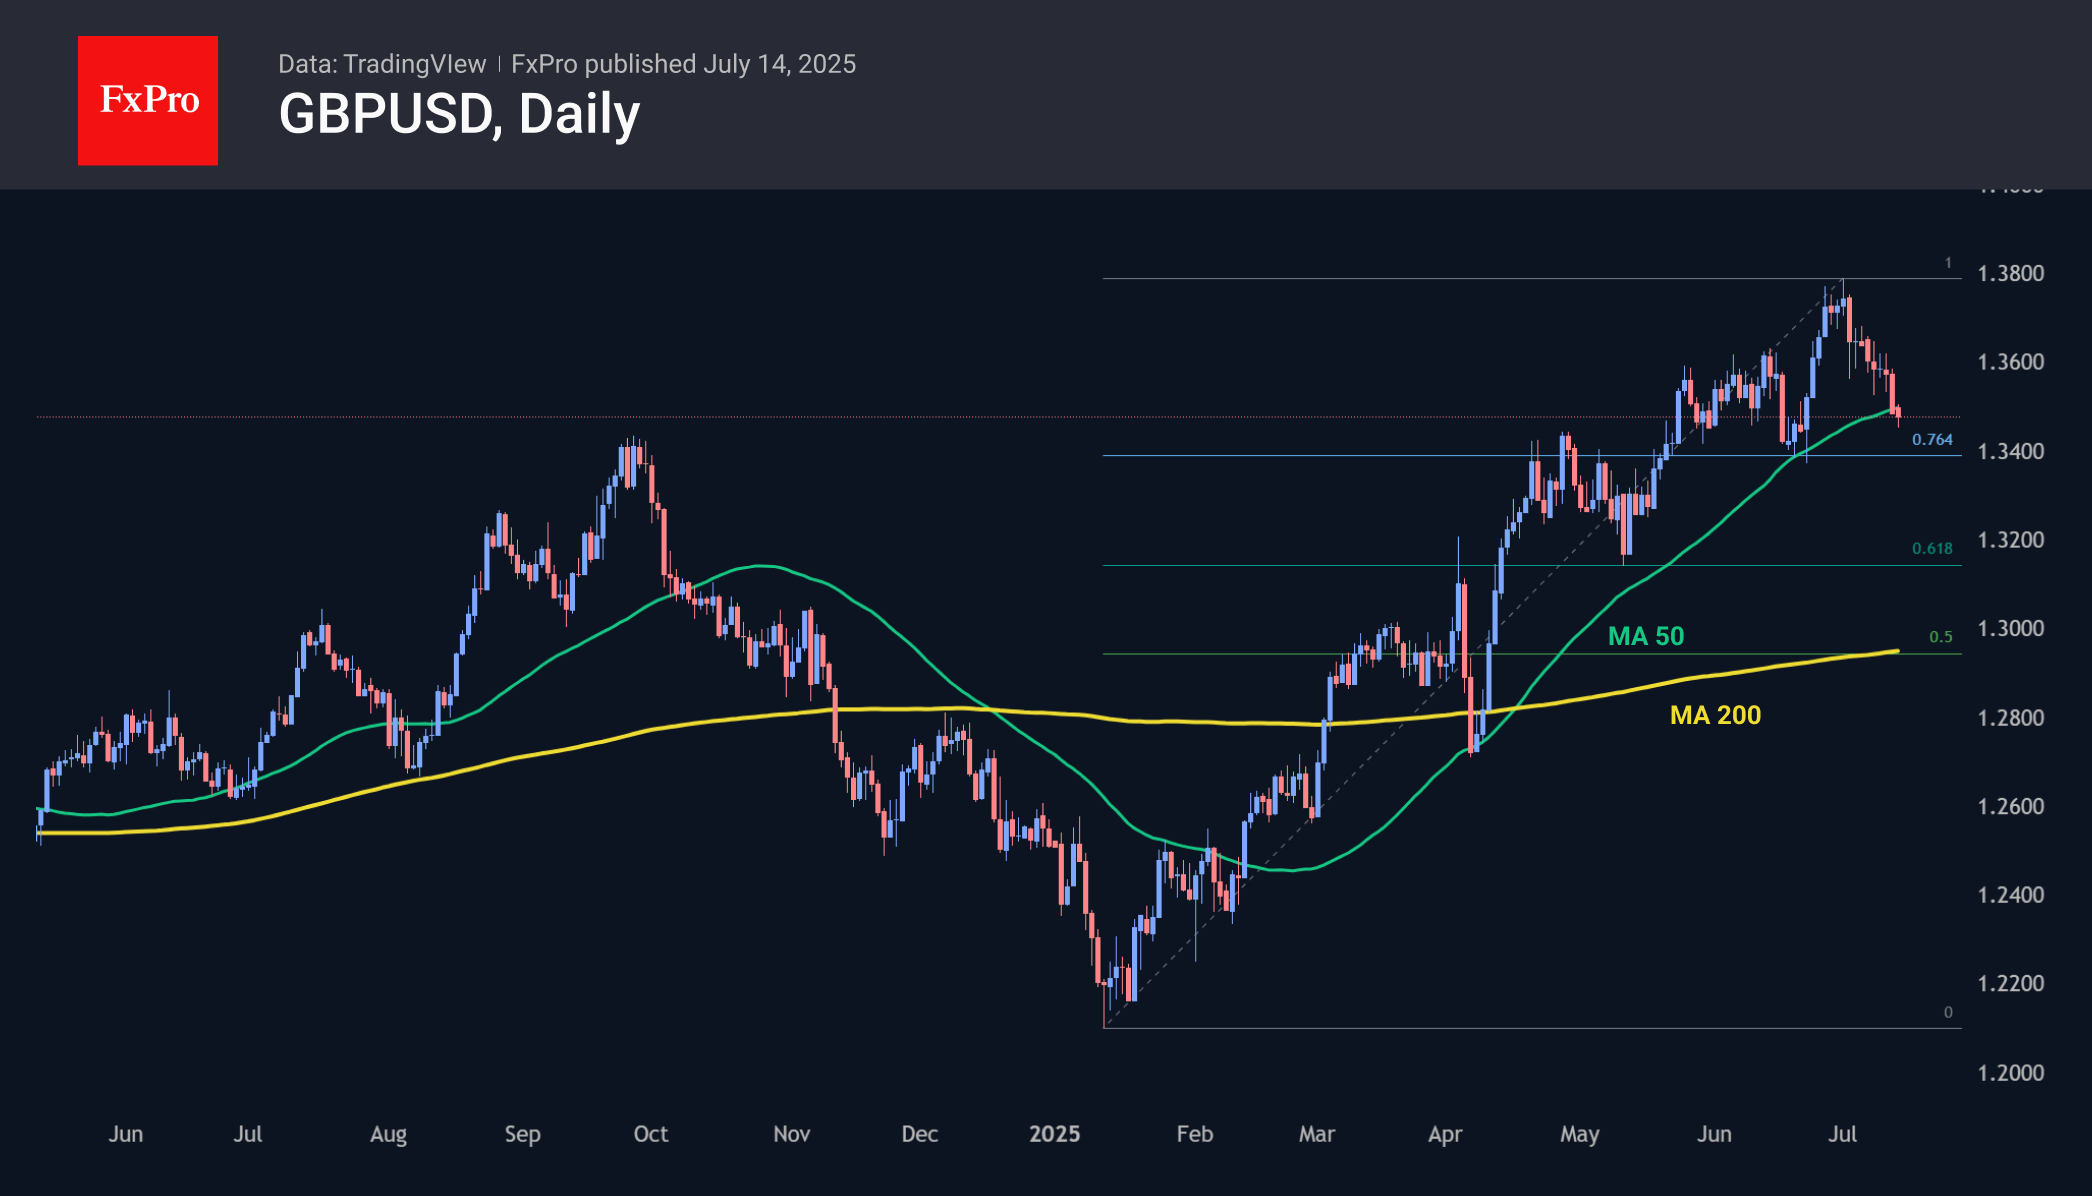
However, the new week begins with a dip below the 50-day moving average and below the round level of 1.35. Moreover, at current levels, the price is only 100 points above the previous local low, threatening to break the upward trend.
The fundamental background has also been working against the British currency recently, with the chances of the Bank of England moving further towards a more dovish position increasing. This implies lower interest rates than previously assumed by the markets. The main factor behind this revision is tariffs, which are weighing on business activity in the UK. In contrast, tariffs create inflationary risks, intensifying speculative pressure on the currency market.
The tariff wars of 2018 proved to be a bullish factor for the dollar despite its initial weakening. Even with the frightening sell-off of the dollar in the first half of the year, we may well see a repeat of this trend in the long term.
We see the levels of 1.3380, the area of previous local lows, and 1.3150, where support is at 61.8% of the growth amplitude from the January lows to the peak in early July, as potential targets for the beginning of the pullback.