Sample Category Title
USDJPY Tests the Extremes of Its Range in a Calm Forex Session
Good morning for the North-American readers and nice start to the week to everyone.
The ongoing Forex session is a very calm one, as most traders brace for the upcoming US CPI data release tomorrow, with the most moving currency in the day being the AUD and NZD seeing some selling.
France is also celebrating their National Day! (Bonne fête aux compatriotes !)
Other markets have however seen some movements:
- the Singapore STI has been making records highs on its 6th consecutive session
- Bitcoin hit highs of $123,000
- Orange Juice Futures are squeezing again (up above 18% on the session, +50% since July)
Let's prepare for tomorrow's huge number by taking a look at where we stand in the current range in USDJPY as the pair has also been rising strongly in the past two weeks.
USDJPY Analysis from the Daily to 1H Charts
USDJPY Daily Chart
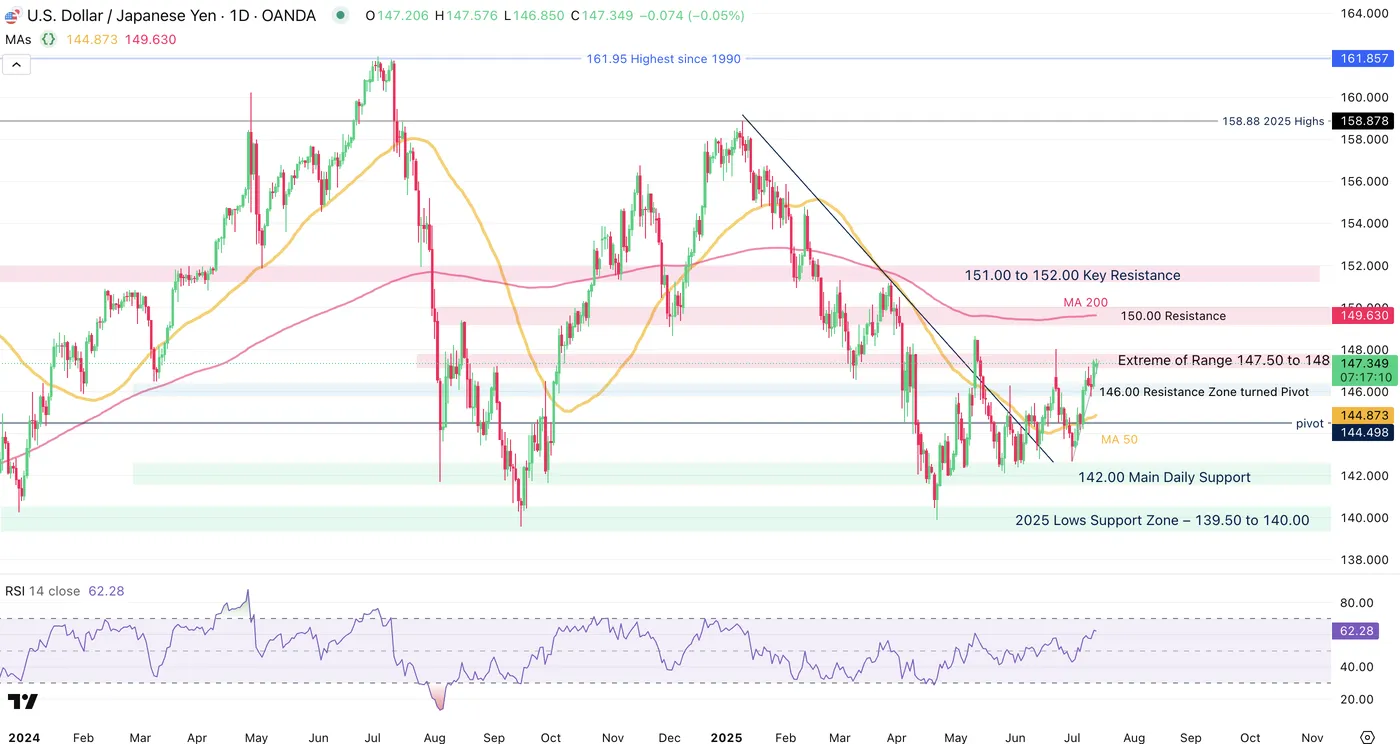
USDJPY Daily Chart, July 14, 2025 – Source: TradingView
A lack of bullish catalysts for the Yen has created a massive outflow in the currency.
The CHF is once again taking the throne for the most favored Safe-Haven major currency amid Dollar Restructuring.
The still dovish (though much less than previous years) policies from the Bank of Japan, and lack of solid hawkish communications while American rates are still at 4.50% keep giving USDJPY Buyers a fundamental edge, particularly as Dollar selling has been abating since the beginning of July.
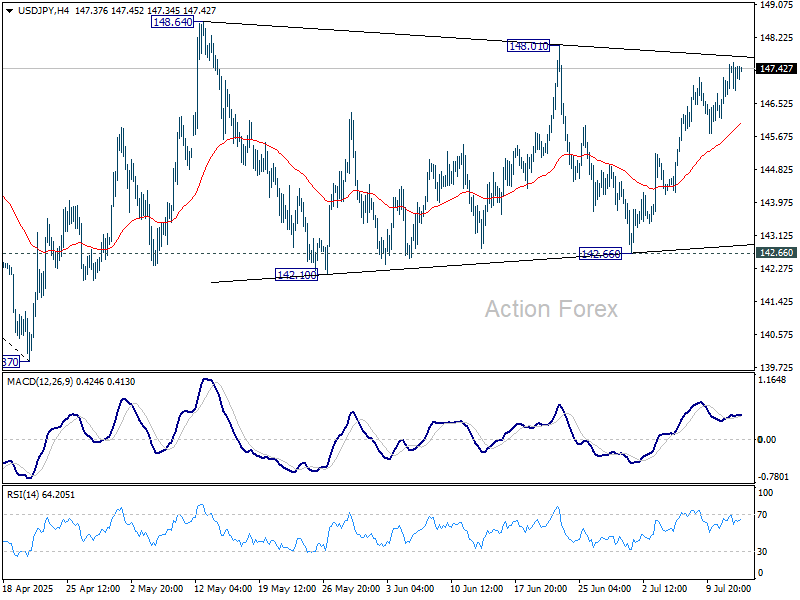
USDJPY 4H Chart
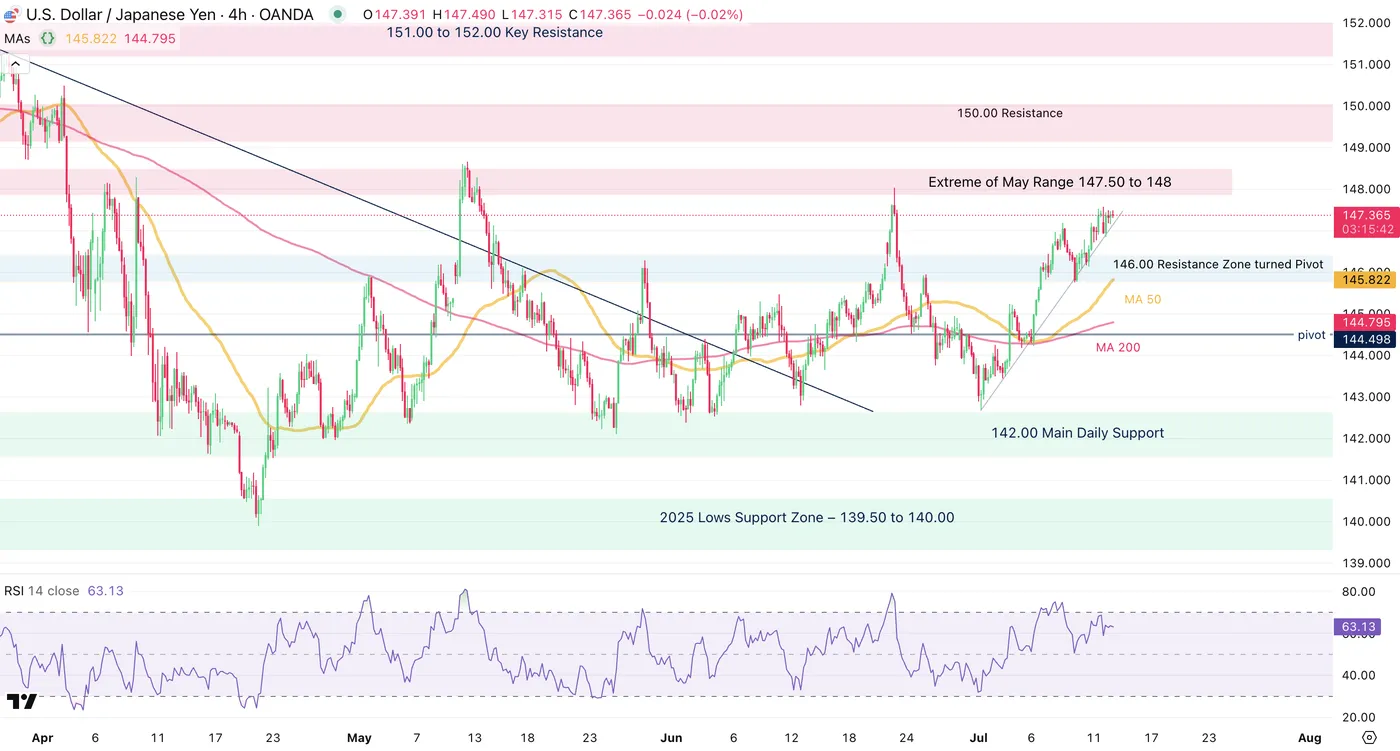
USDJPY 4H Chart, July 14, 2025 – Source: TradingView
The rebound from the 142.50 July 1st lows has been remarkable, seeing more details from the Daily chart – The 4H 50-period moving average is starting to tilt upwards, potentially giving even more underlying strength to the ongoing move.
The 4H RSI is approaching overbought but isn't there yet, with today's lack of movement helping momentum to pause which will surely be a good reason for prices to catapult upwards or downwards tomorrow – The direction is difficult to predict, but volatility is sure to be elevated.
In case of any breakout to the upside, the upcoming Resistance will be between 149.50 to 150.00.
USDJPY 1H Chart
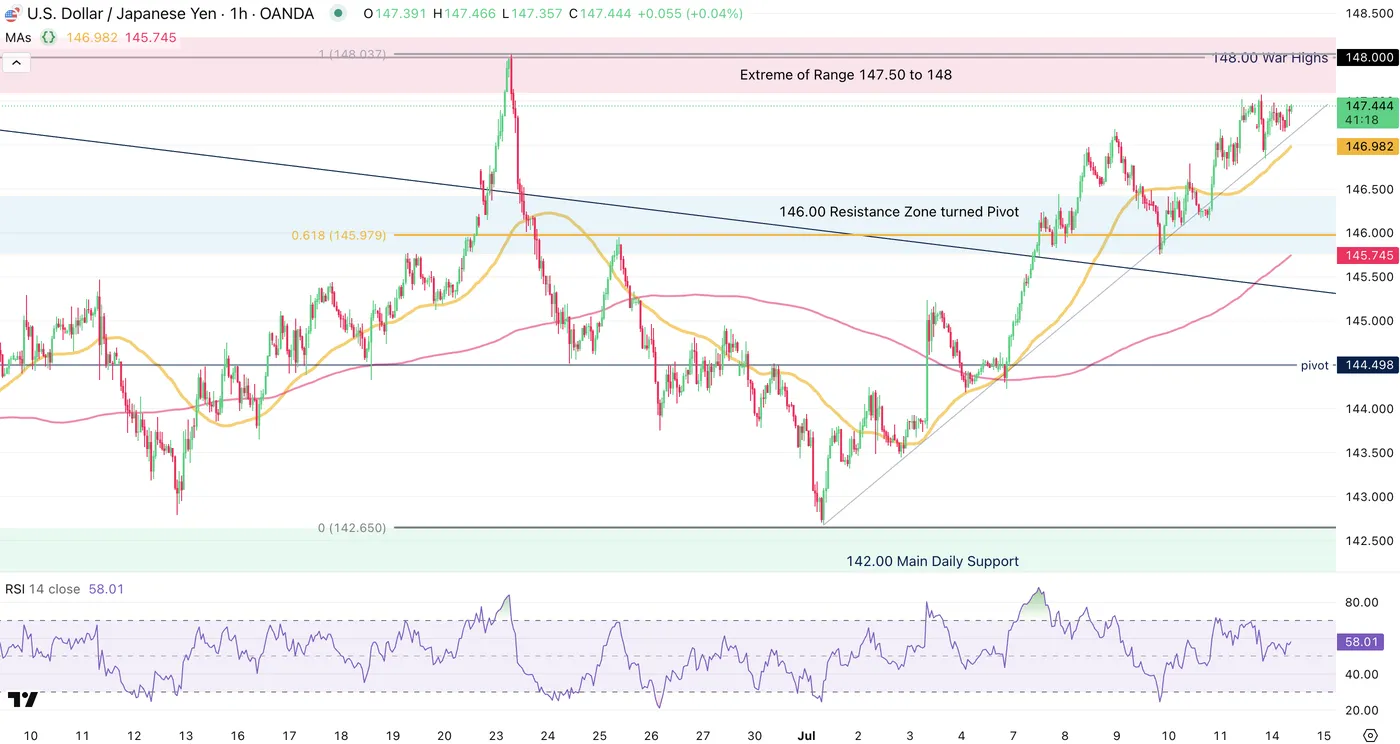
USDJPY 1H Chart, July 14, 2025 – Source: TradingView
Compared to the two other times were prices visited the extremes of the range between 147.50 to 148.00, this ongoing uptrend is more progressive and stable – In Markets, more erratic, steep trends can end more abruptly therefore keep an eye on how consistent this move has been.
It could be a sign of more progressive demand for the USD and may lead to a breakout
In any way, players will be waiting for tomorrow's data release to get a better idea of US Dollar demand which will be difficult to predict.
Any fail to break the highs of the range will confirm its solidity, leading to a higher probability of retesting at least the 146.00 Resistance turned Pivot.
A spike upwards tomorrow will surely be met with some continuation amid a potential breakout to test at least 150.00.
A consolidation around these levels also may up the probabilities of a more progressive breakout.
In the meantime, before seeing the contrary, the range is to hold, but behold tomorrow's CPI 8:30 AM release which may break any resistance or support!
Safe Trades!
Fed’s Hammack sees no urgency to cut rates, focuses on inflation
In a Fox Business interview, Cleveland Fed President Beth Hammack signaled that she sees little urgency for rate cuts given the current strength of the US economy. Hammack said Fed is “pretty close to where the neutral rate is,” and noted that unless there’s “material weakening on the labor side,” she doesn’t see a compelling case for policy easing.
While leaving the door open to shifts based on incoming data, Hammack emphasized that Fed is meeting its employment mandate, but still falling short on inflation. “We’re not there yet on the inflation side of the mandate,” she said, adding that a restrictive stance should be maintained until clear progress is made.
Sunset Market Commentary
Markets
The start of the new week was a copy-paste of last week’s. A surge in long-term Japanese bond yields weighed on other core bonds too. Japan’s 30-yr yield shot up another 11 bps to be just 3 bps away from the tenor’s record 3.2% of May this year. The driving force, just as last week, is investor concern about fiscal stimulus in the run-up and aftermath of this Sunday’s Upper House elections. Spillovers affect US Treasuries with the long end of the curve adding up to 4 bps at some point. The 30-year (4.98%) is closing in on the symbolically and technically important 5% barrier. President Trump’s renewed tariff threat vs Europe (and others, including Mexico) towards the end of last week could be lingering as well in the form of increasing inflation expectations. That’s what dragged the long end of the curve on Friday anyway. Short-term yields in the US add between 1.2-1.7 bps. The bear steepening also shows up on European soil. Swap rates in the region rise up to 2.7 bps, pushing the 30-yr maturity to a new 1.5 year high (2.88%). Gilts slightly outperform today, lead by the front end. This came after Bailey highlighted the potential for bigger rate cuts in an interview with The Times yesterday. The Bank of England governor stuck with the official guidance of going “gradual and careful” due to inflation still being above target. But he also said that “if we saw the slack opening up much more quickly, that would lead us to a different conclusion.” Bailey referred to an economy growing below potential and businesses adjusting employment and offering lower pay rises, amongst others due to this year’s increase of the businesses national insurance contribution. UK yields lose around 2.9-4 bps in the 2-5 year bucket. UK money markets are upping bets for more than two (quarterly) remaining rate cuts this year.
The aforementioned weighs on the pound sterling for a second day straight after Friday’s surprisingly weak monthly GDP and industrial production prints. EUR/GBP rallies to 0.867, the highest level since mid-April. The 0.874 level hit intraday back then serves as a first resistance. Major currencies such as the euro and the dollar trade more or less in balance, adding to evidence that markets are not taking Trump and his tariff threats too seriously. EUR/USD at around 1.1686 tries to keep the upward sloping trend line since early March in tact. The 8-day bottoming out in DXY (mostly a JPY story) is running into resistance near the 98 barrier, which coincides with the upper bound of a short-term downward sloping trend channel.
News & Views
The German Bundesbank published a study looking into the sustained decline in German export market shares. They haven been contracting since 2017 and increasingly falling behind those of other advanced economies since 2021. More than three-quarters of the export market share losses between 2021 and 2023 were due to the deterioration in German exporters’ competitiveness. This points to fundamental structural problems. To this end, incentives to work should be strengthened, barriers to the immigration of skilled workers and unnecessary red tape should be cut back, tax incentives for private investment increased, and conditions for start-ups and research and development improved, to name a few examples. In addition, weak global demand for motor vehicles, in particular, dampened the development of German export market shares through product-specific demand effects. Energy price increases and supply chain disruptions also played a significant role. In separate comments, German Chancellor Merz today said that the proposed 30% reciprocal tariffs from the US on EU goods would hit the export industry to the core. Merz is really committed to finding a trade deal by the August 1 deadline.
People familiar with the matter indicate that the Bank of Japan will likely consider raising its core CPI forecast for fiscal year 2025 from the current 2.2% after food inflation proved more sticky than expected in the previous quarterly update. Higher oil prices are another reason for increasing inflation forecasts. The next update will be released on July 31st. The BoJ can likely retain its view that Japan’s price trend will be consistent with its sustainable inflation goal in the second half of the three-year outlook period, bolstering the case for eventual further rate hikes. The central bank’s quarterly household opinion survey showed households expecting prices to rise by an average 12.8% a year from now, highest since September 2006 and by an average of 9.9% over the next five years, the highest on record.
Australian Dollar Eyes China GDP
The Australian dollar has edged lower on Monday. In the North American session, AUD/USD is trading at 0.6555, down 0.32% on the day. The Aussie took advantage of US dollar weakness last week as it touched a high of 0.6593, its highest level since November 2024.
China's GDP expected to ease to 5.1%
China's economy is expected to have grown by 5.1% in the second quarter, after back-to-back quarters of gains of 5.4%. The government's annual growth target is around 5.0%, and policymakers won't complain if this target is exceeded for a third consecutive quarter.
Exports were up 5.8% y/y in June, above the consensus of 5.0% and well above the May gain of 4.8%. The jump in exports was driven by a trade truce with the US that lowered tariffs on Chinese goods from 145% to 55%. Still, the economic picture is uncertain as the tariff truce ends in August.
China will also release industrial production and retail sales for June, with the markets forecasting weaker numbers. Industrial production, which has been decelerating in recent months, is expected to ease to 5.6% from 5.8%, while retail sales are expected to fall to 5.6%, down from 6 .4% in May, which was the strongest level since December 2023.
Australia releases Westpac Consumer Sentiment on Tuesday, with a forecast of a 0.4% gain for July . This follows a 0.4% gain in June. Consumers remain cautious, despite the Reserve Bank of Australia's rate cut in May and lower inflation.
The RBA shocked the markets last week when it maintained the cash rate at 3.85%, as all signs appeared to point to a quarter-point cut. The RBA meets next on August 12.
AUDUSD Technical
- AUD/USD is testing support at 0.6562. Below, there is support at 0.6550
- There is resistance at 0.6570 and 0.6582
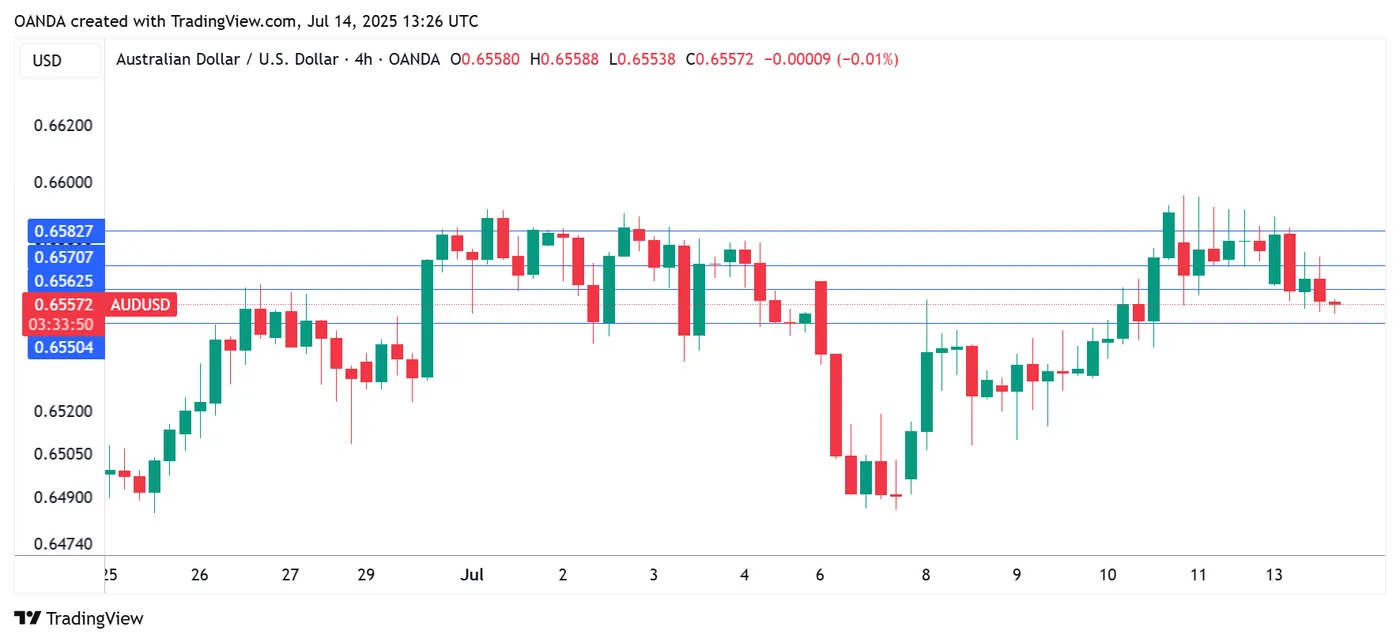
AUD/USD 4-Hour Chart, July 14, 2025
WTI Oil Advances as 200-day MA Serves as Support, Chinese Imports Soar
Oil prices advanced this morning following a bullish close on Friday. It appears that the fears market participants had in regards to a recession may be waning and this has helped Oil prices.
Economists now predict better growth, more jobs, a lower chance of a recession, and slower inflation compared to three months ago, according to The Wall Street Journal's quarterly survey. On average, economists see a 33% chance of a recession in the next year, down from 45% in April but higher than 22% in January.
OPEC + Projects Strong Q3 Demand
Another reason oil prices could be on the up this morning comes from OPEC +. Russia's RIA news agency quoted Haitham Al Ghais on Monday as telling journalists on the sidelines of last week's OPEC seminar in Vienna that the organization expects oil demand to grow by 1.3 million barrels per day in 2025, driven by a strong global economy.
Al Ghais said there is strong demand growth, especially in the third quarter, and good demand growth in the fourth quarter, with tight supply-demand balances. This is why the group of eight countries is increasing oil production, according to the report.
OPEC and its allies are increasing oil production and expect strong demand in the third quarter, with a tight balance between supply and demand in the coming months. According to five sources who spoke to Reuters, OPEC+ plans to approve another large increase in oil production for September, as reported by Reuters.
Chinese Crude Imports Soar
China's crude oil imports bounced back in June, hitting their highest daily rate since August 2023. This happened as refineries increased production and imports from Saudi Arabia and Iran grew, according to consultancies.
China, the world's largest oil buyer, imported 49.89 million metric tons of oil in June, equal to 12.14 million barrels per day, based on data from the General Administration of Customs. This was a 7.1% increase from May's 46.6 million tons and 7.4% higher than the same time last year.
Kpler reported that imports from Saudi Arabia rose by 845,000 barrels per day to 1.78 million barrels per day, as lower prices encouraged Chinese refiners to buy more oil.
China's crude oil stocks also grew by 82 million barrels in the second quarter of 2025, according to the International Energy Agency (IEA).
New policies in China are making oil companies long-term storage partners for the government, keeping these stocks out of the global market, the IEA said. The agency also noted that Chinese companies are expected to keep building up oil inventories, which will play a key role in balancing the market in the coming months.
The fact that China will continue building its oil inventories bodes well for Oil prices and could keep prices supported.
Looking Ahead - Potential Sanctions on Russia to Aid Oil Prices?
US President Donald Trump announced on Sunday that he will send Patriot air defense missiles to Ukraine. He is also set to make a "major statement" about Russia on Monday, expressing frustration with President Vladimir Putin over the lack of progress in ending the war in Ukraine.
To push Russia into serious peace talks with Ukraine, a bipartisan US bill proposing new sanctions on Russia gained support in Congress last week.
Meanwhile, European Union envoys are close to finalizing their 18th round of sanctions against Russia. This package is expected to include a lower price cap on Russian oil, according to four EU sources after a Sunday meeting.
Sanctions have thus far failed to dent Russian oil exports, will this package prove any different? It will be interesting to hear from President Trump and gauge if market participants react to any statement made.
Any sign that Russian exports may be affected could see a spike in Oil prices, however given the flip-flopping we have seen from the Trump administration, markets may ignore the announcement.
Technical Analysis - WTI
From a technical analysis standpoint, Oil prices bounced off the ascending trendline on Friday.
The daily candle closed as a bullish engulfing and has broken above the 200-day MA. We saw a retest of the 200-day MA this morning before oil prices moved higher once more.
For now bulls remain firmly in control with a daily candle close below the swing low at 66.81.
Immediate resistance rests at 71.38 with a break above facing resistance at 73.20 and the psychological 75.00 handle.
Support may be found at the 200-day MA which rests at 68.47 before the all-important swing low at 66.81.
WTI Oil Daily Chart, July 14, 2025
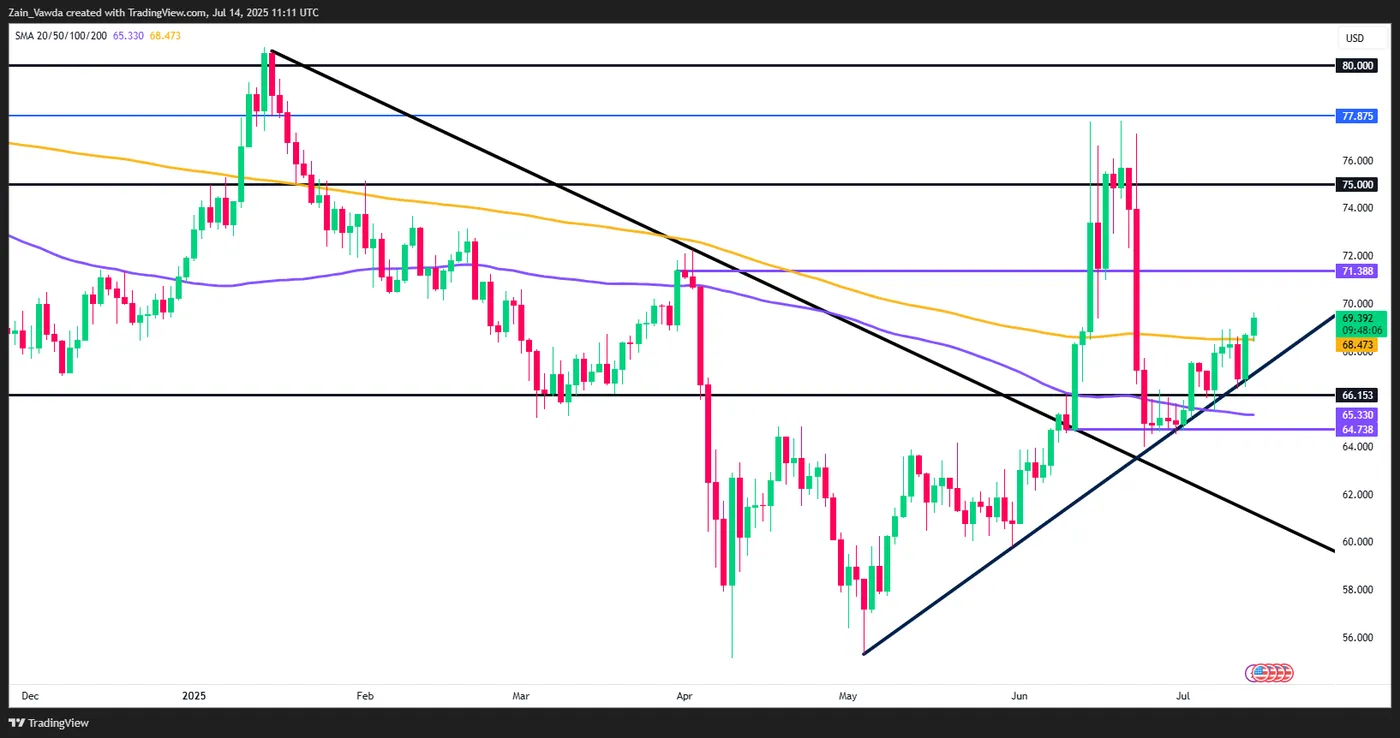
Source: TradingView (click to enlarge)
Client Sentiment Data
Looking at OANDA client sentiment data and market participants are long on WTI with 73% of traders net-long. I prefer to take a contrarian view toward crowd sentiment and thus the fact that so many traders are long means WTI prices could decline in the near-term.
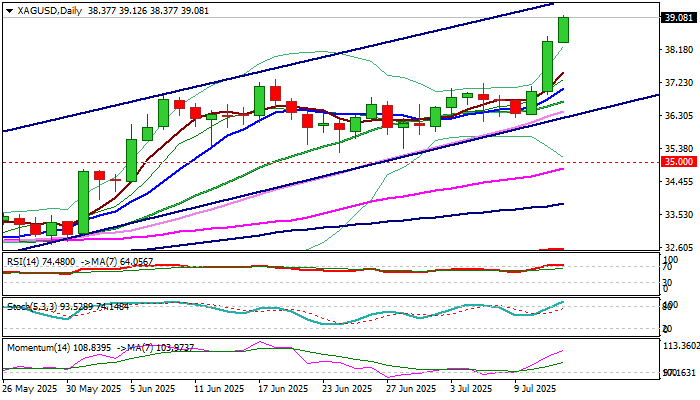
XAG/USD: Silver Hits New Multi-Year High
Silver hit the highest in nearly 14 years on Monday, testing levels above $39 as strong bullish acceleration extends into third consecutive day.
Growing uncertainty over US tariffs and weak economic outlook continue to fuel demand and underpin the price.
Fresh rally broke above recent $35.30/$37.30 consolidation range, signaling continuation of broader uptrend and unmasking psychological $40 barrier.
Technical picture on daily chart is firmly bullish but overbought that threatens of increased headwinds on approach to $40 target.
This may put bulls on hold for consolidation which should ideally hold above $37 zone (former breakpoint, reverted to support) to keep bulls intact for fresh push higher.
Sustained break above $40 to generate fresh bullish signal and expose targets at $40.68 (Fibo 76.4% of $49.78/$11.23, 2011/2020 downtrend) and $41.00 (round-figure).
Caution on loss of $37 handle that would weaken near-term structure and risk attack at lower pivots at $35.00 zone (former range floor / broken Fibo 61.8% of $49.78/$11.23 downtrend).
Res: 39.50; 40.00; 40.68; 41.00.
Sup: 38.25; 37.31; 36.15; 35.00.
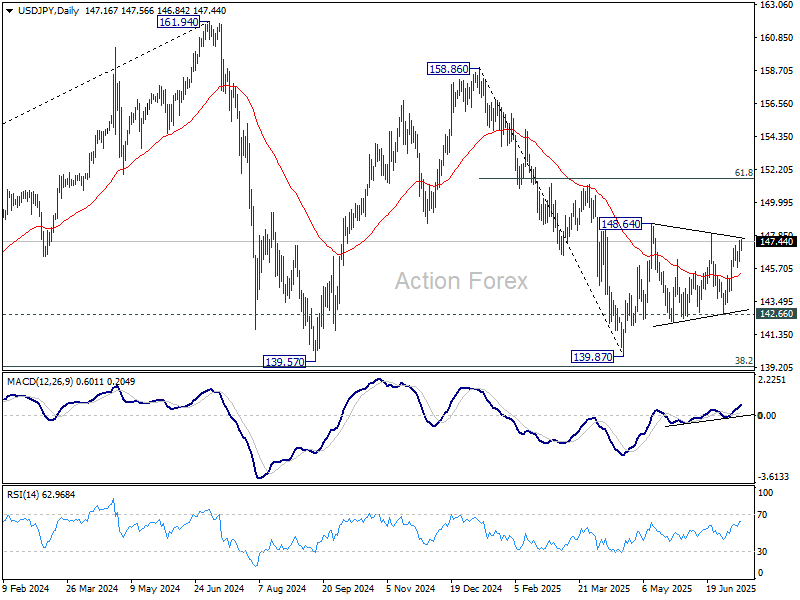
USD/JPY Mid-Day Outlook
Daily Pivots: (S1) 146.53; (P) 147.03; (R1) 147.91; More...
Intraday bias in USD/JPY stays neutral with focus on 148.01 resistance. Firm break there will indicate that consolidations pattern from 148.64 has completed. Further rise should then be seen to resume the rally from 139.87, to 61.8% retracement of 158.86 to 139.87 at 151.22.
In the bigger picture, price actions from 161.94 (2024 high) are seen as a corrective pattern to rise from 102.58 (2021 low). There is no clear sign that the pattern has completed yet. But still, strong support is expected from 38.2% retracement of 102.58 to 161.94 at 139.26 to bring rebound.
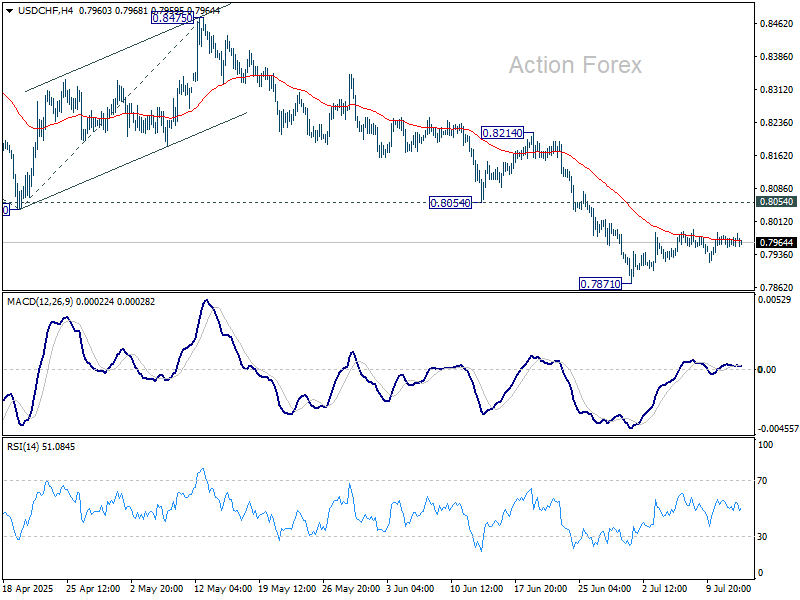
USD/CHF Mid-Day Outlook
Daily Pivots: (S1) 0.7953; (P) 0.7968; (R1) 0.7981; More….
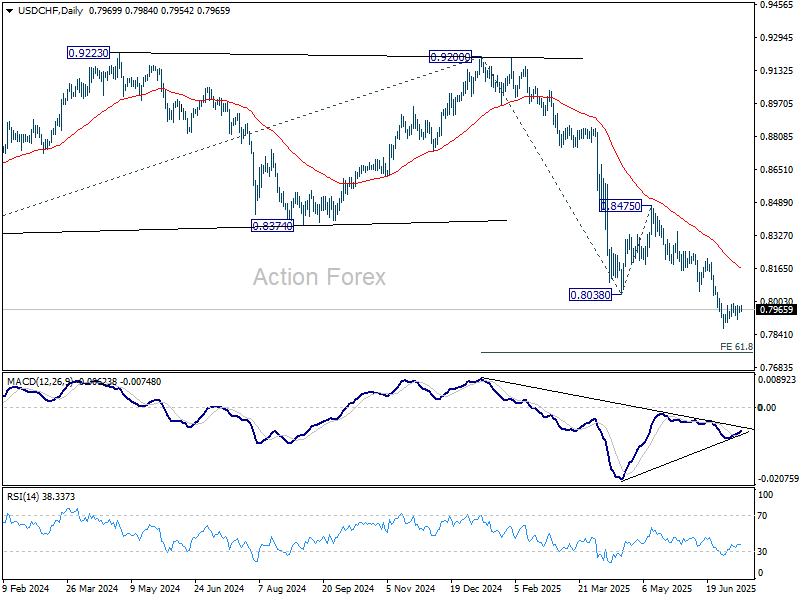
USD/CHF is still extending the consolidations from 0.7871 and intraday bias stays neutral. Stronger recovery might be seen but upside should be limited by 0.8054 support turned resistance. On the downside, firm break of 0.7871 will extend the larger down trend to 61.8% projection of 0.9200 to 0.8038 from 0.8475 at 0.7757.
In the bigger picture, long term down trend from 1.0342 (2017 high) is still in progress. Next target is 100% projection of 1.0146 (2022 high) to 0.8332 from 0.9200 at 0.7382. In any case, outlook will stay bearish as long as 0.8475 resistance holds.
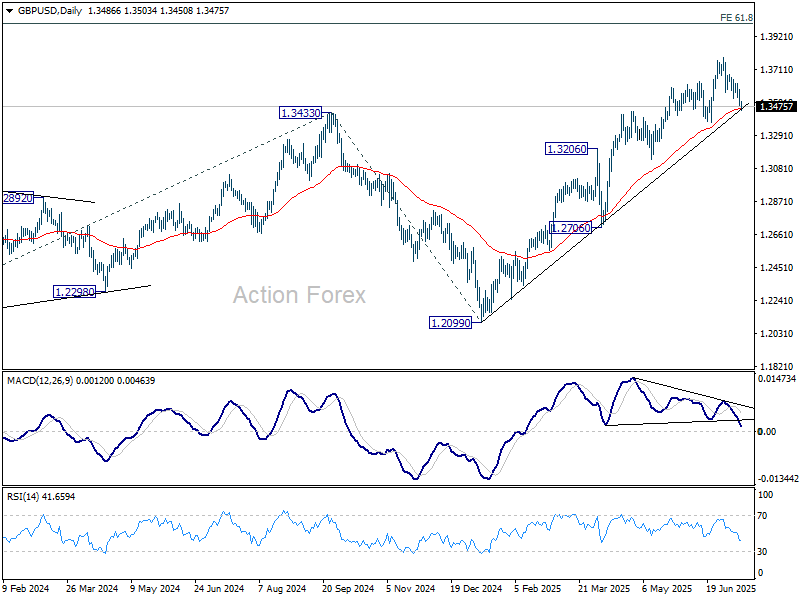
GBP/USD Mid-Day Outlook
Daily Pivots: (S1) 1.3454; (P) 1.3520; (R1) 1.3559; More...
Intraday bias in GBP/USD stays neutral first. Pullback from 1.3787 could extend lower but downside is expected to be contained by 1.3369 support to bring rebound. On the upside, above 1.3680 minor resistance will bring retest of 1.3787. Firm break of 1.3787 will resume larger up trend to 100% projection of 1.2099 to 1.3206 from 1.3138 at 1.3813. However, firm break of 1.3369 will bring deeper correction back to 1.2706/3206 support zone.
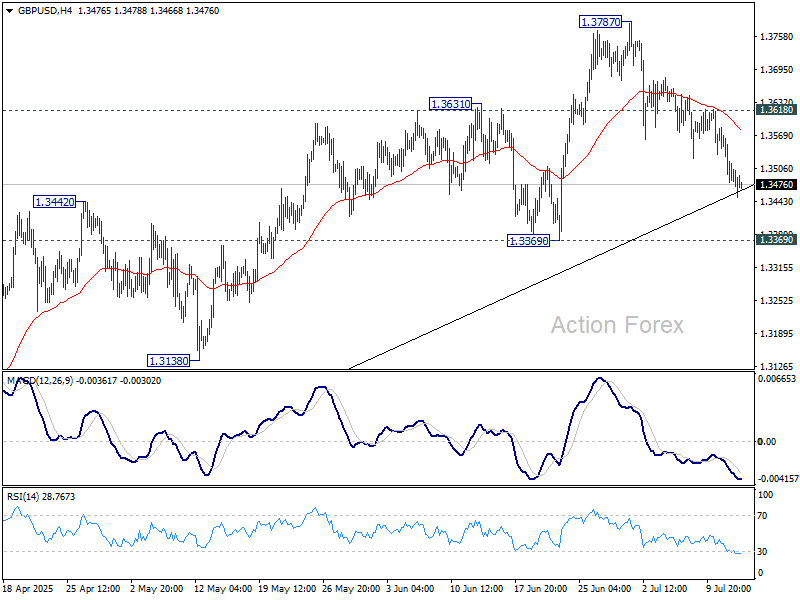
In the bigger picture, up trend from 1.3051 (2022 low) is in progress. Next medium term target is 61.8% projection of 1.0351 to 1.3433 from 1.2099 at 1.4004. Outlook will now stay bullish as long as 55 W EMA (now at 1.3019) holds, even in case of deep pullback.
EUR/USD Mid-Day Outlook
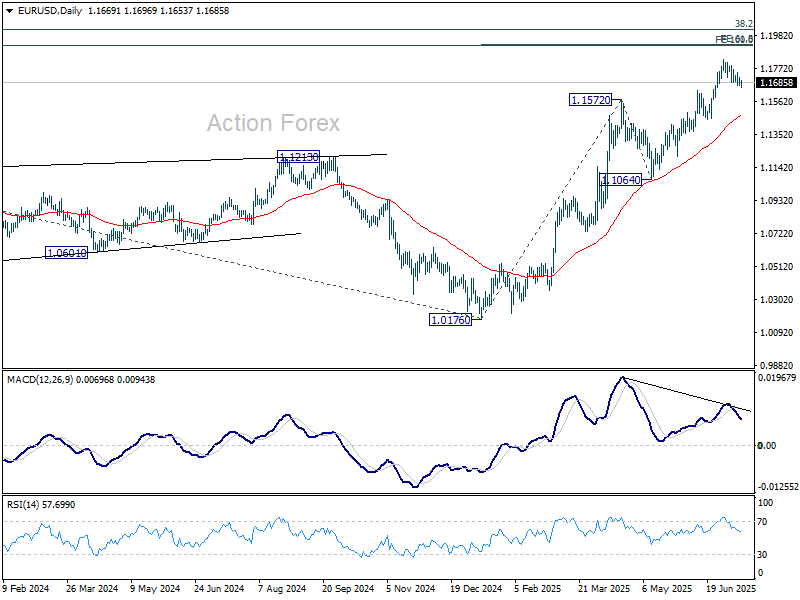
Daily Pivots: (S1) 1.1665; (P) 1.1690; (R1) 1.1714; More...
EUR/USD is still extending the correction from 1.1829 and intraday bias remains neutral for the moment. Downside should be 1.1630 resistance turned support to bring rebound. Firm break of 1.1829 will resume the rise from 1.0176 and target 61.8% projection of 1.0176 to 1.1572 from 1.1064 at 1.1927. However, sustained break of 1.1630 will bring deeper fall to 55 D EMA (now at 1.1474) instead.
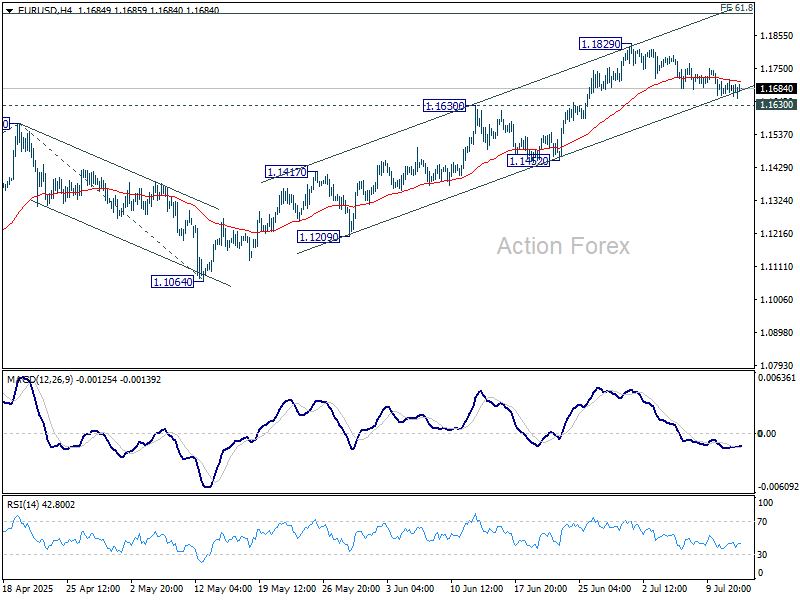
In the bigger picture, rise from 0.9534 long term bottom could be correcting the multi-decade downtrend or the start of a long term up trend. In either case, further rise should be seen to 100% projection of 0.9534 to 1.1274 from 1.0176 at 1.1916. This will now remain the favored case as long as 1.1604 support holds.