Sample Category Title
EUR/AUD Daily Outlook
Daily Pivots: (S1) 1.7729; (P) 1.7766; (R1) 1.7812; More...
Intraday bias in EUR/AUD remains mildly on the upside for the moment. Sustained trading below 55 D EMA (now at 1.7694) will argue that corrective pattern from 1.8554 is already in the third leg. Deeper fall should then be seen back to 1.7245 support. Nevertheless, strong rebound from 55 D EMA will maintain near term bullishness. Break of 1.7872 support turned resistance will bring retest of 1.8094 resistance.
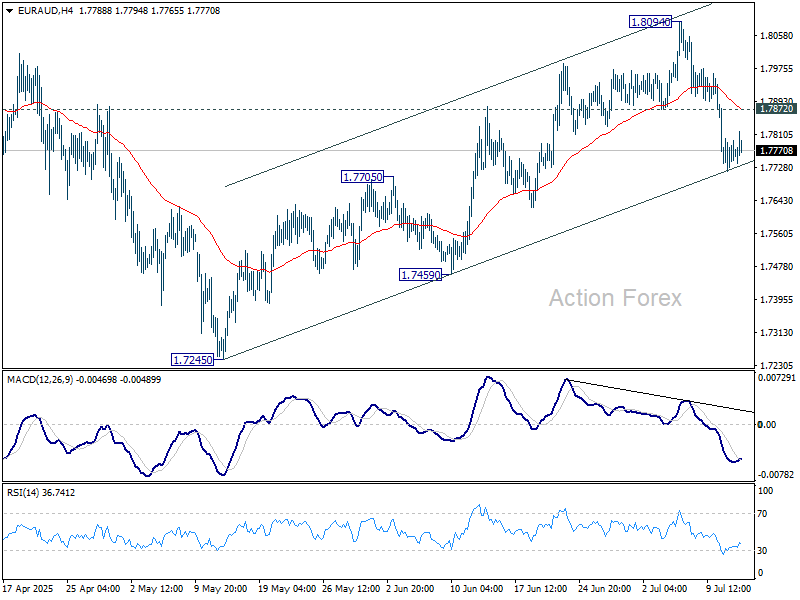
In the bigger picture, price actions from 1.8554 medium term are seen as a corrective pattern. While deeper pullback might be seen, downside should be contained by 38.2% retracement of 1.4281 (2022 low) to 1.8554 at 1.6922 to bring rebound. Up trend from 1.4281 is expected to resume at a later stage.
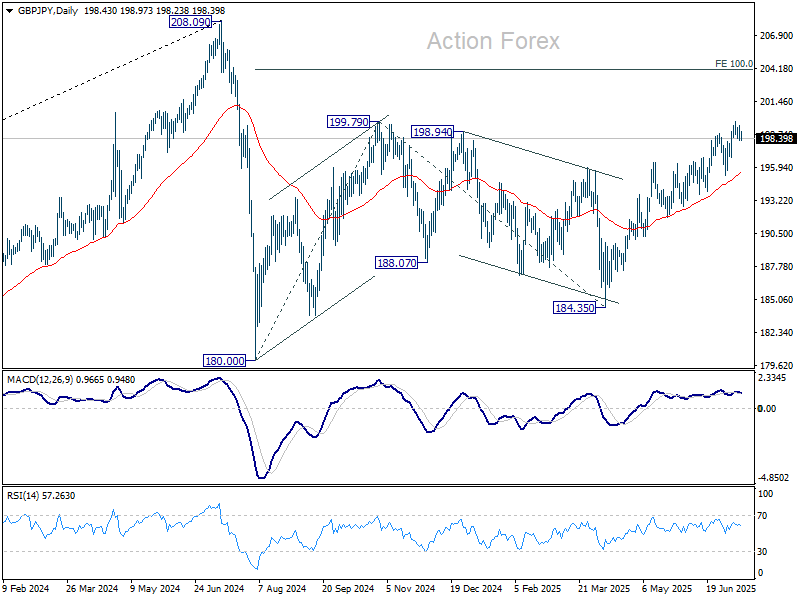
GBP/JPY Daily Outlook
Daily Pivots: (S1) 198.28; (P) 198.86; (R1) 199.48; More...
GBP/JPY is staying in consolidations below 199.80 and intraday bias remains neutral for the moment. While deeper retreat cannot be ruled out, further rise is expected as long as 195.33 support holds. On the upside, break of 199.80 will resume the rally from 184.35 and target 100% projection of 180.00 to 199.79 from 184.35 at 204.14.
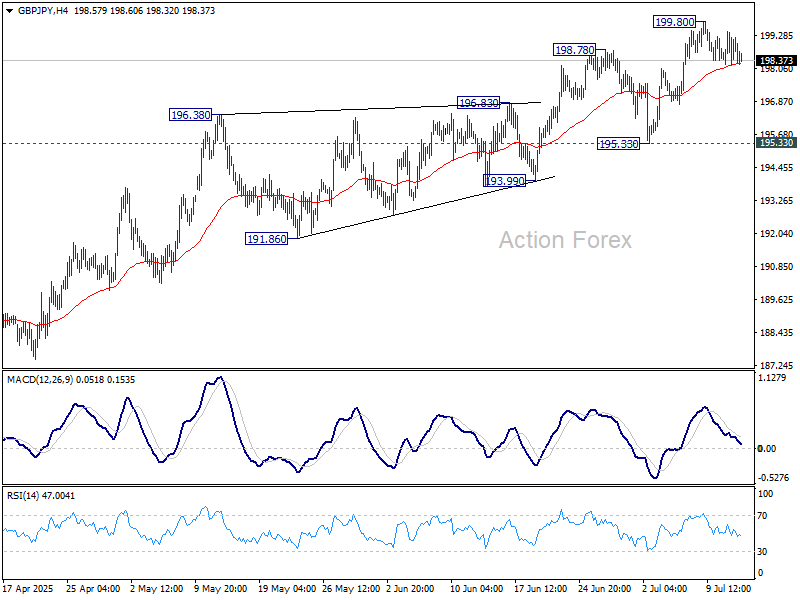
In the bigger picture, price actions from 208.09 (2024 high) are seen as a correction to rally from 123.94 (2020 low). The pattern might still extend with another falling leg. But in that case, strong support should be seen from 38.2% retracement of 123.94 to 208.09 at 175.94 to contain downside. Meanwhile, decisive break of 208.09 will confirm long term up trend resumption.
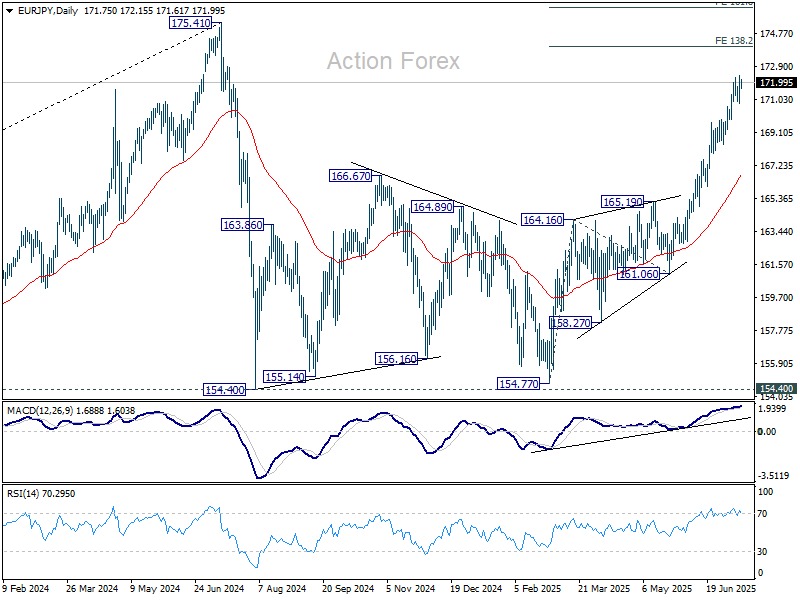
EUR/JPY Daily Outlook
Daily Pivots: (S1) 171.25; (P) 171.84; (R1) 172.87; More...
Intraday bias in EUR/JPY remains on the upside for the moment. Current rally from 154.77 should target 138.2% projection of 154.77 to 164.16 from 161.06 at 174.03. On the downside, below 170.78 support will turn intraday bias neutral and bring consolidations first.
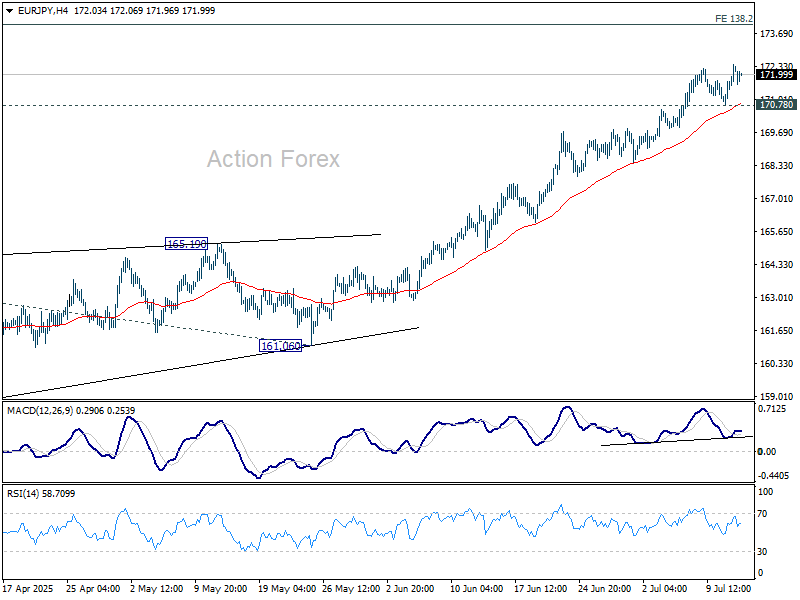
In the bigger picture, price actions from 175.41 (2024 high) are seen as correction to up trend from 114.42 (2020 low). The pattern might still extend with another falling leg. But in that case, strong support should be seen from 38.2% retracement of 114.42 to 175.41 at 152.11 to contain downside. Meanwhile, decisive break of 175.41 will confirm long term up trend resumption.
Euro Steady as EU Holds Fire After Trump’s 30% Tariff Blow
Risk sentiment turned mildly negative in Asia on Monday following US President Donald Trump’s announcement of 30% tariffs on imports from the EU and Mexico, starting August 1. While US futures turned lower, equity markets in Asia were more muted, digesting the move in context of still-holding EU retaliation.
The 30% tariff rate on EU goods was notably harsher than the 20% flagged during Trump’s Liberation Day speech in April. Mexico, by contrast, appears to have secured a better outcome than Canada, reflecting Washington’s preference for selective confrontation. Still, Trump’s broader campaign has swept in dozens of countries with tariff bands ranging from 20% to 50%, highlights a return to maximalist trade pressure.
Market reaction in FX was largely subdued, though defensive positioning was evident. Yen outperformed for now, followed by Dollar and Loonie. At the other end, Kiwi and Aussie weakened the most. Euro edged lower but avoided steeper losses after the EU confirmed it would delay its suspended retaliation. Sterling and Swiss Franc are positioning in the middle.
The EU’s initial response has been measured. European Commission President Ursula von der Leyen confirmed Sunday that retaliatory tariffs on EUR 21B worth of US goods—previously suspended—would remain on hold until early August. She condemned the new US action as disruptive but emphasized the EU’s commitment to diplomacy and proportionate response.
Beyond the US-EU front, the trade shock comes amid parallel developments. Von der Leyen announced a political agreement with Indonesia to move forward on a long-stalled free trade deal, signaling that the EU is actively diversifying trade partnerships. While this helps hedge against US hostility, it’s unlikely to blunt short-term disruption. Unless trade talks regain traction, investors may need to brace for more volatility heading into August’s tariff deadline.
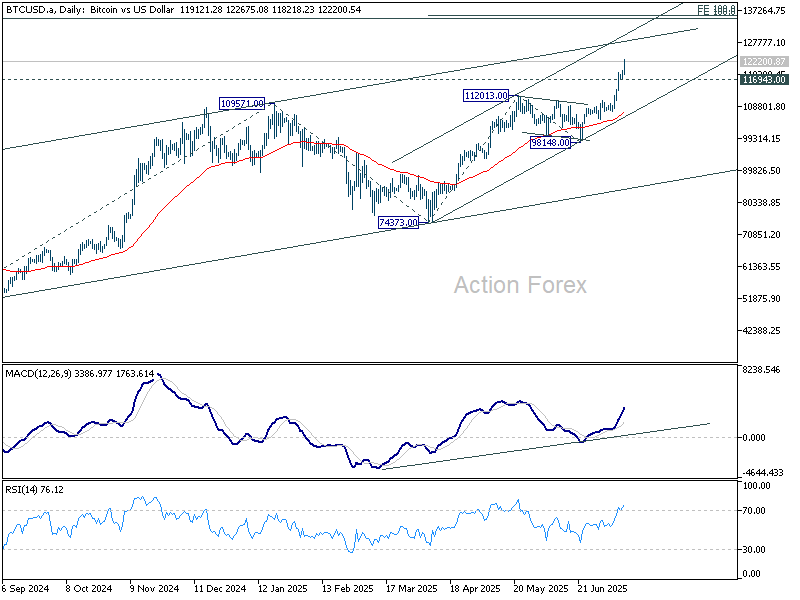
Technically, Bitcoin's record run continues today and surges through 120k mark. Near term outlook will stay bullish as long as 116943 support holds. Next target is double projection level at around 135k, 100% projection of 49008 to 109571 from 74373 at 134946 and 100% projection of 74373 to 112013 from 98148 at 135788. Overbought condition will likely cap Bitcoin's upside there.
In Asia, at the time of writing, Nikkei is flat. Hong Kong HSI is up 0.15%. China Shanghai SSE is up 0.33%. Singapore Strait Times is up 0.36%. Japan 10-year JGB yield is up 0.068 at 1.574.
NZ BNZ services rises to 47.3, but outlook remains grim
New Zealand’s services sector showed mild improvement in June, with BusinessNZ Performance of Services Index rising to 47.3 from May’s 44.1. Despite the gain, the index remains well below its long-run average of 52.9 and firmly in contraction territory. Subcomponents showed modest upticks—new orders rose from 43.4 to 48.8, employment edged up from 47.1 to 47.4, and activity/sales climbed to 44.5. Inventories just breached the 50-mark at 50.6.
Still, the broader backdrop remains discouraging. 66.2% of surveyed businesses offered negative comments, citing subdued consumer confidence, elevated living costs, and policy-related uncertainty. Public sector retrenchment, inflation, and rising interest rates continue to bite, while seasonal factors like winter and lower tourist activity weigh on demand. BNZ’s Doug Steel summed it up bluntly: “The timeline for New Zealand’s long-awaited economic recovery just keeps getting pushed further and further out.”
China’s exports growth accelerates to 5.8% yoy in June on tariff truce window
China’s exports rose 5.8% yoy in June, beating expectations of 5.0% yoy and marking a pickup from May’s 4.8% yoy. The improvement comes as exporters moved quickly to take advantage of the 90-day tariff truce with the US, front-loading shipments ahead of anticipated disruptions.
The stronger-than-expected performance helped lift China’s trade surplus to USD 114.8B, slightly above consensus and up from USD 103.2B in May.
Imports rose 1.1% yoy, the first positive reading of the year and a tentative sign of stabilization in domestic demand.
Inflation pulse returns as central banks confront tariff fog
This week brings a renewed test for global central banks as June inflation data from the US, UK, Canada, and Japan takes the spotlight.
After months of progress on disinflation, markets are now asking whether the soft patch has run its course. In the US, headline and core CPI are both expected to tick higher—a shift that could signal the low point in inflation may already be behind us.
Fed, already cautious about premature easing, will be particularly sensitive to any inflation reacceleration. With another round of tariffs set to begin in August, policymakers have little room for missteps. A hotter CPI reading, coupled with incoming PPI and retail sales, could keep the Fed sidelined through summer, especially as recent commentary has leaned toward patience over preemption.
In Canada, after a blowout jobs report, Markets now expect BoC to skip a cut again this month. Unless inflation falls meaningfully below expectations, policymakers may extend the pause into fall. However, with trade risks on the rise, the BoC is unlikely to rule out further cuts altogether.
The UK faces a different dilemma: inflation remains too high, but the economy is weakening. BoE is widely expected to cut rates in August following soft GDP figures. This week’s CPI report is unlikely to derail that plan, but the pace of future cuts could hinge on whether inflation starts to retreat materially. UK labor market data, especially wage growth and unemployment, will also play a key role in shaping expectations.
Japan’s inflation data is unlikely to shake BoJ from its holding stance. Policymakers are much more concerned about the external environment, including the impact of trade frictions on demand and financial flows. Even in the event of a CPI surprise to the upside, BoJ is likely to hold rates steady for the remainder of 2025.
China’s Q2 GDP and trade data, along with Germany’s ZEW sentiment index, round out a week heavy on macro signals.
Here are some highlights for the week:
- Monday: New Zealand BNZ services; Japan machines orders, tertiary industry index; China trade balance; Swiss PPI; Canada wholesale sales.
- Tuesday: Australia Westpac consumer sentiment; China GDP, industrial production, retail sales, fixed asset investment; Germany ZEW economic sentiment; Canada CPI, manufacturing sales; US CPI, Empire State menutacturing.
- Wednesday: UK CPI; Eurozone trade balance; Canada housing starts; US PPI, industrial production, Fed's Beige Book.
- Thursday: Japan trade balance; Australia employment, NAB quarterly business confidence; Swiss trade balance; UK employment; Eurozone CPI final; US jobless claims, retail sales, Philly Fed survey, import prices, business inventories, NAHB housing index.
- Friday: Japan CPI; GErmany PPI; US housing starts and building permits, U of Michigan consumer sentiment and inflation expectations.
EUR/JPY Daily Outlook
Daily Pivots: (S1) 171.25; (P) 171.84; (R1) 172.87; More...
Intraday bias in EUR/JPY remains on the upside for the moment. Current rally from 154.77 should target 138.2% projection of 154.77 to 164.16 from 161.06 at 174.03. On the downside, below 170.78 support will turn intraday bias neutral and bring consolidations first.
In the bigger picture, price actions from 175.41 (2024 high) are seen as correction to up trend from 114.42 (2020 low). The pattern might still extend with another falling leg. But in that case, strong support should be seen from 38.2% retracement of 114.42 to 175.41 at 152.11 to contain downside. Meanwhile, decisive break of 175.41 will confirm long term up trend resumption.
China’s exports growth accelerates to 5.8% yoy in June on tariff truce window
China’s exports rose 5.8% yoy in June, beating expectations of 5.0% yoy and marking a pickup from May’s 4.8% yoy. The improvement comes as exporters moved quickly to take advantage of the 90-day tariff truce with the US, front-loading shipments ahead of anticipated disruptions.
The stronger-than-expected performance helped lift China’s trade surplus to USD 114.8B, slightly above consensus and up from USD 103.2B in May.
Imports rose 1.1% yoy, the first positive reading of the year and a tentative sign of stabilization in domestic demand.
EUR/USD Begins Downside Correction — Support Levels in Focus
Key Highlights
- EUR/USD started a downside correction from the 1.1820 resistance zone.
- There is a declining channel forming with resistance at 1.1700 on the 4-hour chart.
- GBP/USD also corrected gains and traded below the 1.3550 level.
- Gold recovered above the $3,320 level and tested the $3,365 resistance.
EUR/USD Technical Analysis
The Euro started a downside correction from 1.1820 against the US Dollar. EUR/USD dipped below the 1.1780 and 1.1750 support levels.
Looking at the 4-hour chart, the pair traded below the 38.2% Fib retracement level of the upward move from the 1.1453 swing low to the 1.1829 high. There is also a declining channel forming with resistance at 1.1700.
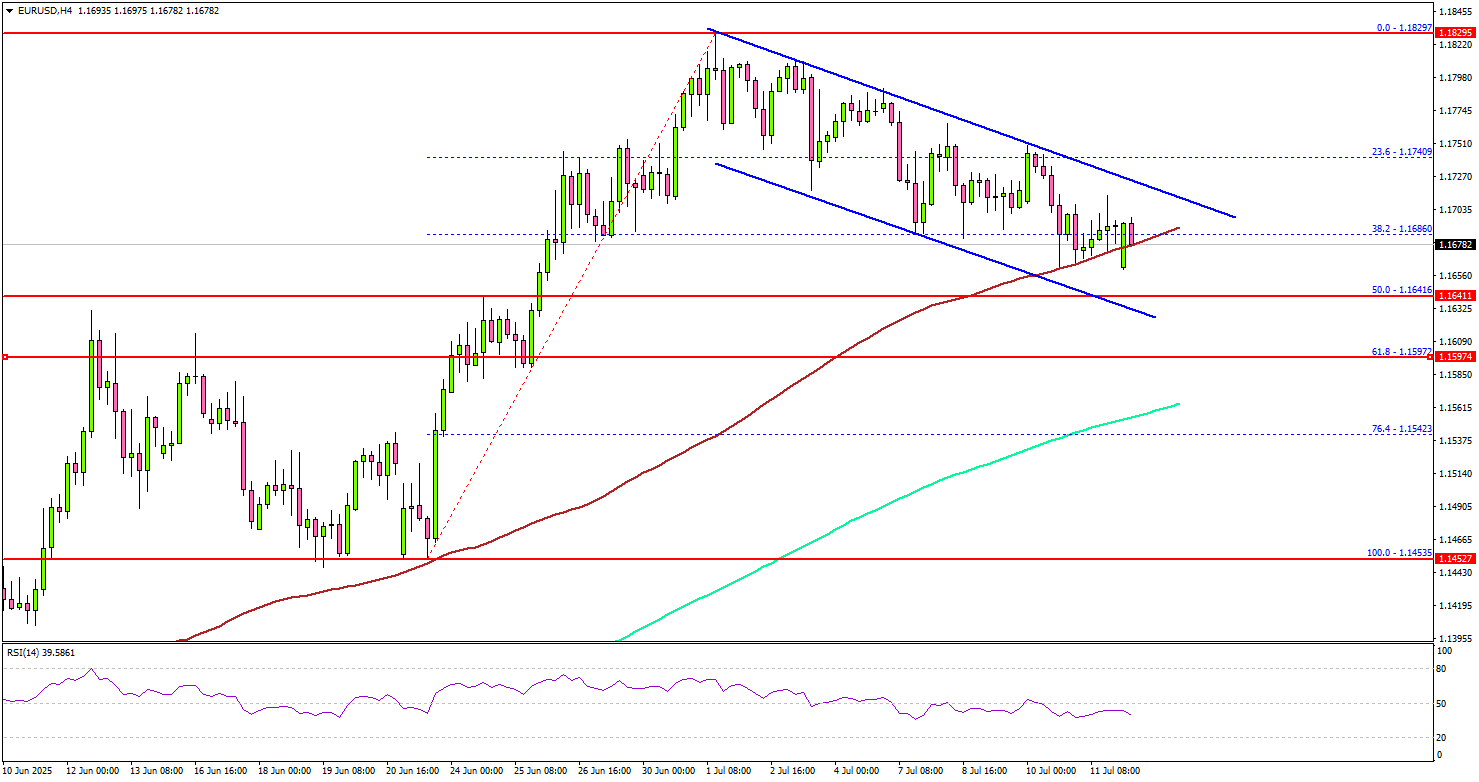
The pair now tests the 100 simple moving average (red, 4-hour) and is well above the 200 simple moving average (green, 4-hour). On the downside, immediate support is near the 1.1640 level. It is close to the 50% Fib retracement level of the upward move from the 1.1453 swing low to the 1.1829 high.
The next key support sits near 1.1600. Any more losses could send the pair toward the 1.1550 support zone. On the upside, the pair could face resistance near the 1.1700 level.
The next key resistance sits near the 1.1740 level. A close above the 1.1740 level could set the pace for another increase. In the stated case, the pair could even clear the 1.1780 resistance. The next major stop for the bulls could be near the 1.1840 resistance.
Looking at GBP/USD, the pair started a short-term downside correction and might decline toward the 1.3400 level.
Upcoming Economic Events:
- ECB's Cipollone speech.
NZ BNZ services rises to 47.3, but outlook remains grim
New Zealand’s services sector showed mild improvement in June, with BusinessNZ Performance of Services Index rising to 47.3 from May’s 44.1. Despite the gain, the index remains well below its long-run average of 52.9 and firmly in contraction territory. Subcomponents showed modest upticks—new orders rose from 43.4 to 48.8, employment edged up from 47.1 to 47.4, and activity/sales climbed to 44.5. Inventories just breached the 50-mark at 50.6.
Still, the broader backdrop remains discouraging. 66.2% of surveyed businesses offered negative comments, citing subdued consumer confidence, elevated living costs, and policy-related uncertainty. Public sector retrenchment, inflation, and rising interest rates continue to bite, while seasonal factors like winter and lower tourist activity weigh on demand. BNZ’s Doug Steel summed it up bluntly: “The timeline for New Zealand’s long-awaited economic recovery just keeps getting pushed further and further out.”

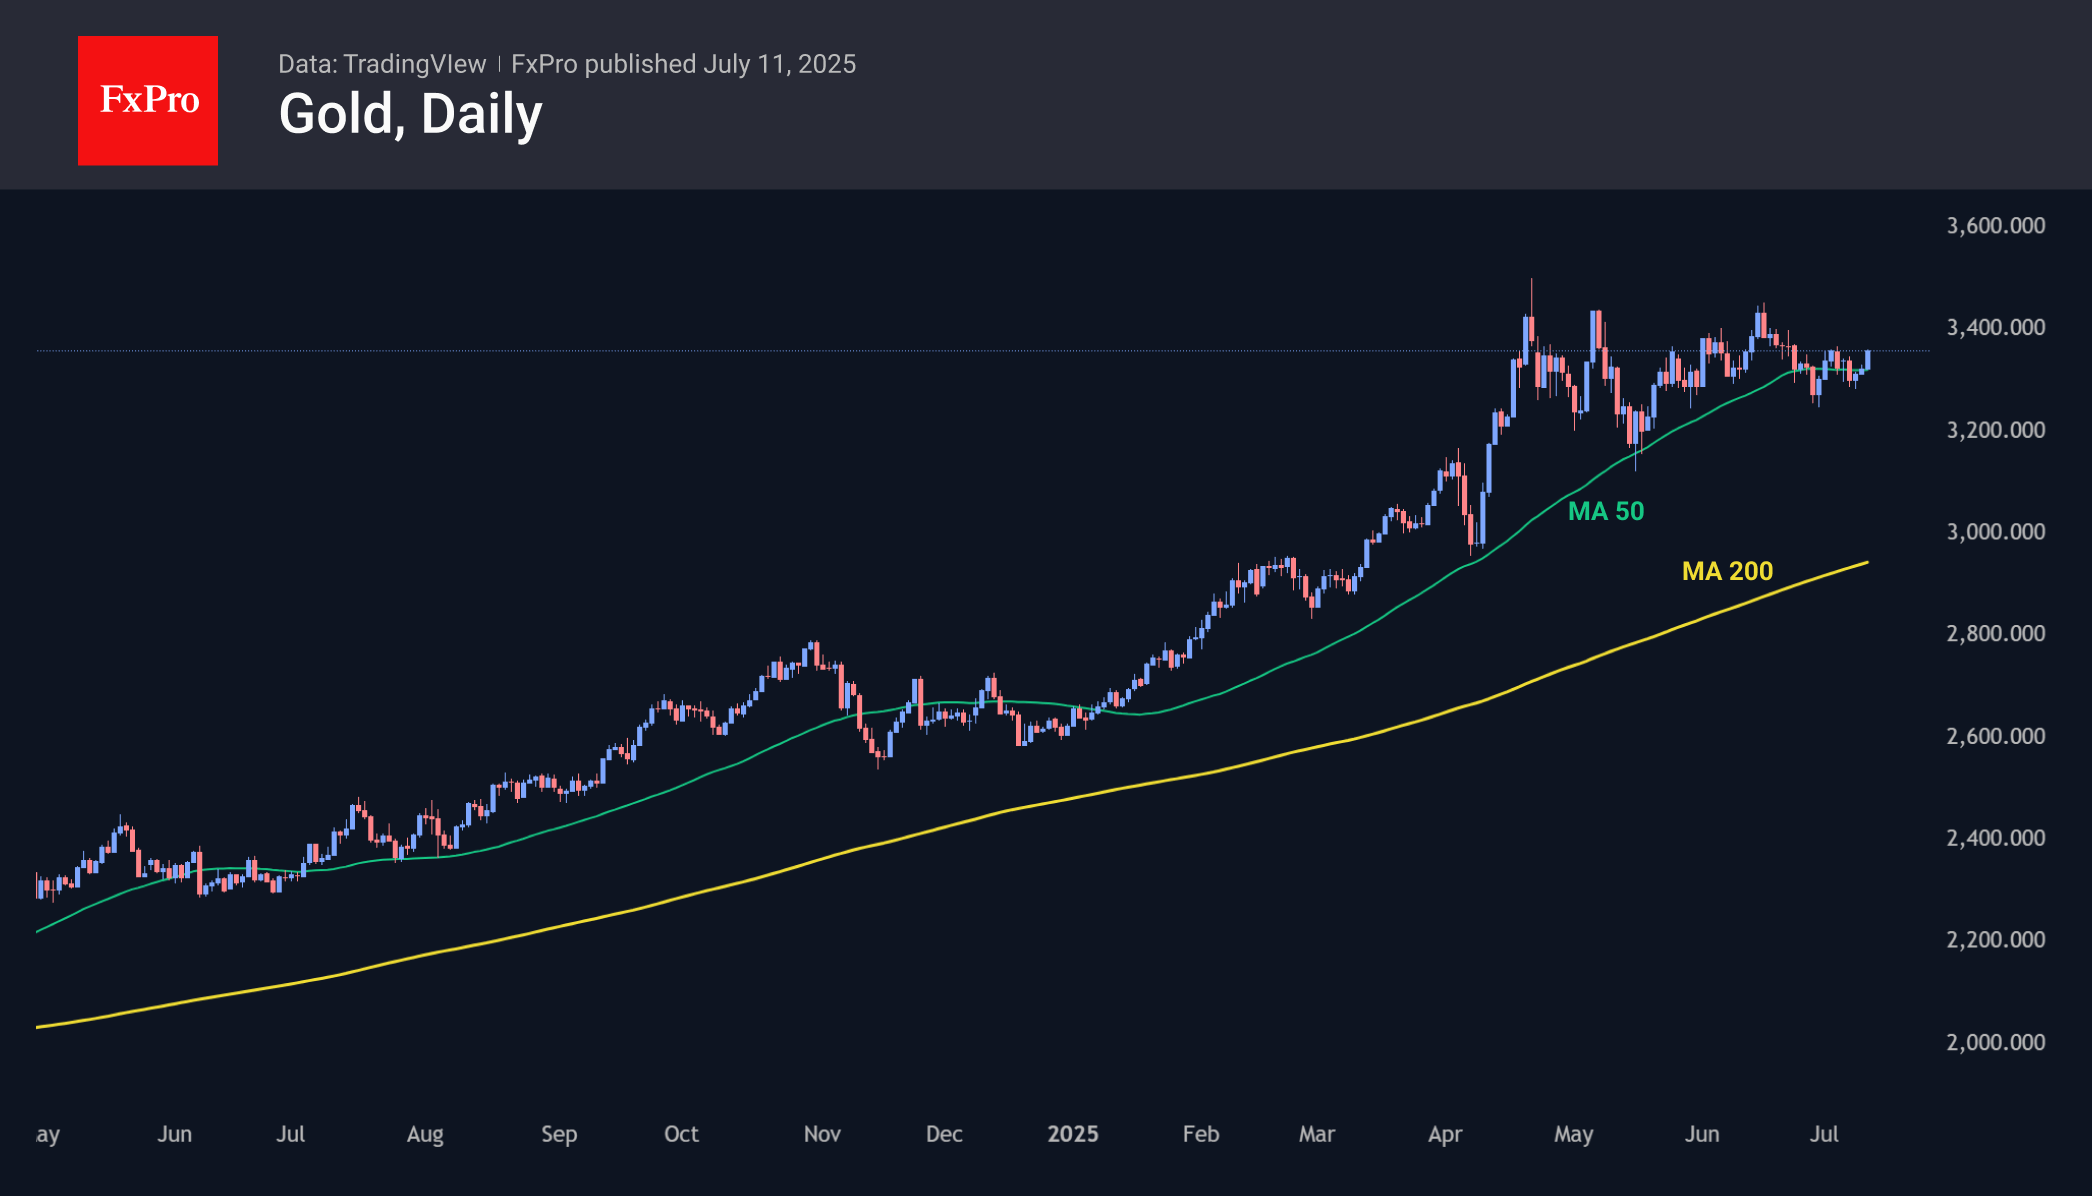
Gold in a Range, But Testing Its Upper Bound
Over the past 12 weeks, gold has been trading within a narrow range, the boundaries of which are gradually narrowing. The 50-day moving average has once again provided support. At the same time, the main driver of growth has been a resurgence in risk appetite, which has supported a decline in yields on long-term government bonds, gold’s main competitor.
At the same time, we note with some caution the trend towards a stronger dollar, which is a headwind for precious metal prices.
The minutes of the June FOMC meeting helped the precious metal. Two officials are ready to vote to ease monetary policy as early as July. The doves are focusing on the cooling labour market and the reluctance of inflation to accelerate.
The chances of Gold breaking out of the $3250-3450 trading range are slim. Gold is supported by high appetite from central banks and a high degree of uncertainty. Nevertheless, the rapid rally of the precious metal in 2022-2025 suggests that it is overbought.
A confident move into the $3370-3400 range in the new week will be an important signal of a bullish breakout, capable of quickly pushing prices to new record highs. However, this is not a guaranteed scenario, and remaining in the $3300-3350 range will set the stage for further consolidation and increase the risk of a downward breakout from the range.
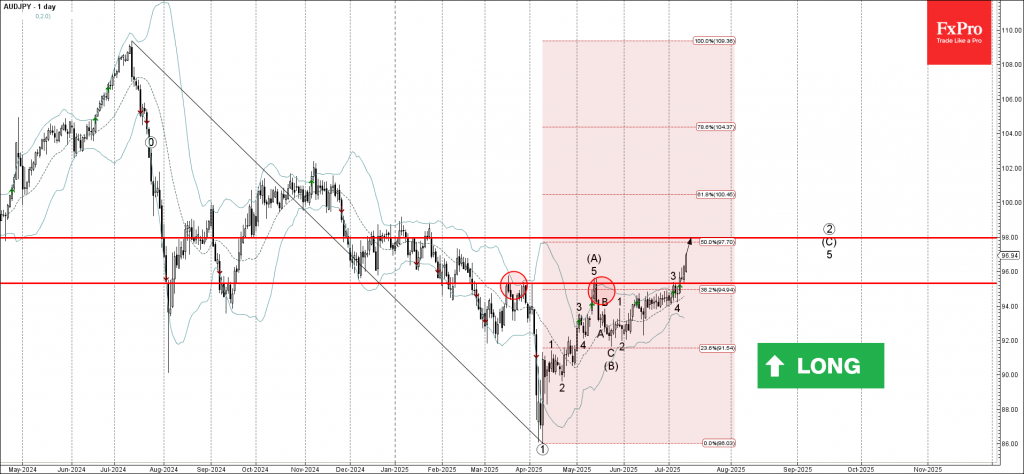
AUDJPY Wave Analysis
AUDJPY: ⬆️ Buy
- AUDJPY broke resistance zone
- Likely to rise to resistance level 98.00
AUDJPY currency pair recently broke the resistance zone between the resistance level 95.30 (which has been reversing the price from March) and the 38.2% Fibonacci correction of the downward impulse from July.
The breakout of this resistance zone continues the active impulse wave 3, which belongs to the intermediate impulse wave (C) from May.
Given the strongly bearish yen sentiment seen across the FX markets today, AUDJPY currency pair can be expected to rise to the next resistance level 98.00 (target price for the completion of wave 5).
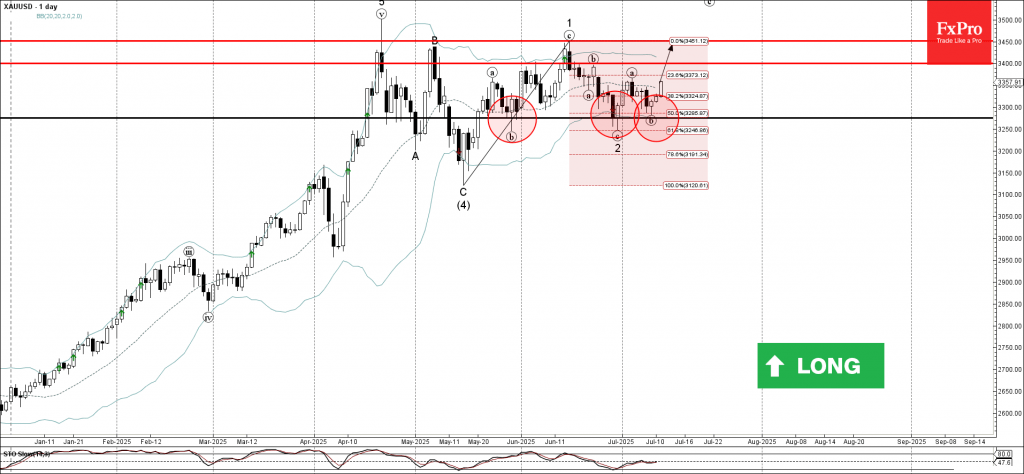
Gold Wave Analysis
Gold: ⬆️ Buy
- Gold reversed from support zone
- Likely to rise to resistance levels 3400.00 and 3450.00
Gold recently reversed up from the support zone between the strong support level 3275.50 (which has been reversing the price from May), lower daily Bollinger Band and the 50% Fibonacci correction of the upward impulse 1 from May.
The upward reversal from this support zone continues the active impulse wave 3 of the intermediate impulse wave (5) from May.
Given the clear daily uptrend, Gold can be expected to rise to the next resistance levels 3400.00 and 3450.00.