Sample Category Title
Investors Brush Off Tariffs, Dollar Rebounds Near Long-Term Channel Support
Global markets brushed aside the latest escalation in the US-led trade war last week, with equities rallying to fresh record highs and risk appetite proving remarkably resilient. Overall, the muted investor response suggested markets were pricing in the tariff headlines as more bark than bite, at least for now.
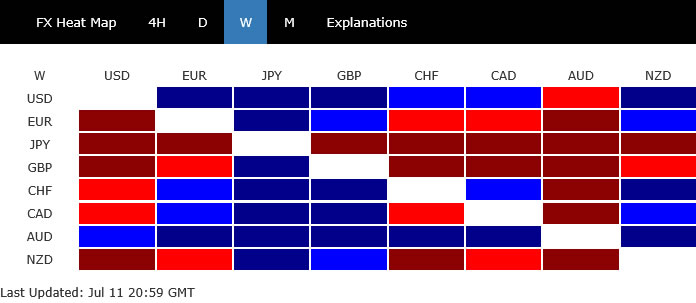
Aussie led pack, benefiting from a perfect storm of positive drivers: firm risk sentiment, surging copper prices, and a surprise decision by the RBA to hold rates steady. Dollar followed closely as traders adjusted their Fed expectations, while Swiss Franc came in third. At the bottom of the leaderboard, Yen was the week’s worst performer, followed by a battered Pound Sterling and a soft New Zealand Dollar. Euro and Canadian Dollar were middling performers.
Looking ahead, trade developments remain in focus. Over 20 countries have now received individual tariff letters, and the administration has signaled that blanket 15–20% tariffs may apply to remaining partners. Europe remains the big unknown—with the White House expected to send tariff letters to the EU imminently. Any escalation there could test market calm and shake up the late summer outlook.
Global Stocks Shrug Off Trade War Escalation
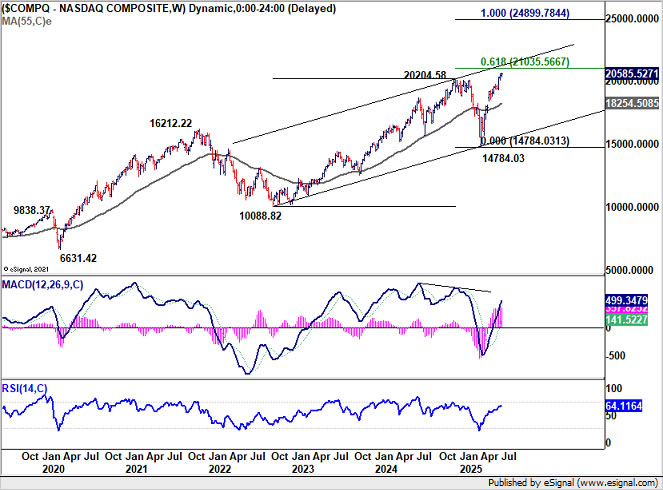
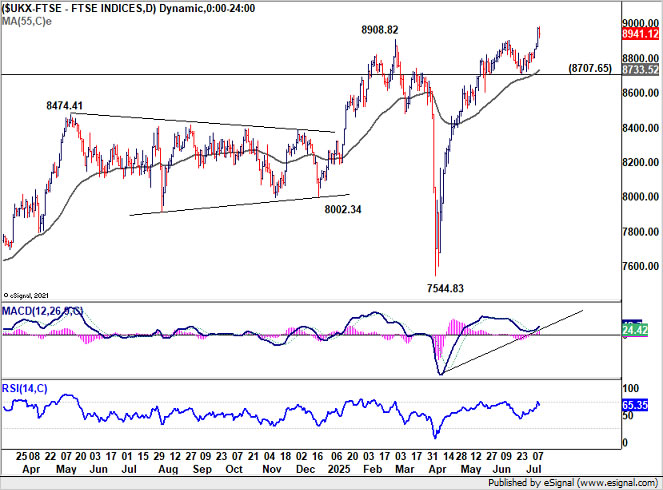
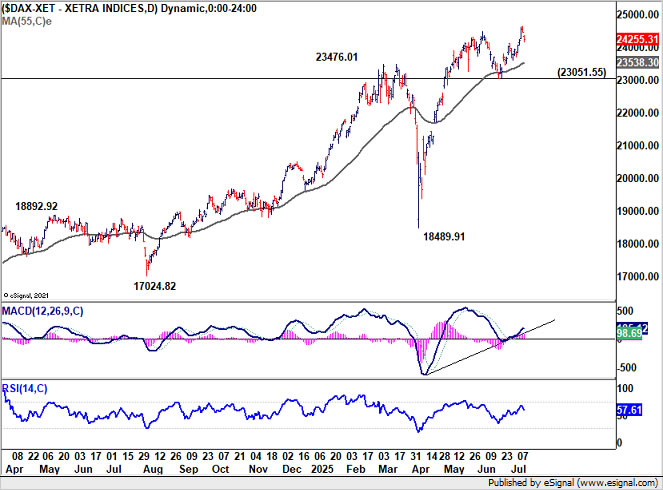
Markets shrugged off a major escalation in the US-led trade war last week, with risk appetite holding firm despite sweeping US tariffs targeting Canada, Brazil, Japan, and more than a dozen other nations. S&P 500 and NASDAQ posted fresh record highs before easing slightly into Friday’s close. In Europe, DAX and FTSE also reached new peaks. Even Japan’s Nikkei remained broadly stable, a surprise given the imposition of 25% US tariffs on Japanese products.
Under the latest round of trade actions, the US slapped a 35% tariff on Canadian imports starting August 1, threatening even higher rates if Canada retaliates. Meanwhile, Brazil was hit with 50% tariffs, making it the most targeted country to date. Other nations that received tariff letters were hit ranging from 20% to 40%. Countries without letters are expected to face blanket tariffs of 15–20%. Additionally, the US announced a 50% tariff on all copper imports, citing national security concerns under a Section 232 investigation.
Despite the surge in trade frictions, markets largely responded with relief. That most of the new tariffs were'nt disastrous—aside from a few headline-grabbing moves—helped keep sentiment afloat. Besides, the new August 1 deadline buys time for diplomacy, and some investors are hopeful partial deals or exemptions can still be secured. However, expectations remain low for a broad multilateral breakthrough.
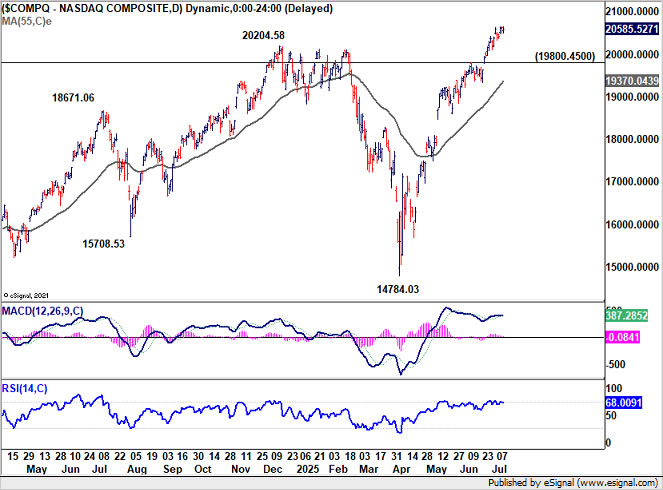
Technically, near term outlook in S&P 500 will stay bullish as long as 19800.45 resistance turned support holds. The real test for the near term is the resistance zone between 61.8% projection of 10088.82 to 20204.58 from 14784.03 at 21035.56 and upper channel resistance (now at around 21250).
Rejection by this resistance zone, followed by break of 19800.45 support, will indicate short term topping, possibly with bearish divergence condition in D MACD. Consolidations should then follow with risk of deeper pullback.
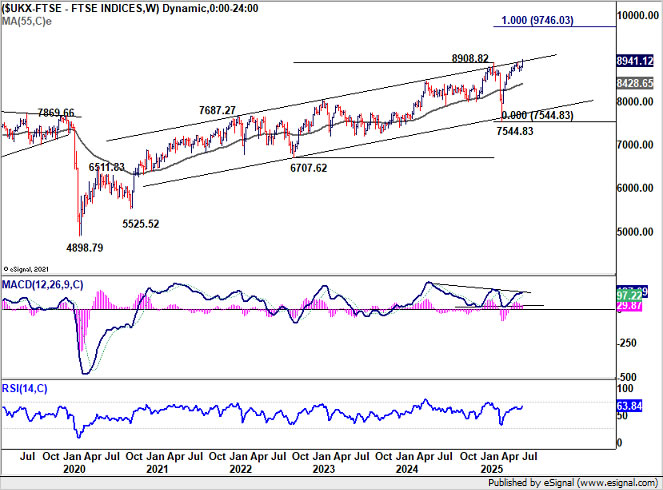
As for FTSE, near term outlook will stay bullish as long as 8707.65 support holds. Sustained break of the long term channel resistance, as seen in the weekly chart, could prompt upside acceleration. Next target is 100% projection of 6707.62 to 8908.82 from 7544.83 at 9746.03.
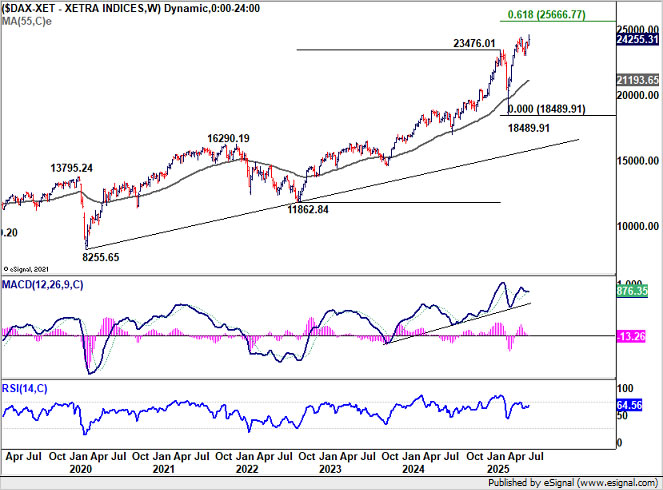
Near term outlook in DAX should stay bullish as long as 23051.55 support holds. Current uptrend is in progress for 61.8% projection of 11862.84 to 23476.01 from 18489.91 at 25666.77.
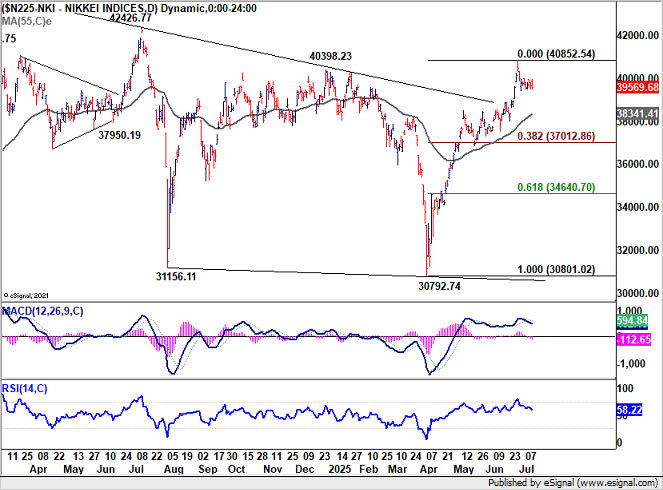
As for Nikkei, the extended consolidations now suggests that 40852.54 is a short term top already. There is risk of deeper pullback but the first line of defense is in 55 D EMA (now at 38341.41). Strong rebound from there will keep the consolidations brief, and rise from 30792.74 should resume to retest 42426.77 high sooner rather than later. Nevertheless, firm break of 55 D EMA will likely bring deeper correction to 38.2% retracement of 30792.74 to 40852.54 at 37012.86, and followed by lengthier consolidations.
Fed Path Becomes Murkier, Dollar at Crossroads Near Decade-Long Support
While market optimism around equities has remained largely intact despite a growing list of US tariffs and rising global trade tensions, expectations for Federal Reserve easing in the second half of the year have quietly shifted. A July rate cut was never seriously priced in, and the odds of a September cut have now slipped from around 70% to closer to 60% as investors reassess the implications of the Trump administration's widening tariff campaign.
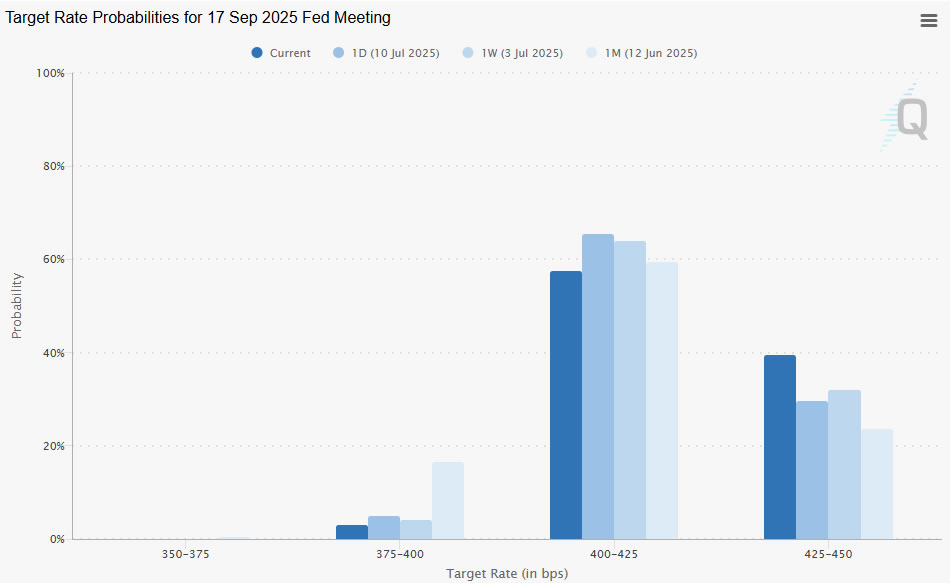
The issue is timing. The next FOMC decision on July 30 will precede the updated August 1 trade truce deadline, meaning the Fed will not have sufficient information to evaluate whether these new tariffs will result in temporary inflation bumps or signal something more sustained. This lack of clarity is a major hurdle for policymakers trying to calibrate their next move.
Meanwhile, minutes from Fed’s June 17–18 meeting reinforce the split between officials. While “most participants” foresee at least one cut this year based on easing inflation pressures and slowing labor demand, “some participants” argued that no cuts are necessary in 2025. Their reasoning: inflation still exceeds target, price expectations remain elevated, and the economy has shown surprising resilience. Moreover, they noted that the current policy rate is not significantly above its neutral level, reducing the urgency for loosening. Only “a couple” of officials said they’d consider a cut in July, and only with confirming data.
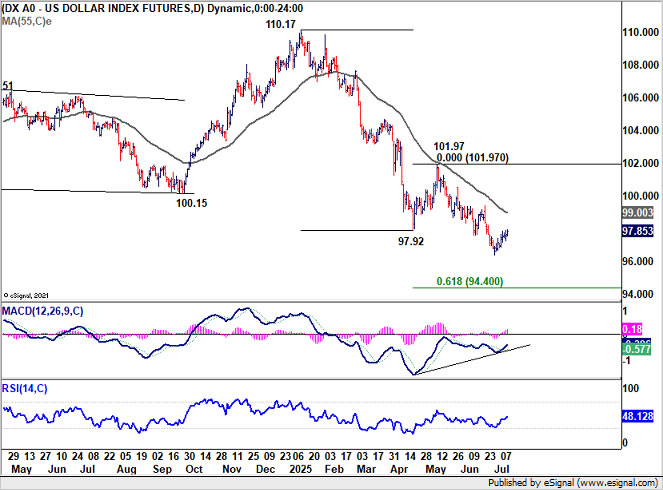
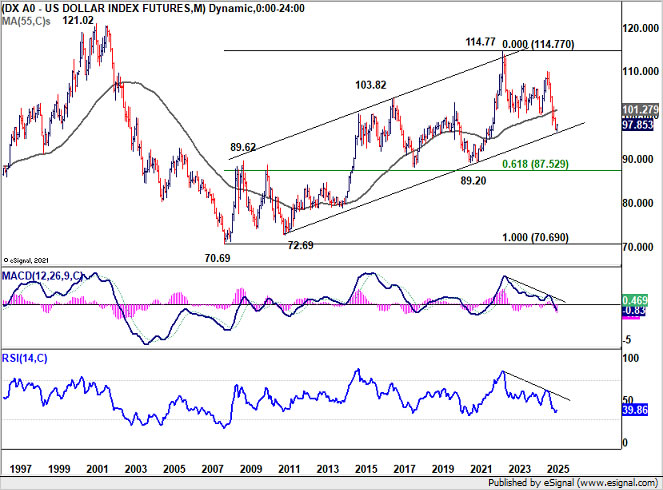
Dollar Index remains bearish for the near term but may be nearing a critical inflection point. Firstly, bullish convergence conditio in D MACD suggests diminishing downside momentum. Secondly, the index is now now reasonably close to decade long channel support (now at around 96). Break of 55 D EMA (now at 99.00) will bring stronger rise back to 55 M EMA (now at 101.27), or even further to 101.97 resistance.
Nevertheless, before that, further decline remains in favor. Decisive break of the above mentioned channel support would argue that whole up trend from 70.67 (2008 low) has completed, and deeper medium term fall would be seen to 61.8% retracement at 87.52, even still as a corrective move.
AUD Surges on Copper Boom and RBA Surprise Hold
Australian Dollar outperformed all peers last week, closing as the strongest currency across majors. Risk-on sentiment in global markets helped fuel the Aussie’s rally, as investors shrugged off trade tensions and rotated into higher-yielding, commodity-linked currencies. Copper prices surged following Trump’s surprise announcement of a 50% tariff on copper imports, providing an additional tailwind.
Central bank policy added further momentum. RBA surprised markets by holding its cash rate steady at 3.85%, despite overwhelming expectations for a third rate cut this year. Just before the meeting ago, market pricing implied a 94% chance of a 25bps cut, and minutes from the May meeting had even revealed a discussion of a 50bps move. With inflation data softening and oil prices falling, the dovish consensus appeared firm heading into the July meeting.
But the board was clearly divided. The 6-3 vote to hold confirms that the case for easing remains active, yet the majority opted to wait for the Q2 CPI report before committing to further moves. Governor Michele Bullock emphasized that the issue was one of timing, not direction, suggesting that cuts remain on the table but will be data-driven. But for now, policy stability and commodity strength have kept the Aussie buoyant.
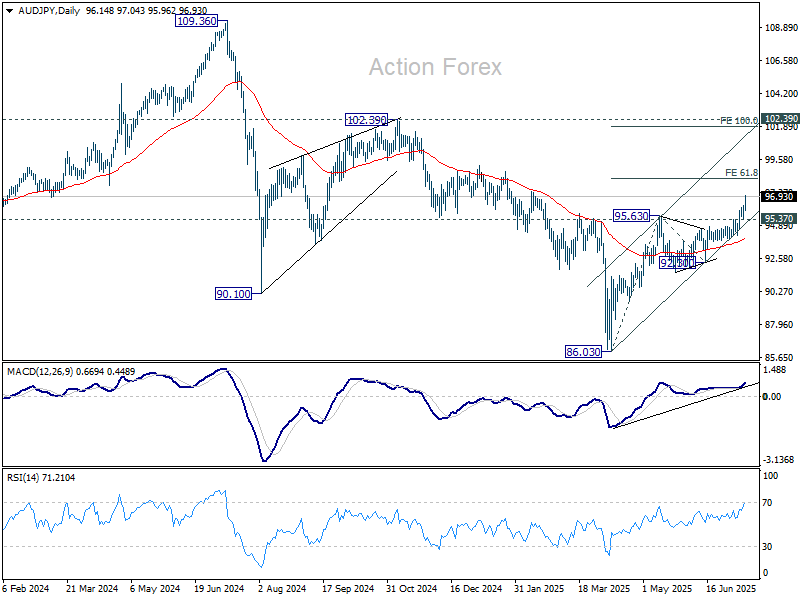
AUD/JPY ended as the top mover last week, gaining 2.40%. Technically, current upside acceleration, as seen in D MACD, solidifies the case that medium term corrective fall from 109.36 (2024 high) has completed with three waves down to 86.03. Further rise is expected as long as 95.37 support holds. Next target is 61.8% projection of 86.03 to 95.63 from 92.30 at 98.23. Firm break there will pave the way to 100% projection at 101.90, or even further to key medium term structural resistance at 102.39.
USD/CAD Weekly Outlook
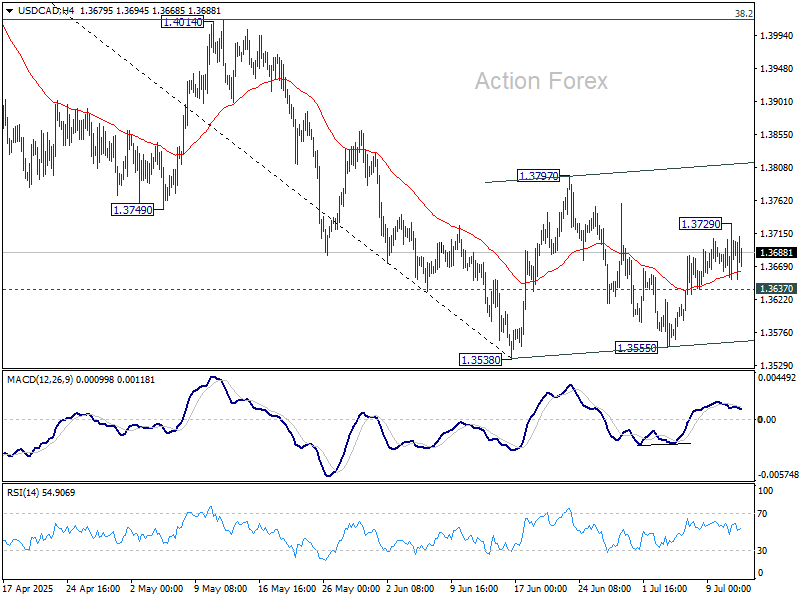
USD/CAD recovered last week but lost momentum quickly. Initial bias stays neutral this week first. Overall, price actions from 1.3538 are seen as a corrective pattern, which is now in its third leg. Stronger rise could be seen and above 1.3728 will target 1.3797 resistance and probably above. On the downside, break of 1.3637 minor support will bring retest of 1.3538/55 support zone.
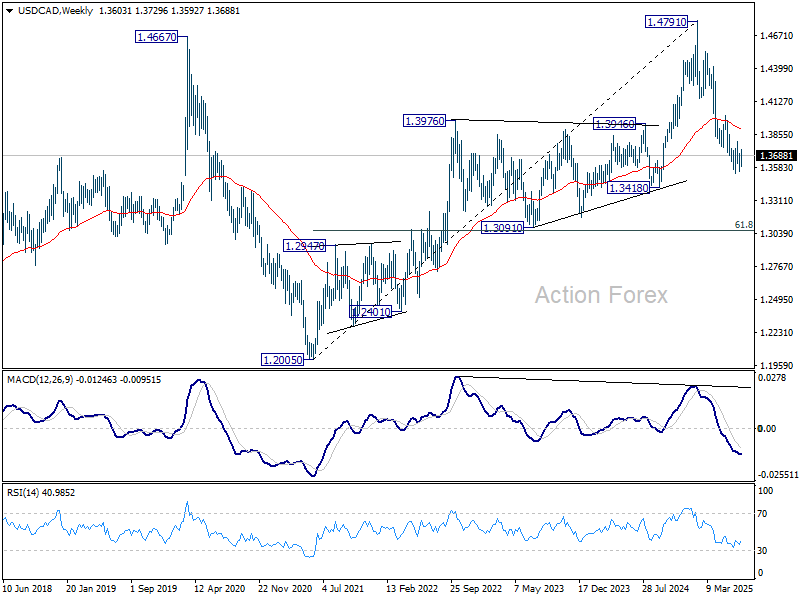
In the bigger picture, price actions from 1.4791 medium term top could either be a correction to rise from 1.2005 (2021 low), or trend reversal. In either case, further decline is expected as long as 1.4014 resistance holds. Next target is 61.8% retracement of 1.2005 (2021 low) to 1.4791 at 1.3069.
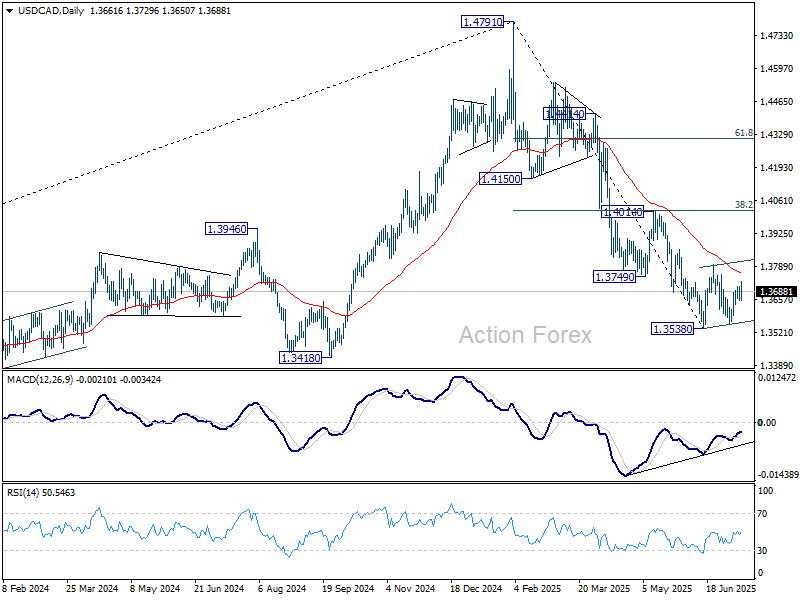
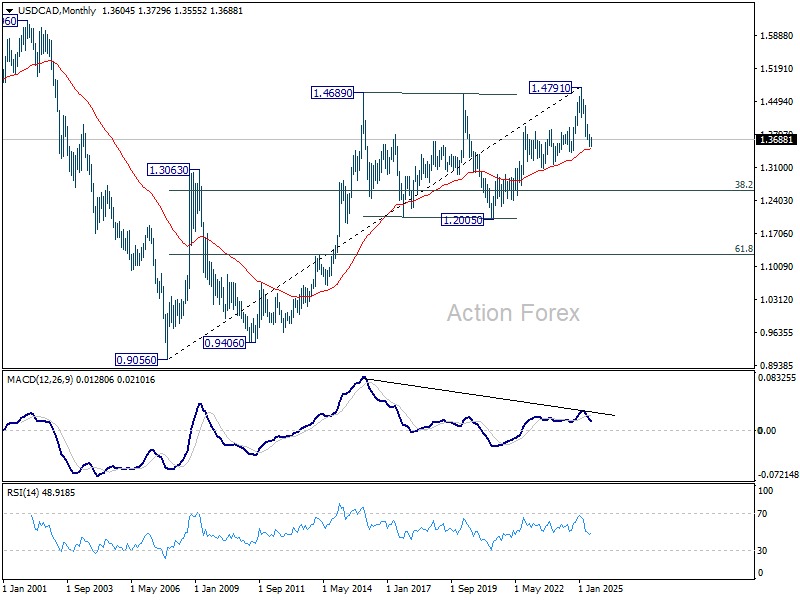
In the long term picture, as long as 55 M EMA (now at 1.3494) holds, up trend from 0.9056 (2007 low) should still resume through 1.4791 at a later stage. However, sustained trading below 55 M EMA will argue that the up trend has already completed, with rise from 1.2005 to 1.4791 as the fifth wave. 1.4791 would then be seen as a long term top and deeper medium term down trend should then follow.
EUR/USD Weekly Outlook
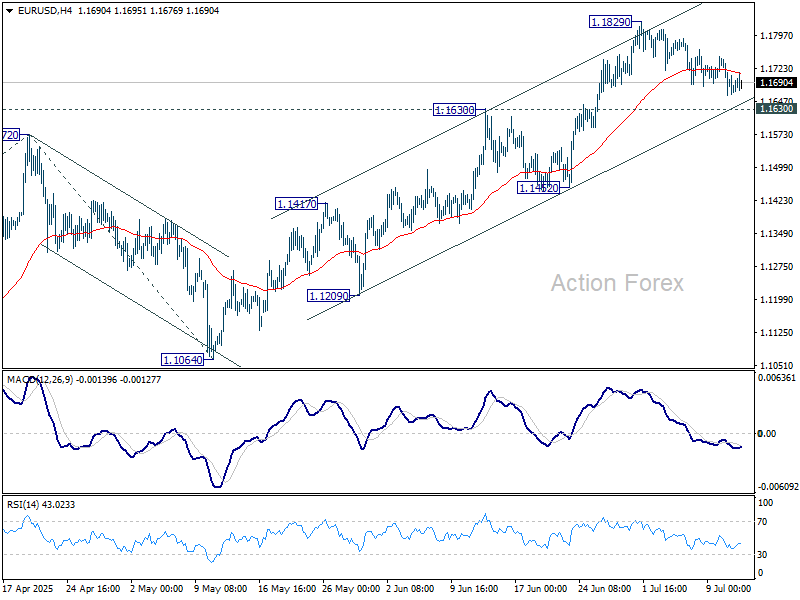
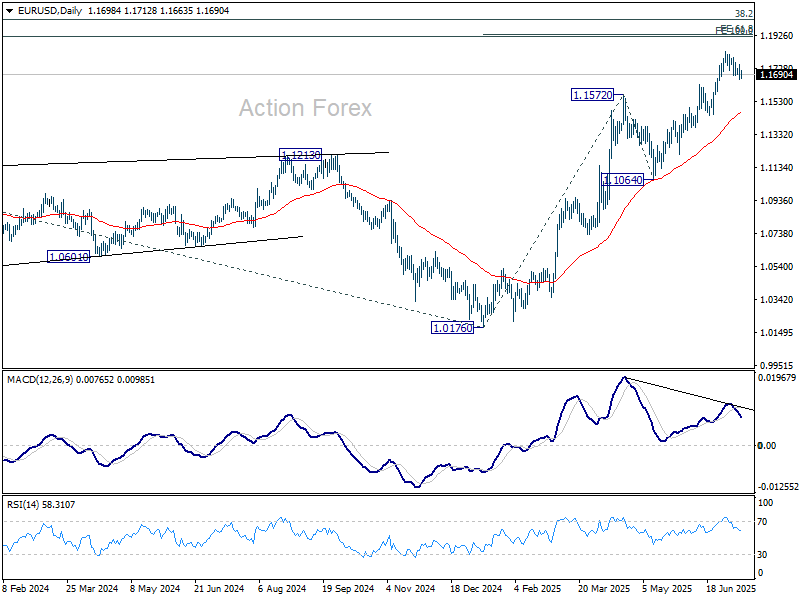
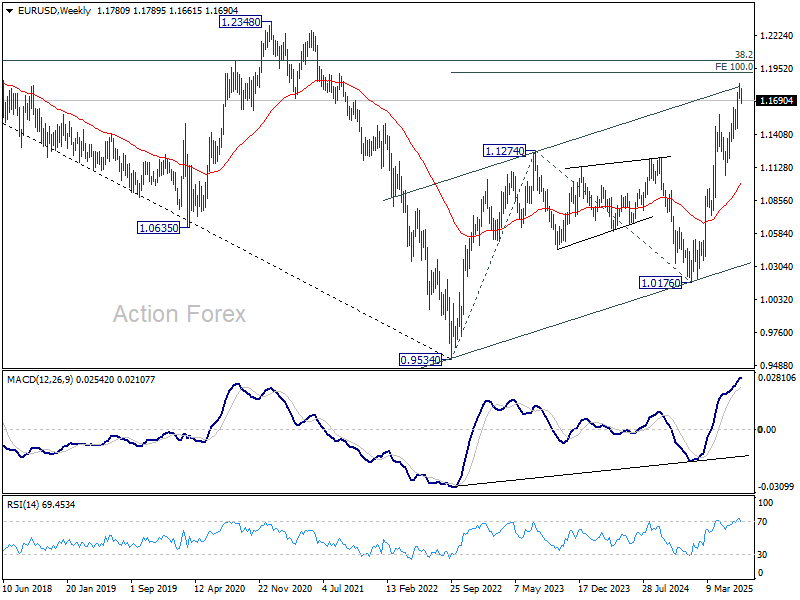
EUR/USD's correction from 1.1829 continued last week and outlook is unchanged. Initial bias remains neutral this week first. Downside of the pullback should be 1.1630 resistance turned support to bring rebound. Firm break of 1.1829 will resume the rise from 1.0176 and target 61.8% projection of 1.0176 to 1.1572 from 1.1064 at 1.1927. However, sustained break of 1.1630 will bring deeper fall to 55 D EMA (now at 1.1467) instead.
In the bigger picture, rise from 0.9534 long term bottom could be correcting the multi-decade downtrend or the start of a long term up trend. In either case, further rise should be seen to 100% projection of 0.9534 to 1.1274 from 1.0176 at 1.1916. This will now remain the favored case as long as 1.1604 support holds.
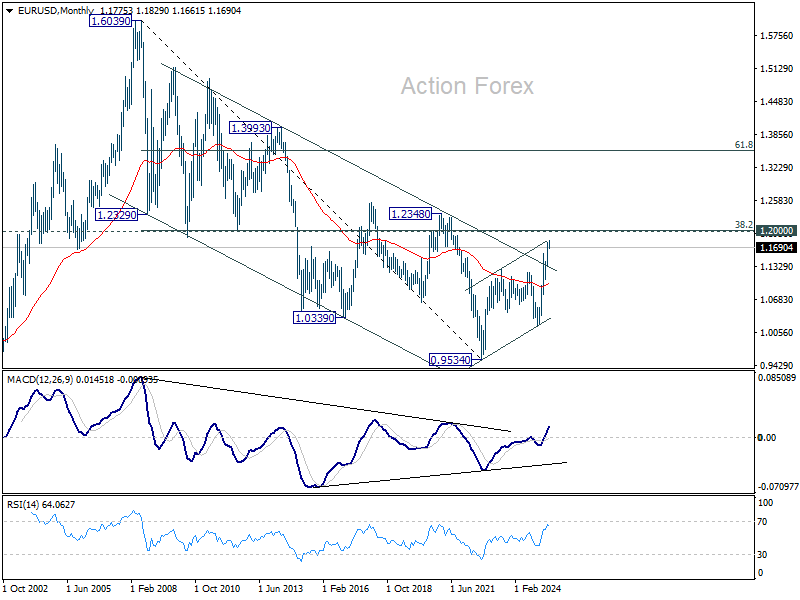
In the long term picture, a long term bottom was in place already at 0.9534, on bullish convergence condition in M MACD. Further rise should be seen to 38.2% retracement of 1.6039 to 0.9534 at 1.2019. Rejection by 1.2019 will keep the price actions from 0.9534 as a corrective pattern. But sustained break of 1.2019 will suggest long term bullish trend reversal, and target 61.8% retracement at 1.3554.
USD/JPY Weekly Outlook
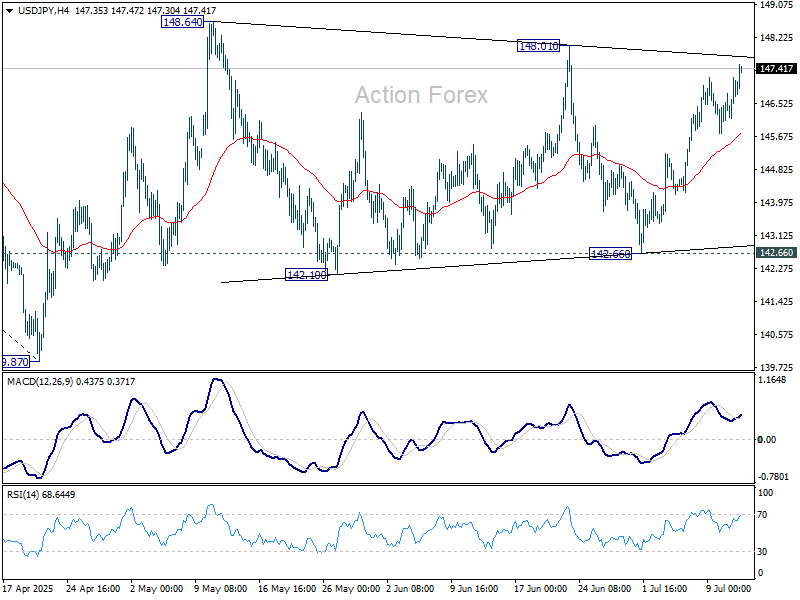
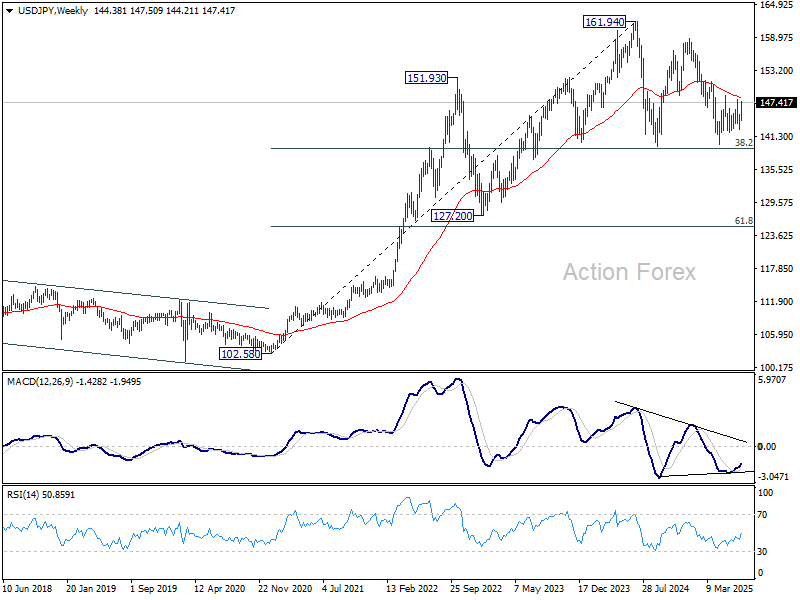
USD/JPY's rebound from 142.66 extended higher last week but upside is still limited below 148.02 resistance. Initial bias remains neutral this week first. Sideway trading from 148.64 could still extend. Nevertheless, firm break of 148.01 will resume the rise from 139.87 to 61.8% retracement of 158.86 to 139.87 at 151.22.
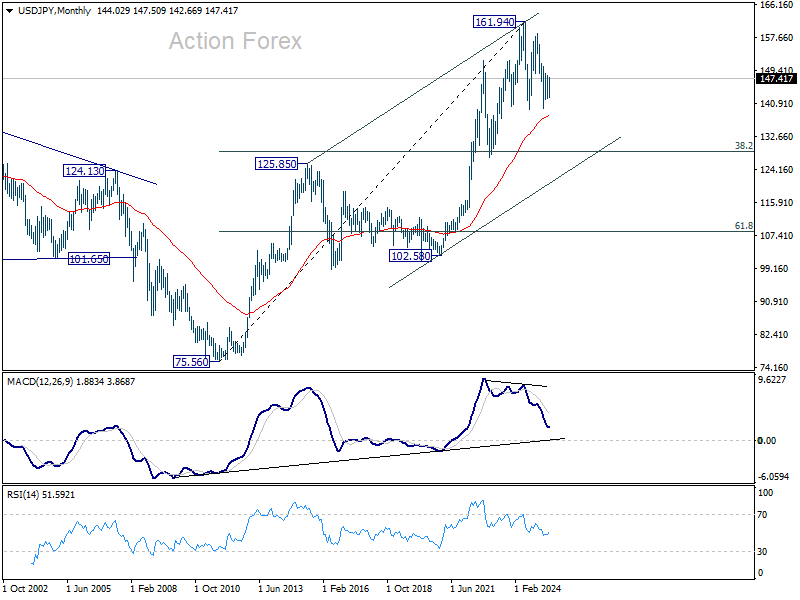
In the bigger picture, price actions from 161.94 (2024 high) are seen as a corrective pattern to rise from 102.58 (2021 low). There is no clear sign that the pattern has completed yet. But still, strong support is expected from 38.2% retracement of 102.58 to 161.94 at 139.26 to bring rebound.
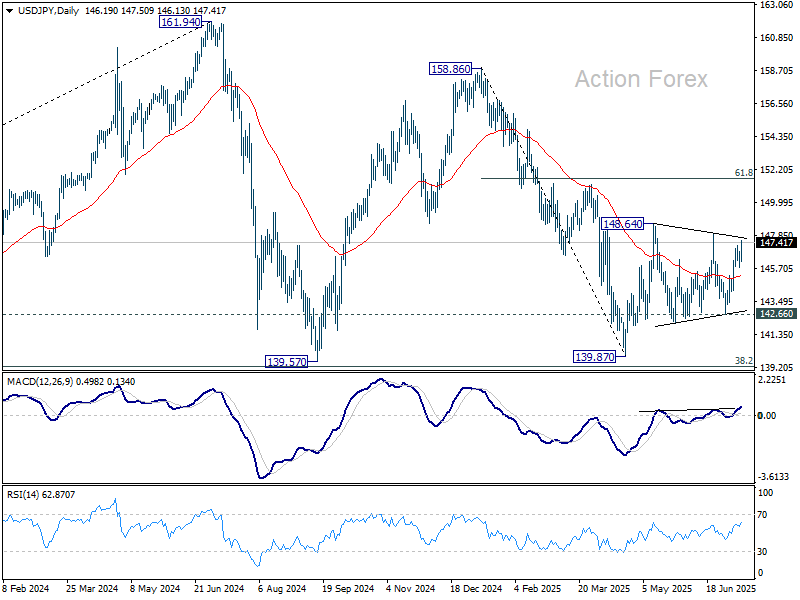
In the long term picture, there is no sign that up trend from 75.56 (2011 low) has completed. But then, firm break of 161.94 is needed to confirm resumption. Otherwise, more medium term range trading could still be seen.
GBP/USD Weekly Outlook
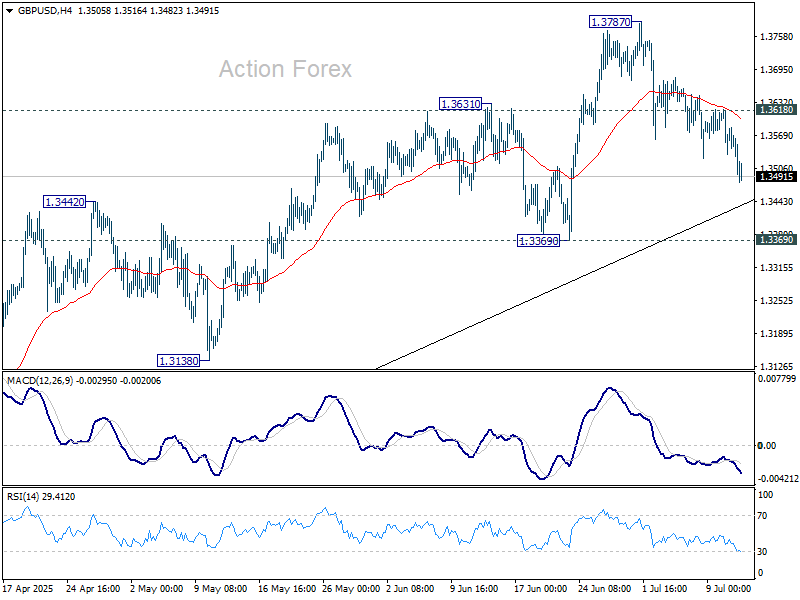
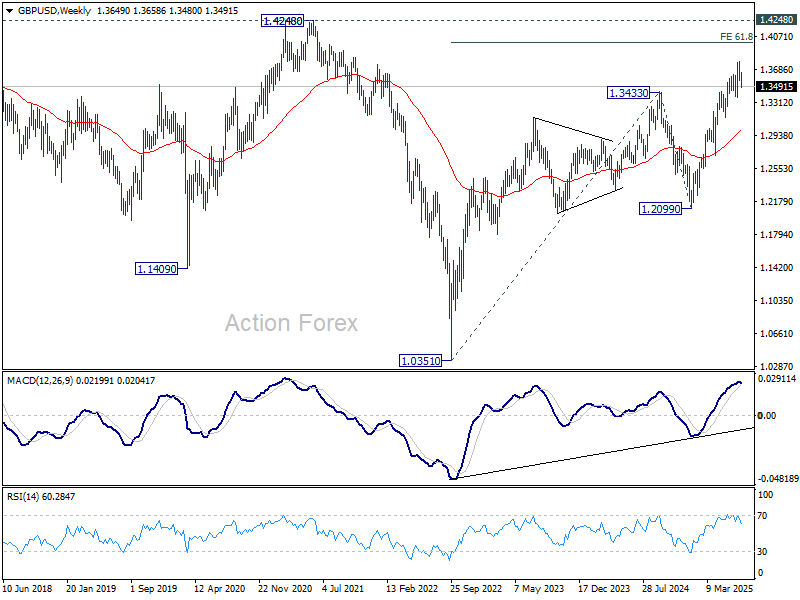
GBP/USD's correction from 1.3787 extended lower last week and deeper fall could be seen. But downside is expected to be contained by 1.3369 support to bring rebound. On the upside, above 1.3680 minor resistance will bring retest of 1.3787. Firm break of 1.3787 will resume larger up trend to 100% projection of 1.2099 to 1.3206 from 1.3138 at 1.3813.
In the bigger picture, up trend from 1.3051 (2022 low) is in progress. Next medium term target is 61.8% projection of 1.0351 to 1.3433 from 1.2099 at 1.4004. Outlook will now stay bullish as long as 55 W EMA (now at 1.2985) holds, even in case of deep pullback.
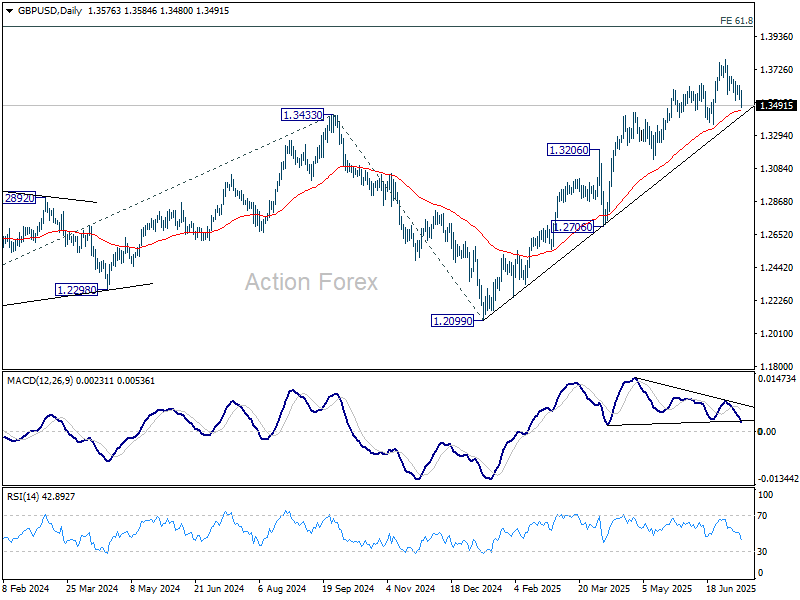
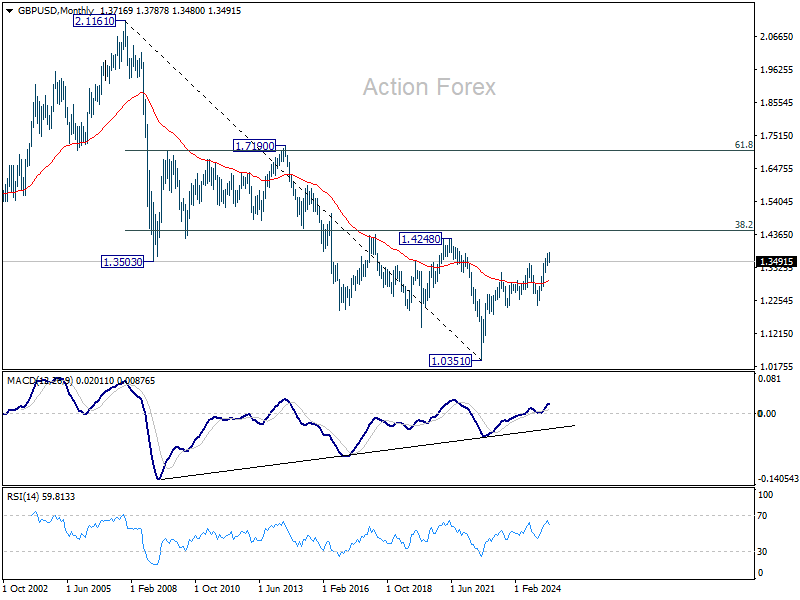
In the long term picture, for now, price actions from 1.0351 (2022 low) are still seen as a corrective pattern to the long term down trend from 2.1161 (2007 high) only. However, firm break of 1.4248 resistance (38.2% retracement of 2.1161 to 1.0351 at 1.4480) will be a strong sign of long term bullish reversal.
USD/CHF Weekly Outlook
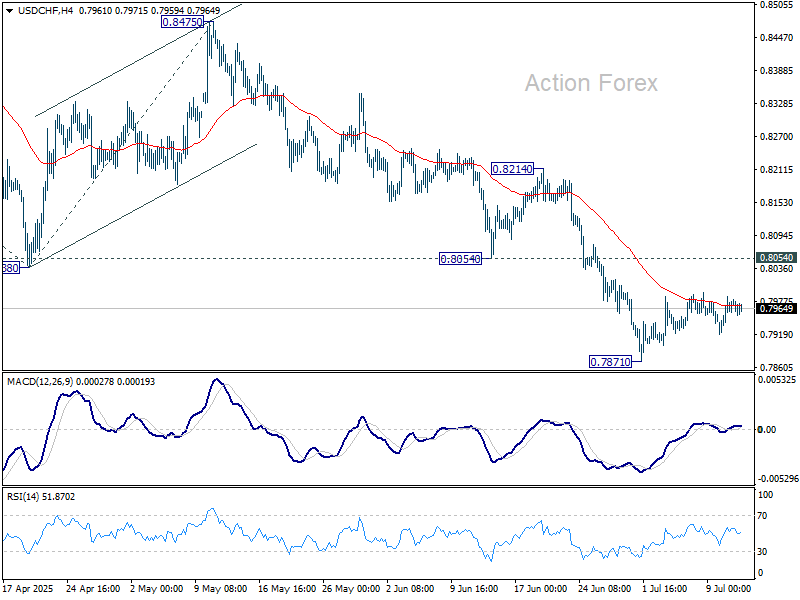
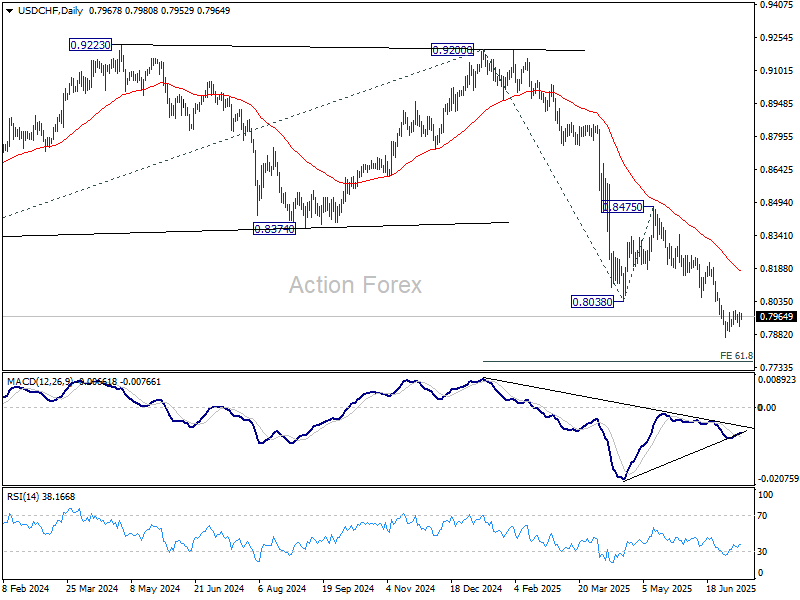
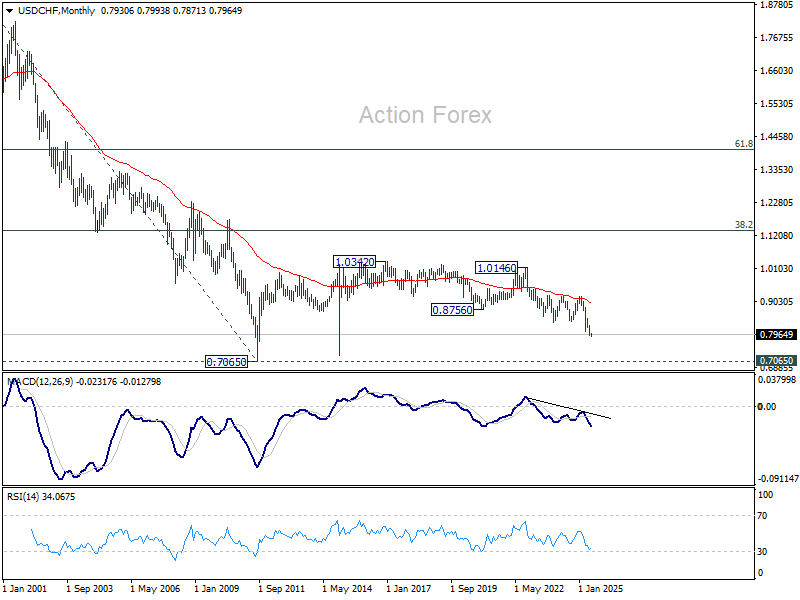
USD/CHF stayed in consolidations above 0.7871 last week and outlook is unchanged. Initial bias remains neutral this week first. Stronger recovery might be seen but upside should be limited by 0.8054 support turned resistance. On the downside, firm break of 0.7871 will extend the larger down trend to 61.8% projection of 0.9200 to 0.8038 from 0.8475 at 0.7757.
In the bigger picture, long term down trend from 1.0342 (2017 high) is still in progress. Next target is 100% projection of 1.0146 (2022 high) to 0.8332 from 0.9200 at 0.7382. In any case, outlook will stay bearish as long as 0.8475 resistance holds.
In the long term picture, price action from 0.7065 (2011 low) are seen as a corrective pattern to the multi-decade down trend from 1.8305 (2000 high). It's uncertain if the fall from 1.0342 is the second leg of the pattern, or resumption of the down trend. But in either case, outlook will stay bearish as long as 0.9200 resistance holds. Retest of 0.7065 should be seen next.

AUD/USD Weekly Report
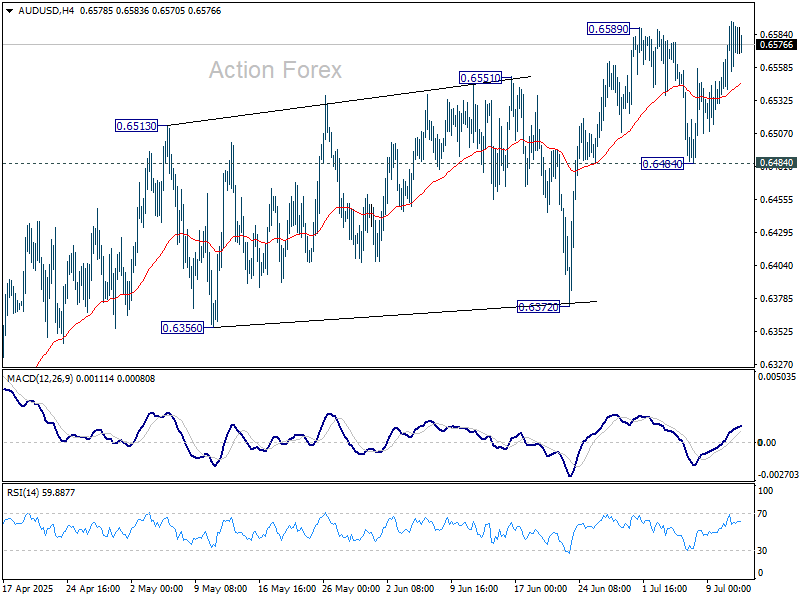
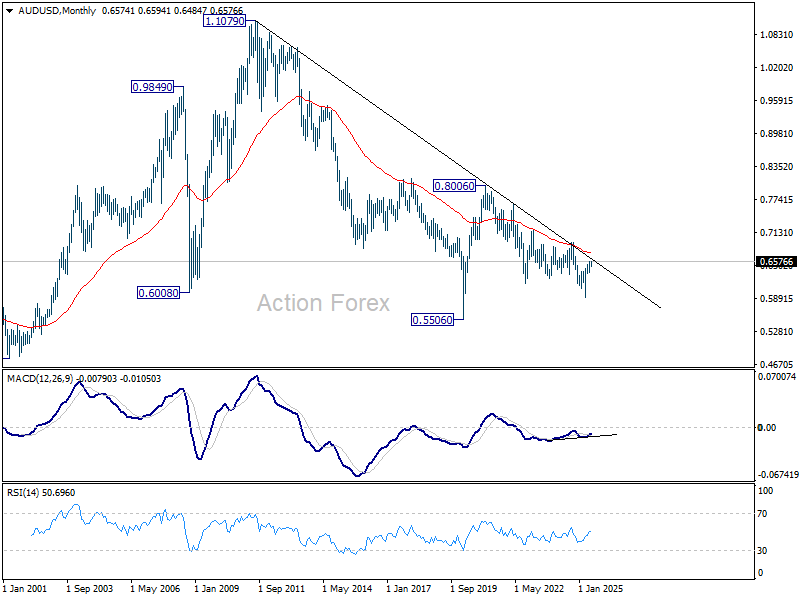
AUD/USD's breach of 0.6589 last week suggests that rise from 0.5913 is resuming. Initial bias stays on the upside this week for 0.6713 fibonacci level. On the downside, however, firm break of 0.6484 support will now indicate short term topping, and turn bias back to the downside for 0.6372 support.
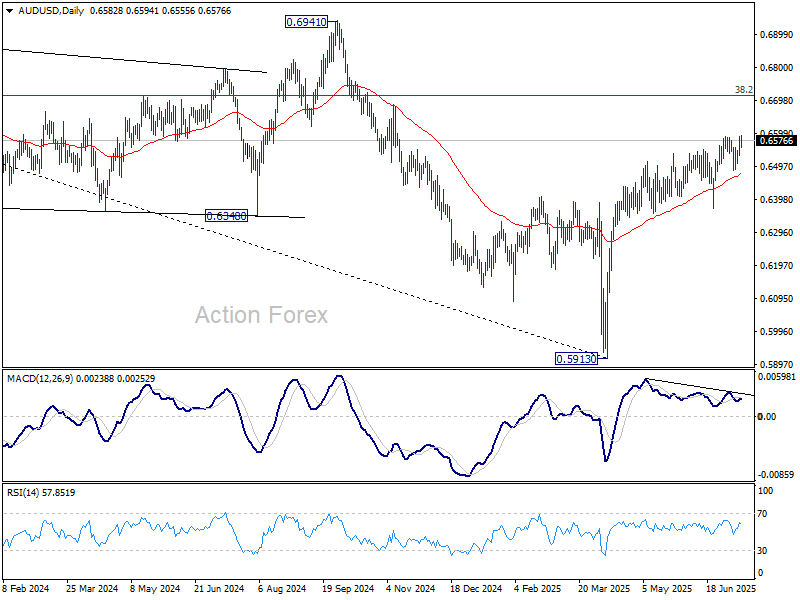
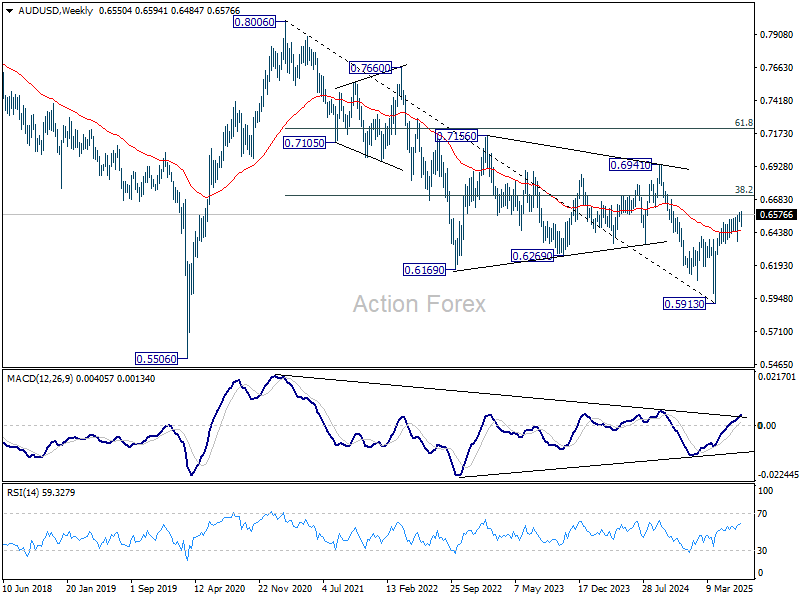
In the bigger picture, there is no clear sign that down trend from 0.8006 (2021 high) has completed. Rebound from 0.5913 is seen as a corrective move. While stronger rally cannot be ruled out, outlook will remain bearish as long as 38.2% retracement of 0.8006 to 0.5913 at 0.6713 holds. Nevertheless, considering bullish convergence condition in W MACD, even in case of another fall through 0.5913, downside should be contained above 0.5506 (2020 low).
In the long term picture, fall from 0.8006 is seen as the second leg of the corrective pattern from 0.5506 long term bottom (2020 low). Hence, in case of deeper decline, strong support should emerge above 0.5506 to contain downside to bring reversal. On the upside, firm break of 0.6941 will argue that the third leg has already started back to 0.8006.
USD/CAD Weekly Outlook
USD/CAD recovered last week but lost momentum quickly. Initial bias stays neutral this week first. Overall, price actions from 1.3538 are seen as a corrective pattern, which is now in its third leg. Stronger rise could be seen and above 1.3728 will target 1.3797 resistance and probably above. On the downside, break of 1.3637 minor support will bring retest of 1.3538/55 support zone.
In the bigger picture, price actions from 1.4791 medium term top could either be a correction to rise from 1.2005 (2021 low), or trend reversal. In either case, further decline is expected as long as 1.4014 resistance holds. Next target is 61.8% retracement of 1.2005 (2021 low) to 1.4791 at 1.3069.
In the long term picture, as long as 55 M EMA (now at 1.3494) holds, up trend from 0.9056 (2007 low) should still resume through 1.4791 at a later stage. However, sustained trading below 55 M EMA will argue that the up trend has already completed, with rise from 1.2005 to 1.4791 as the fifth wave. 1.4791 would then be seen as a long term top and deeper medium term down trend should then follow.
GBP/JPY Weekly Outlook
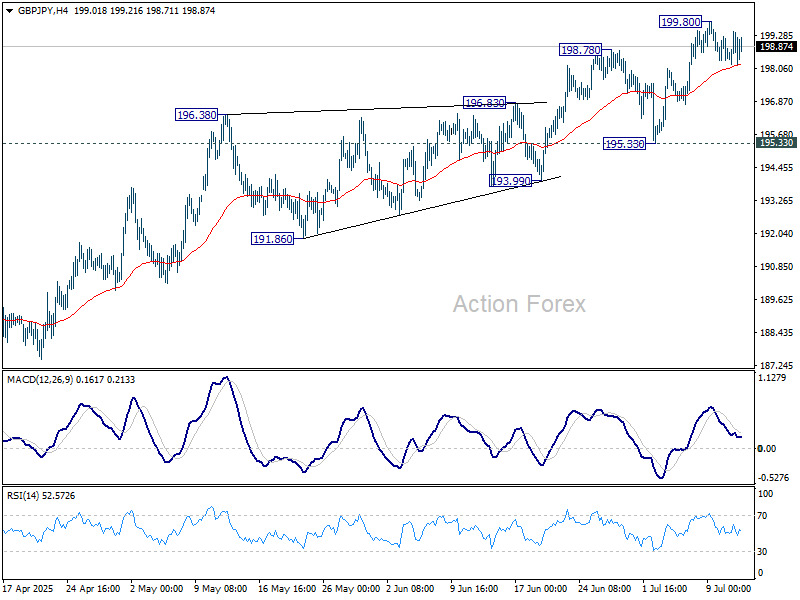
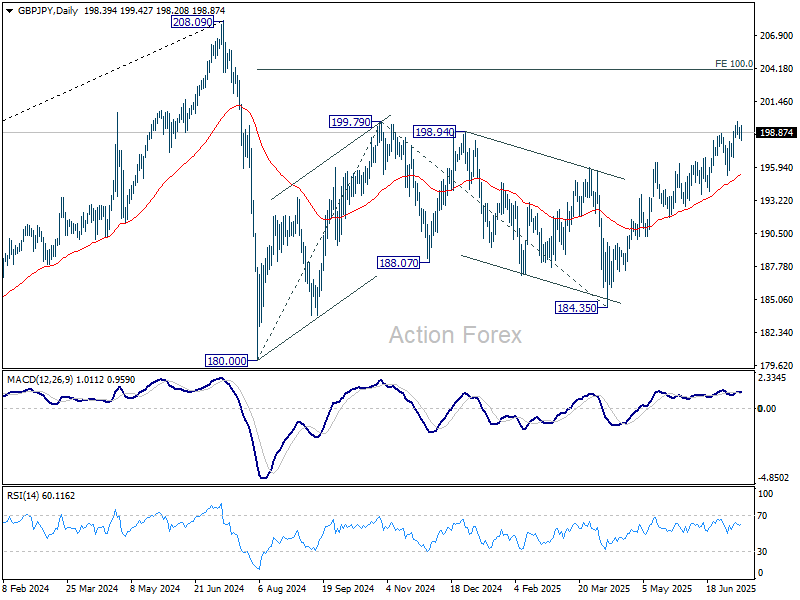
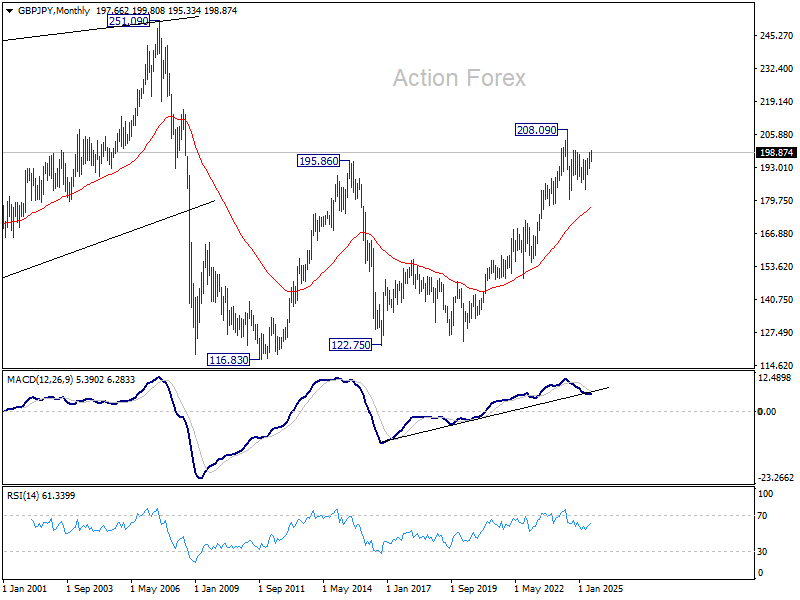
GBP/JPY edged higher to 199.80 last week but turned sideway since then. Initial bias remains neutral this week and more consolidations could be seen. Further rise is expected as long as 195.33 support holds. On the upside, break of 199.80 will resume the rally from 184.35 and target 100% projection of 180.00 to 199.79 from 184.35 at 204.14.
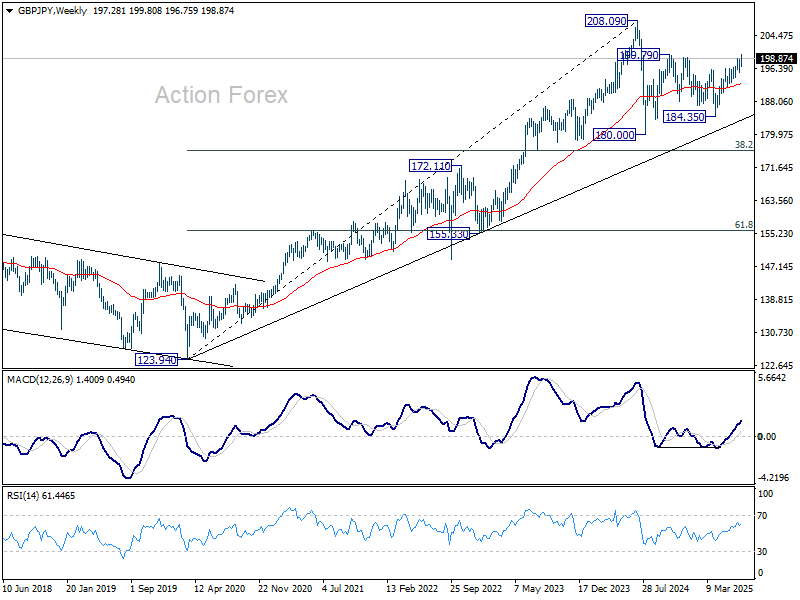
In the bigger picture, price actions from 208.09 (2024 high) are seen as a correction to rally from 123.94 (2020 low). The pattern might still extend with another falling leg. But in that case, strong support should be seen from 38.2% retracement of 123.94 to 208.09 at 175.94 to contain downside. Meanwhile, decisive break of 208.09 will confirm long term up trend resumption.
In the long term picture, there is no sign that the long term up trend from 122.75 (2016 low) has concluded. But firm break of 208.09 is needed to confirm resumption. Otherwise, more medium term range trading could still be seen.
EUR/JPY Weekly Outlook
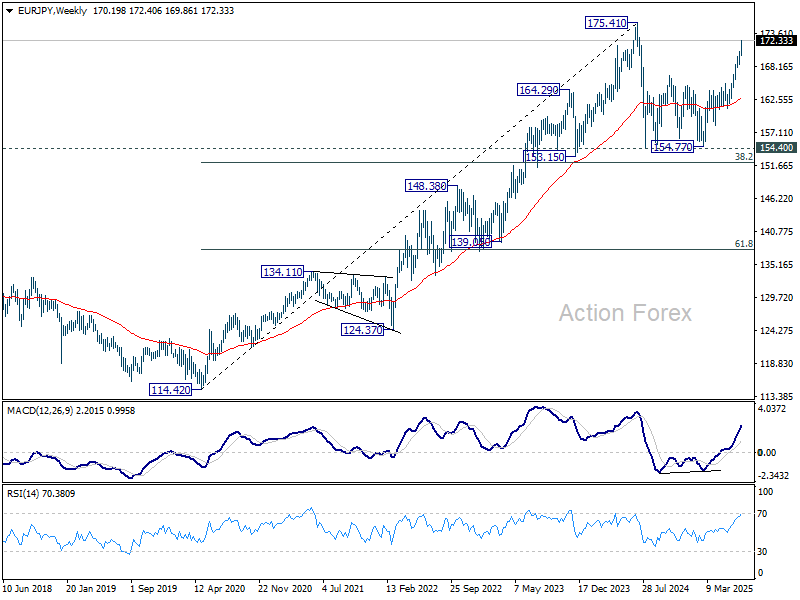
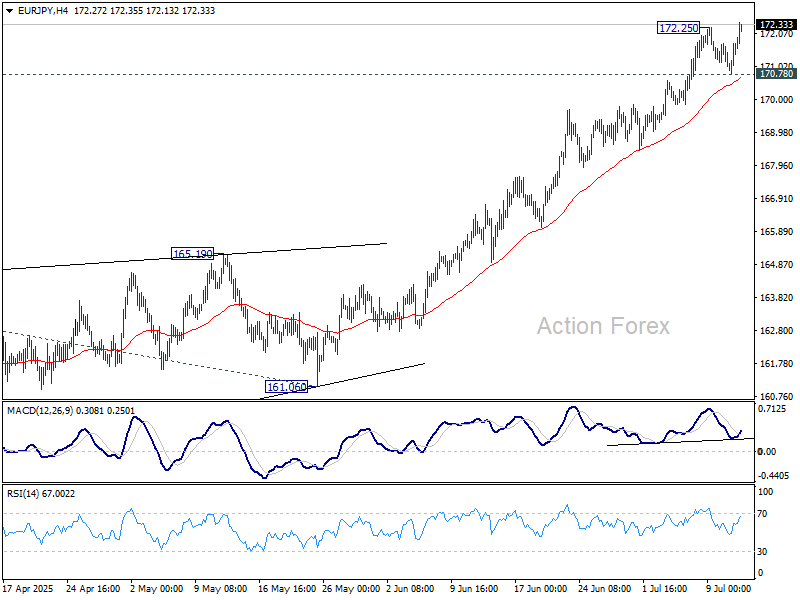
EUR/JPY's rally from 154.77 continued last week and the late breach of 172.25 temporary top suggests that it's resuming after brief consolidations. Initial bias is back on the upside this week for 138.2% projection of 154.77 to 164.16 from 161.06 at 174.03. On the downside, below 170.78 support will turn intraday bias neutral and bring consolidations first.
In the bigger picture, price actions from 175.41 (2024 high) are seen as correction to up trend from 114.42 (2020 low). The pattern might still extend with another falling leg. But in that case, strong support should be seen from 38.2% retracement of 114.42 to 175.41 at 152.11 to contain downside. Meanwhile, decisive break of 175.41 will confirm long term up trend resumption.
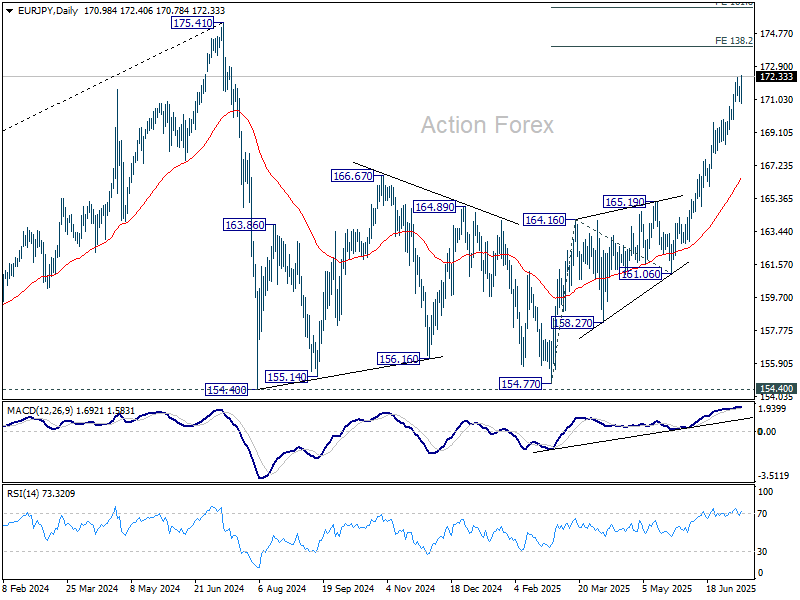
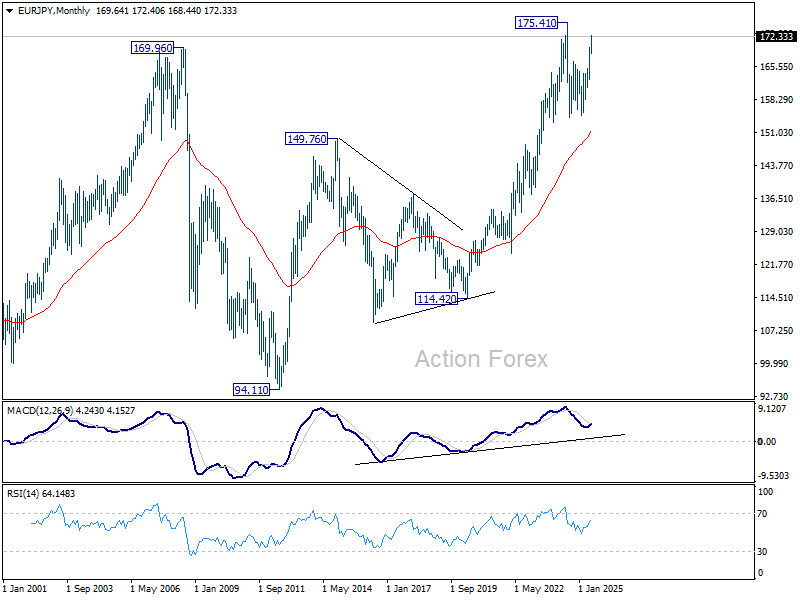
In the long term picture, there is no sign that the long term up trend from 94.11 (2021 low) has concluded. But firm break of 175.41 is needed to confirm resumption. Otherwise, more medium term range trading could still be seen.