Sample Category Title
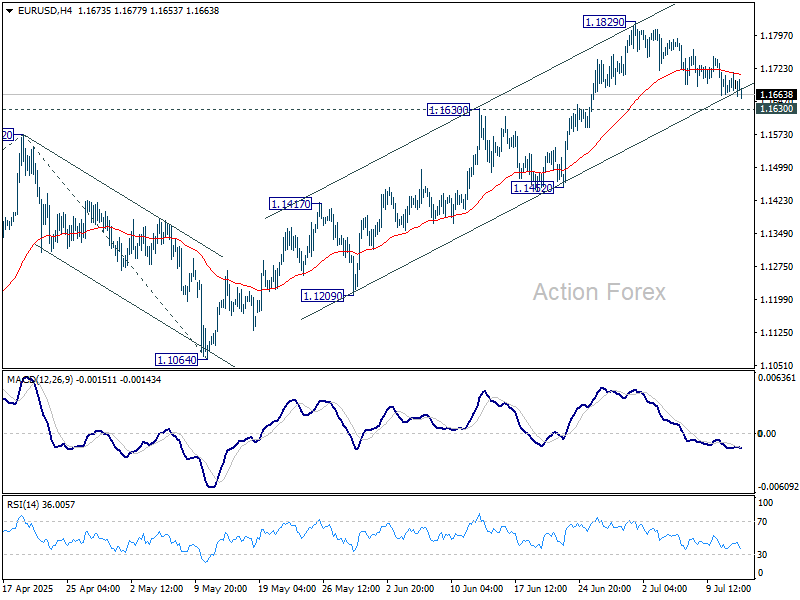
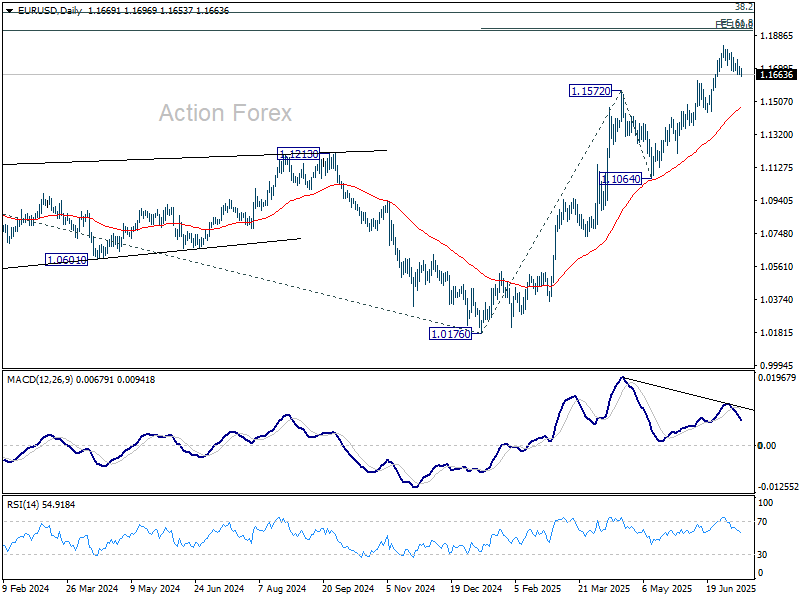
EUR/USD Daily Outlook
Daily Pivots: (S1) 1.1665; (P) 1.1690; (R1) 1.1714; More...
Intraday bias in EUR/USD remains neutral for the moment. Correction from 1.1829 is in progress but downside should be 1.1630 resistance turned support to bring rebound. Firm break of 1.1829 will resume the rise from 1.0176 and target 61.8% projection of 1.0176 to 1.1572 from 1.1064 at 1.1927. However, sustained break of 1.1630 will bring deeper fall to 55 D EMA (now at 1.1474) instead.
In the bigger picture, rise from 0.9534 long term bottom could be correcting the multi-decade downtrend or the start of a long term up trend. In either case, further rise should be seen to 100% projection of 0.9534 to 1.1274 from 1.0176 at 1.1916. This will now remain the favored case as long as 1.1604 support holds.
USD/JPY Daily Outlook
Daily Pivots: (S1) 146.53; (P) 147.03; (R1) 147.91; More...
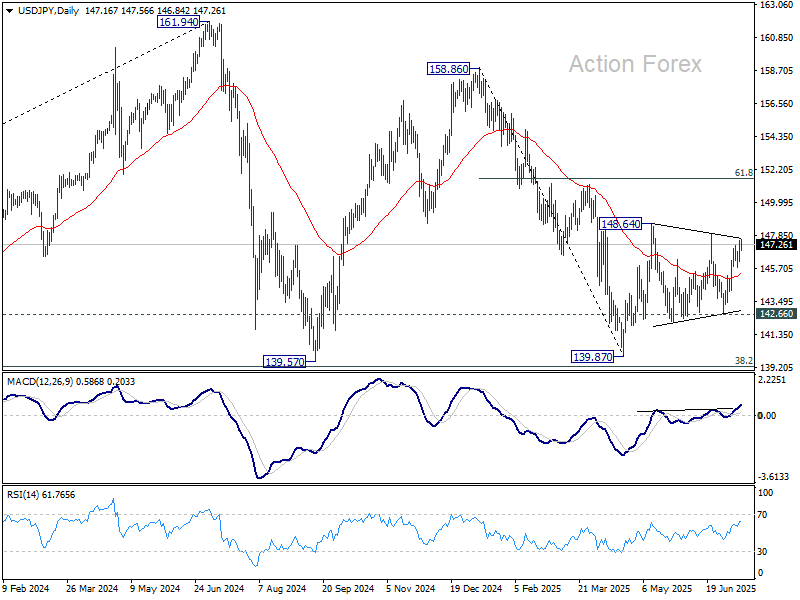
Focus is now on 148.01 resistance as rebound from 142.66 extends. Firm break there will indicate that consolidations pattern from 148.64 has completed. Further rise should then be seen to resume the rally from 139.87, to 61.8% retracement of 158.86 to 139.87 at 151.22.
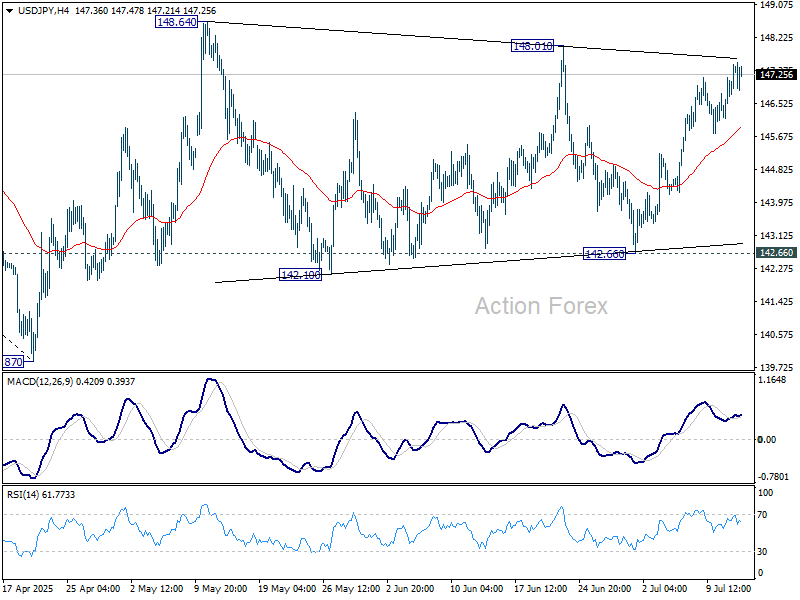
In the bigger picture, price actions from 161.94 (2024 high) are seen as a corrective pattern to rise from 102.58 (2021 low). There is no clear sign that the pattern has completed yet. But still, strong support is expected from 38.2% retracement of 102.58 to 161.94 at 139.26 to bring rebound.
GBP/USD Daily Outlook
Daily Pivots: (S1) 1.3454; (P) 1.3520; (R1) 1.3559; More...
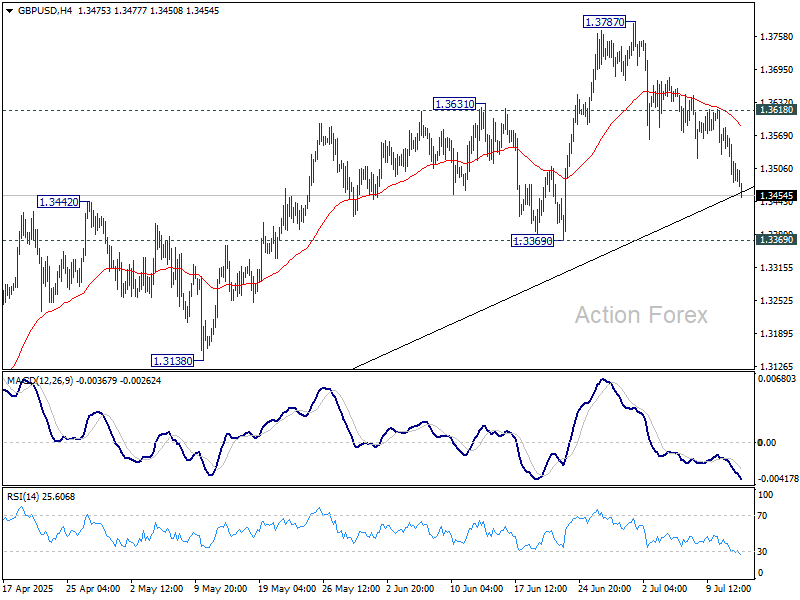
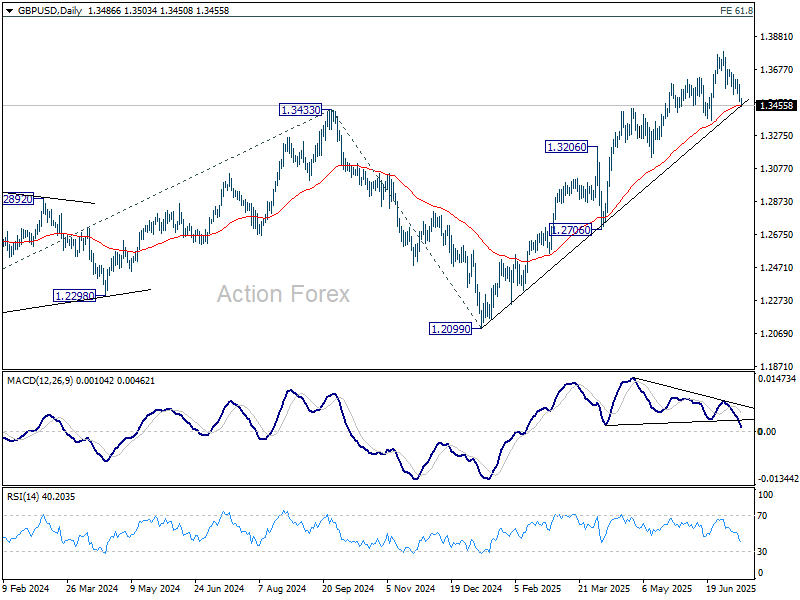
GBP/USD's pullback from 1.3787 extends lower today and deeper fall could be seen. But downside is expected to be contained by 1.3369 support to bring rebound. On the upside, above 1.3680 minor resistance will bring retest of 1.3787. Firm break of 1.3787 will resume larger up trend to 100% projection of 1.2099 to 1.3206 from 1.3138 at 1.3813. However, firm break of 1.3369 will bring deeper correction back to 1.2706/3206 support zone.
In the bigger picture, up trend from 1.3051 (2022 low) is in progress. Next medium term target is 61.8% projection of 1.0351 to 1.3433 from 1.2099 at 1.4004. Outlook will now stay bullish as long as 55 W EMA (now at 1.3019) holds, even in case of deep pullback.
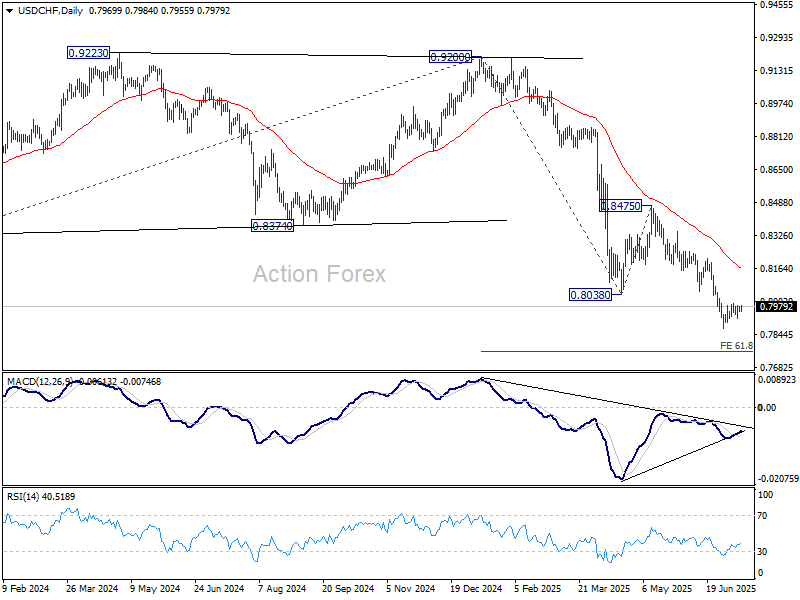
USD/CHF Daily Outlook
Daily Pivots: (S1) 0.7953; (P) 0.7968; (R1) 0.7981; More….
Intraday bias in USD/CHF remains neutral as consolidations continues above 0.7871. Stronger recovery might be seen but upside should be limited by 0.8054 support turned resistance. On the downside, firm break of 0.7871 will extend the larger down trend to 61.8% projection of 0.9200 to 0.8038 from 0.8475 at 0.7757.
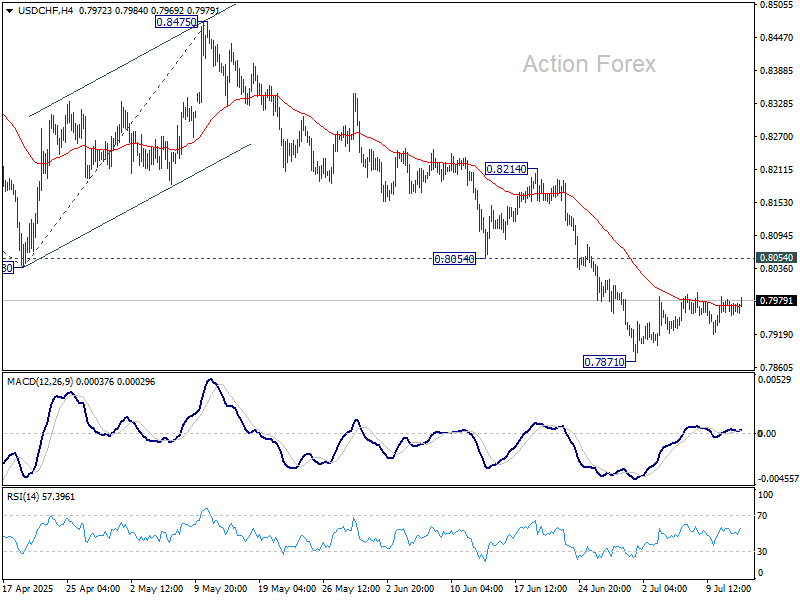
In the bigger picture, long term down trend from 1.0342 (2017 high) is still in progress. Next target is 100% projection of 1.0146 (2022 high) to 0.8332 from 0.9200 at 0.7382. In any case, outlook will stay bearish as long as 0.8475 resistance holds.
Market Reaction to Tomorrow’s US Inflation Numbers Might be a Point in Case,
Markets
US Treasuries sold off in a steepening move last Friday as the US informed more countries on the reciprocal tariff rate that would apply to them unless they secured a trade deal by August 1st. Mexico and Canada for example, which were exempt on Liberation Day, now face reciprocal charges of respectively 30% and 35%. US yields rose by 1.4 bps (2-yr) to 8 bps (30-yr) on a daily basis with the 30-yr tenor (4.97% this morning) dangerously close to piercing the psychological 5% barrier. The YtD high is situated at 5.15% and the short term direction of travel as stagflation vibes return. The market reaction to tomorrow’s US (June) inflation numbers might be a point in case, especially should we see an upward surprise. Friday’s sell-off was limited to US Treasuries (bonds in general) and contrasted with the sell America trade seen earlier this year. US stock markets corrected only 0.2%-0.6% while the trade-weighted dollar added slightly to this month’s gentle recovery. We warn against reading too much into this as (anti-US) sentiment could return quickly. Equity markets look more vulnerable than the US dollar given rather dovish Fed-positioning, rising inflation risks and with currencies from US trading partners vulnerable to negative growth risks. Over the weekend, the US also informed the EU that the tariff level would be set at 30% (instead of the 20% announced early April). Negotiations between the two remain ongoing with the EU in a first reaction backing down from retaliation (which according to the US letter would be matched one-on-one on top of the 30% rate). Simultaneously, the EU is stepping up its efforts to side with other countries hit by US tariffs, looking to deepen trade agreements.
Today’s empty eco calendar puts the spotlight on bear steepening trends in global bond markets. The Japanese 30-yr bond yield for example adds 10 bps this morning, coming with 3 bps of the 3.2% YtD high. Bonds and stock markets might sell-off in lockstep given the short window of time before reciprocal tariffs kick in.
News & Views
Both rating agencies Fitch and S&P raised the credit rating of Bulgaria to BBB+ from BBB (stable outlook). The rating upgrade comes after the ECOFIN council on July 8 approved the country’s application to adopt the euro on January 1st, 2026. Amongst others, Fitch mentions it will strengthen the monetary policy framework, reduce transaction costs, eliminate exchange-rate risk to corporate and household balance sheets and open up additional external funding options. Bulgarian banks will also have access to the ECB's liquidity facilities. Bulgaria's ratings are supported by its strong external and public finance balance sheets versus 'BBB' peers. Even as Fitch sees the debt-to GDP ratio increasing from 24.1% in 2024 to 34.7% in 2029, amongst others due to higher defense spending, it remains among the lowest in the BBB category. S&P also refers to the positive factors of policy support from joining the EU and removing residual FX risk, even as it admits that ECB policies likely align more with the cycles of larger members than Bulgaria.
Uncertainty on the business outlook and budget constraints led UK companies to reduce their hiring activity again in June, according to the KPMG and REC Jobs survey complied by S&P. The survey of recruitment consultancies signals an accelerated decline in hiring activity across the UK at the end of Q2. Permanent placements dropped at the fastest pace in 22 months. Temporary billings decreased at the fastest pace since February on a reduced confidence on the outlook with worries over higher costs. Supply of labour expanded at the steepest pace since November 2020. On the demand side, the survey sees a steeper decline in overall vacancies, especially in permanent vacancies. Lower demand for workers, tighter budgets and improvements in candidate supplies also have dampened wage growth. The survey indicates staring salaries and temporary wages to have increased at a pace notably weaker than historical trends. However, analysis of REC and KPMG executives on the survey outcome overall sounds a bit more balanced in particular on the outlook, especially if the government would be able to deliver on clear commitments and provide transparency on its (Labor) policy.
More Tariffs
Donald Trump continued his tariff reveals over the weekend, announcing that the EU and Mexico would be hit with 30% tariffs from August 1st. That’s far more than what the EU expected — they were hoping for a figure closer to what the UK secured: a 10% tariff, with exceptions for key sectors like metals and pharmaceuticals. Instead, they got a big, fat 30%.
Trump did leave the door open for further negotiations and some fine-tuning, but given the level of tariffs unveiled since last week, you have to wonder whether it’s worth the time and energy to negotiate with a government that appears to have lost the plot — or if it's better to pursue other deals with other nations. That’s what the Europeans are now discussing: finding new friends.
So, US and European futures are in the red this morning. DAX futures are the hardest hit as of writing — down 0.60%, while FTSE futures are flat. It’s becoming increasingly clear that the UK will be one of the rare privileged partners to retain 10% tariff access to US markets. But even that doesn’t seem to help much.
Friday’s UK production and growth figures were weak: GDP declined for the second month, and both industrial and manufacturing production dropped more than expected, dragged down by rising energy prices, property taxes, and trade uncertainty. This sent Cable below the 1.35 level, which also coincides with the 50-day moving average. Trend and momentum indicators in sterling remain firmly negative, reflecting weakening growth expectations and a shrinking fiscal headroom — pointing to higher taxes and lower spending, both of which are growth-negative. As such, the EURGBP is also marching higher, targeting the 88–89 cents range in the next three months.
Zooming out, the US dollar starts the week weaker, with renewed trade tensions limiting dollar appetite. However, the USDJPY is pushing higher, as political uncertainty in Japan is weighing more heavily than dollar softness. Japanese yields are once again under solid upside pressure this morning ahead of Sunday’s Upper House elections. Investors worry that if the LDP retains its majority, it will proceed with ample fiscal spending to support the economy, including a possible consumption tax cut. Remember, the Japanese pension funds and insurers are among the biggest buyers of US Treasuries, and rising Japanese yields could encourage them to repatriate funds back to Japan, potentially impacting global flows and causing volatility in global bond and stock markets.
In China, the new week begins with some encouraging data: exports rose 5.8% in May, beating expectations of 5%, partly thanks to partial tariff relief with the US. The CSI 300 looks better, while the Hang Seng Index is approaching its 2025 highs. If China can leverage US weakness to repair global relations, it could be a win for Beijing.
“But note that tensions between the EU and China are rising, as Europeans accuse China of undermining their industries — because they can’t match Chinese prices. There is, of course, a structural reason: basic salaries on a Chinese production line range from $500–800/month, while a similar worker in Germany may earn €2,500–3,000, €1,000–1,500 in Southern Europe, and around €600 in Bulgaria. But lower labour costs often come with capacity constraints. China has earned its ‘factory of the world’ status over the last two to three decades, and shifting that dynamic — by reshoring jobs to Europe or the US — would dent Western purchasing power with a structurally higher inflation and also weaker central bank support.
Anyway, the EURUSD is slightly better bid this morning on the back of a softer dollar. Interestingly, 30% tariffs on EU goods should, in theory, dampen euro demand, but the dollar’s weakness is dominating the narrative for now — not euro strength.
Elsewhere, gold is no longer reacting positively to trade turmoil, while silver is catching up on dollar softness, trading at $39/oz. Meanwhile, Bitcoin is extending its rally to fresh records, pushing above $120K this morning. It’s now back in overbought territory, suggesting that a correction to the $105K–$110K range wouldn’t be surprising. Still, the rally is underpinned by a crypto-friendly US policy shift and growing emerging market adoption — both remain intact.
This week, investors will keep an eye on trade news and shift focus to earnings, with big US banks and Netflix reporting Q2 results. Meanwhile, US and UK inflation figures will offer more insight into how tariffs and fiscal policies are feeding into prices. It's shaping up to be a busy week.
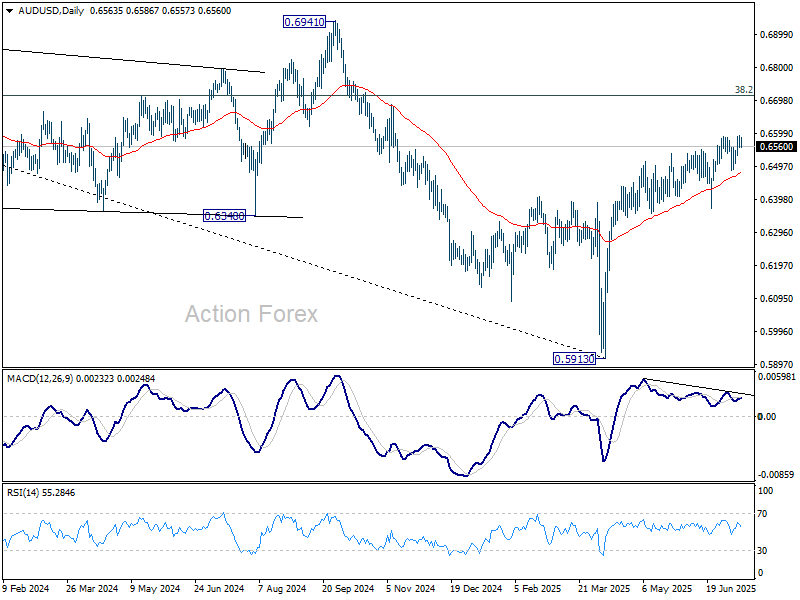
AUD/USD Daily Report
Daily Pivots: (S1) 0.6558; (P) 0.6576; (R1) 0.6596; More...
Intraday bias in AUD/USD is turned neutral first with current retreat. Some consolidations would be seen but further rise is expected as long as 0.6484 support holds. Above 0.6594 will resume the rally from 0.5913 and target 0.6713 fibonacci level.
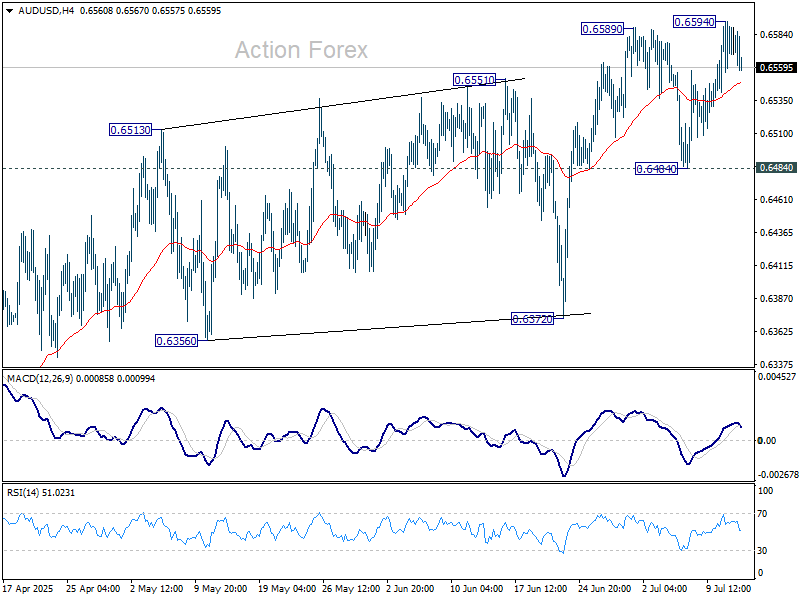
In the bigger picture, there is no clear sign that down trend from 0.8006 (2021 high) has completed. Rebound from 0.5913 is seen as a corrective move. While stronger rally cannot be ruled out, outlook will remain bearish as long as 38.2% retracement of 0.8006 to 0.5913 at 0.6713 holds. Nevertheless, considering bullish convergence condition in W MACD, even in case of another fall through 0.5913, downside should be contained above 0.5506 (2020 low).
USD/CAD Daily Outlook
Daily Pivots: (S1) 1.3651; (P) 1.3691; (R1) 1.3730; More...
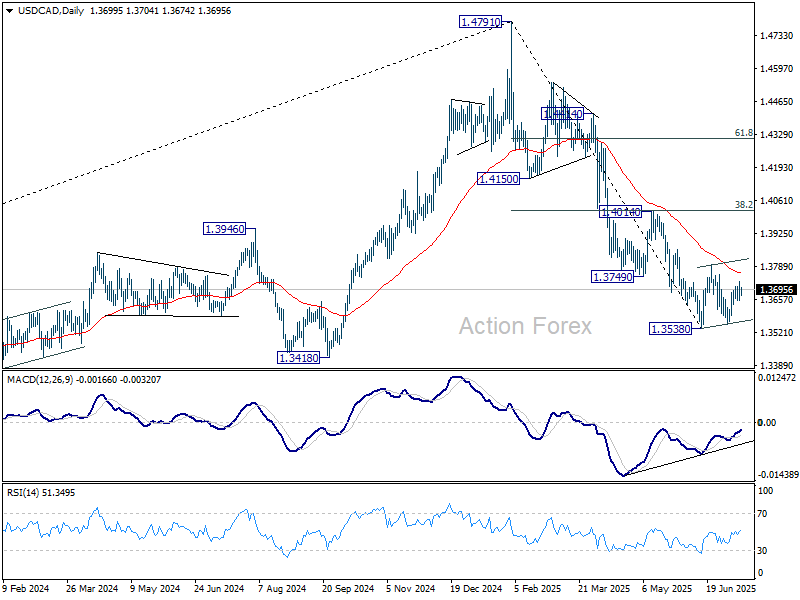
Intraday bias in USD/CAD remains neutral at this point. Overall, price actions from 1.3538 are seen as a corrective pattern, which is now in its third leg. Stronger rise could be seen and above 1.3728 will target 1.3797 resistance and probably above. On the downside, break of 1.3637 minor support will bring retest of 1.3538/55 support zone.
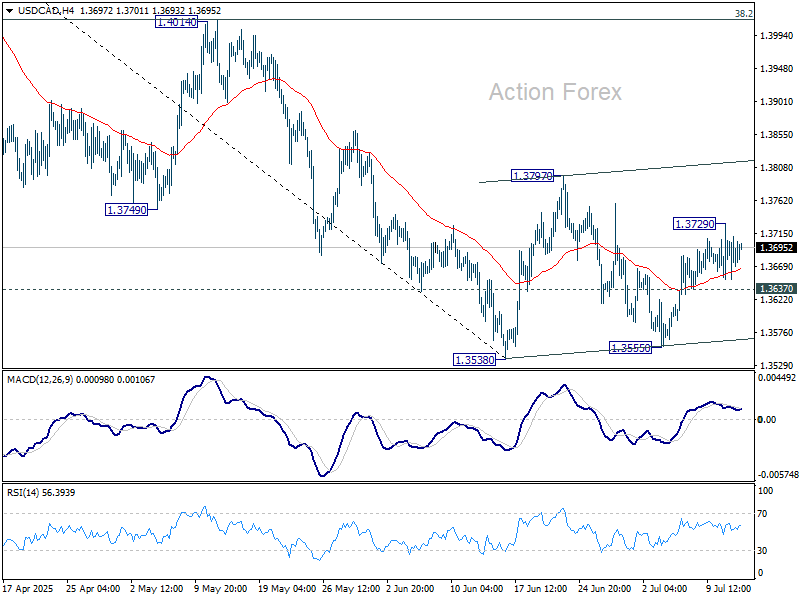
In the bigger picture, price actions from 1.4791 medium term top could either be a correction to rise from 1.2005 (2021 low), or trend reversal. In either case, further decline is expected as long as 1.4014 resistance holds. Next target is 61.8% retracement of 1.2005 (2021 low) to 1.4791 at 1.3069.
EUR/CHF Daily Outlook
Daily Pivots: (S1) 0.9300; (P) 0.9314; (R1) 0.9327; More....
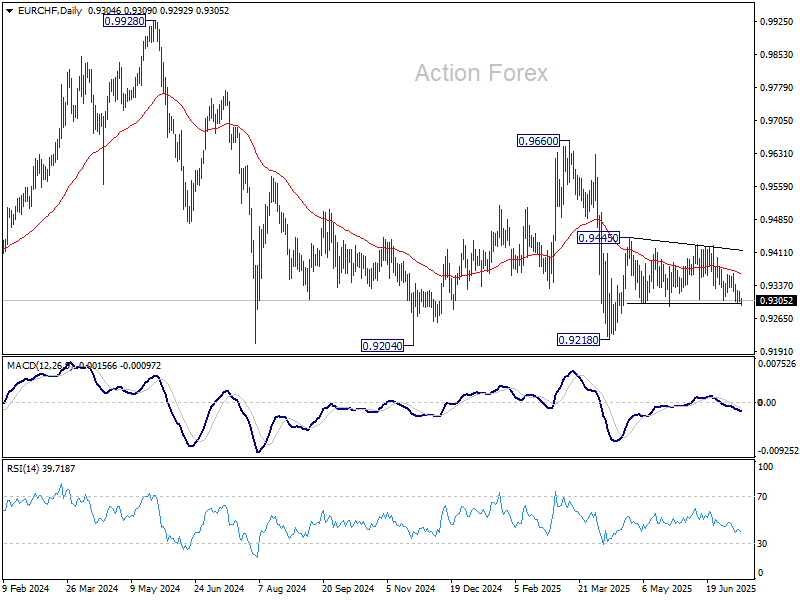
Intraday bias in EUR/CHF remains neutral at this point. On the upside, break of 0.9428/45 resistance zone will resume the rebound from 0.9218. On the downside, firm break of 0.9260 will bring retest of 0.9218 low instead.
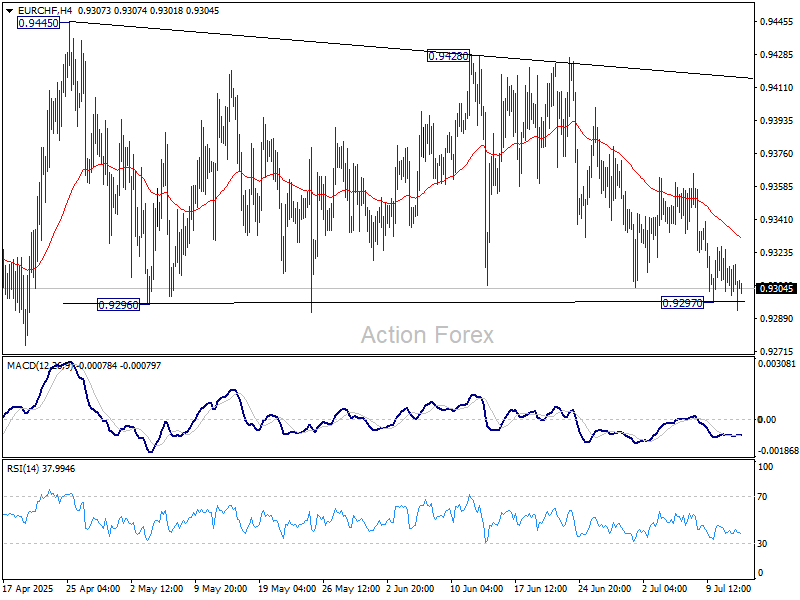
In the bigger picture, while downside momentum has been diminishing as seen in W MACD, there is no sign of bottoming yet. EUR/CHF is still staying below 55 W EMA (now at 0.9437) and well inside long term falling channel. Outlook will stay bearish as long as 0.9660 resistance holds. Break of 0.9204 (2024 low) will confirm resumption of down trend from 1.2004 (2018 high).
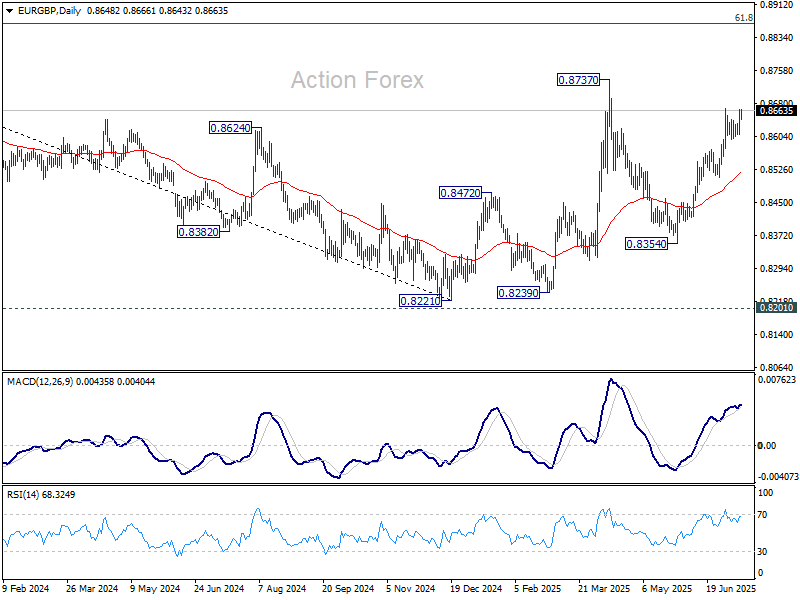
EUR/GBP Daily Outlook
Daily Pivots: (S1) 0.8627; (P) 0.8647; (R1) 0.8685; More...
Intraday bias in EUR/GBP stays neutral and more consolidations could be seen below 0.8668. Further rise is expected as long as 0.8573 resistance turned support holds. Above 0.8668 will resume the rally from 0.8354 to retest 0.8737 high.
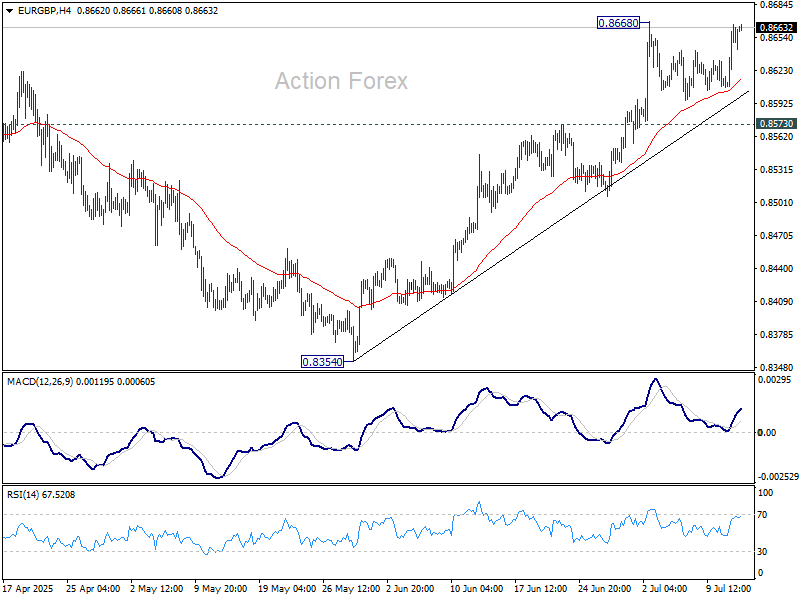
In the bigger picture, the structure from 0.8221 medium term bottom are not impulsive enough to suggest that it's reversing the down trend from 0.9267 (2022 high). But even if it's a correction, firm break of 0.8737 will still pave the way to 61.8% retracement of 0.9267 to 0.8221 at 0.8867.