
Sample Category Title
EUR/GBP Weekly Outlook
EUR/GBP stayed in consolidation below 0.8668 last week. Initial bias remains neutral this week first, and further rise is expected as long as 0.8573 resistance turned support holds. Above 0.8668 will resume the rally from 0.8354 to retest 0.8737 high.
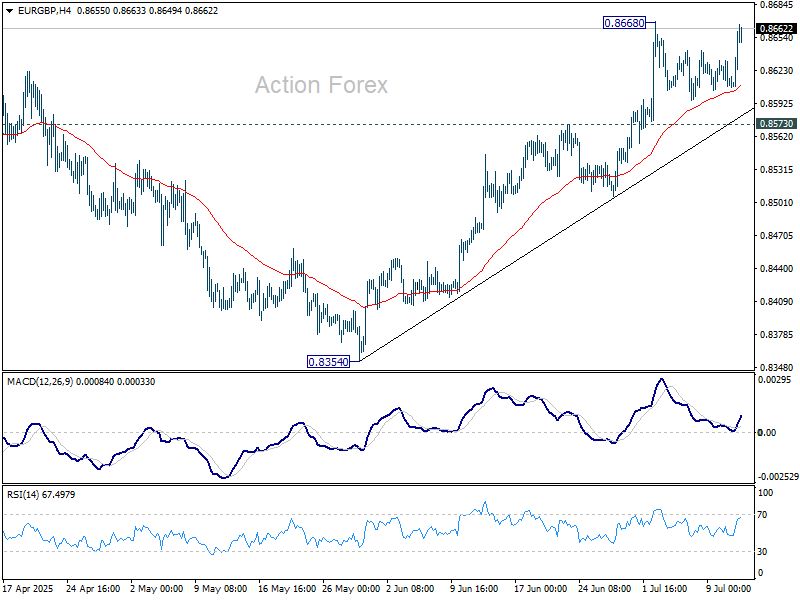
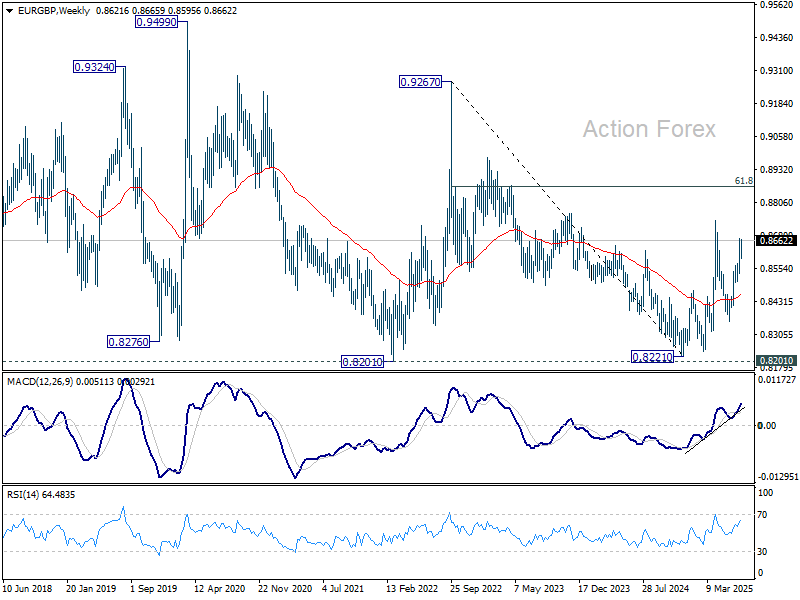
In the bigger picture, the structure from 0.8221 medium term bottom are not impulsive enough to suggest that it's reversing the down trend from 0.9267 (2022 high). But even if it's a correction, firm break of 0.8737 will still pave the way to 61.8% retracement of 0.9267 to 0.8221 at 0.8867.
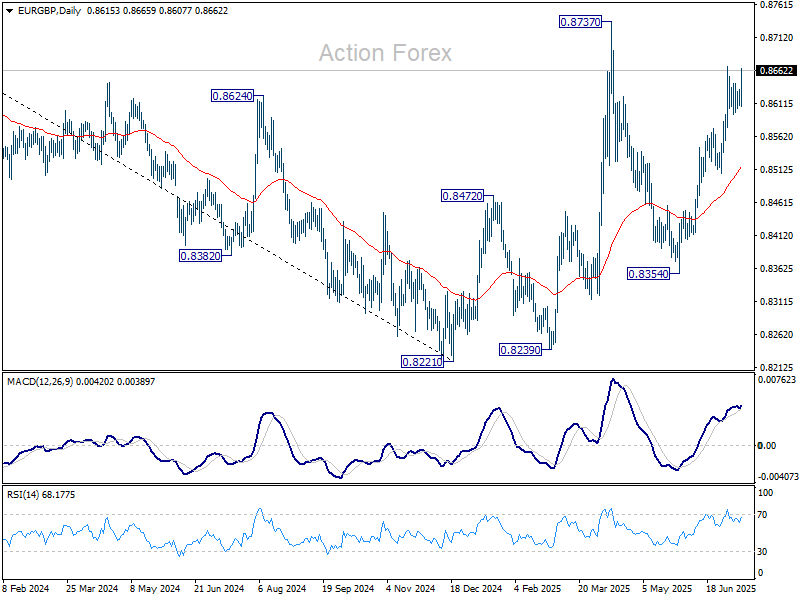
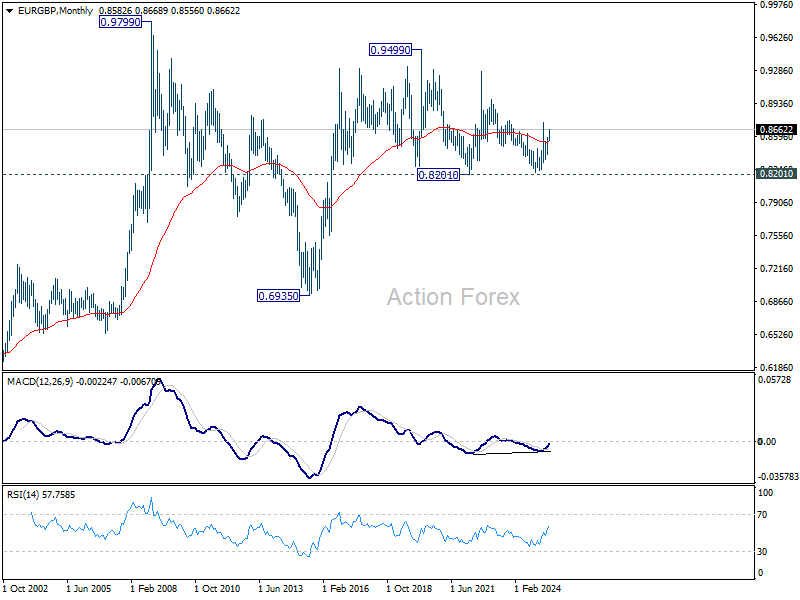
In the long term picture, price action from 0.9499 (2020 high) is seen as part of the long term range pattern from 0.9799 (2008 high). Range trading should continue between 0.8201 and 0.9499, until there is clear signal of imminent breakout.
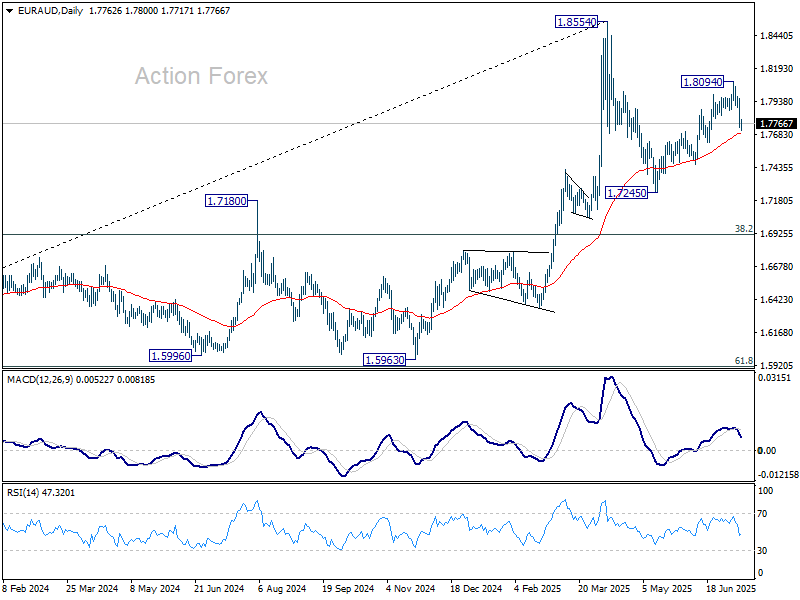
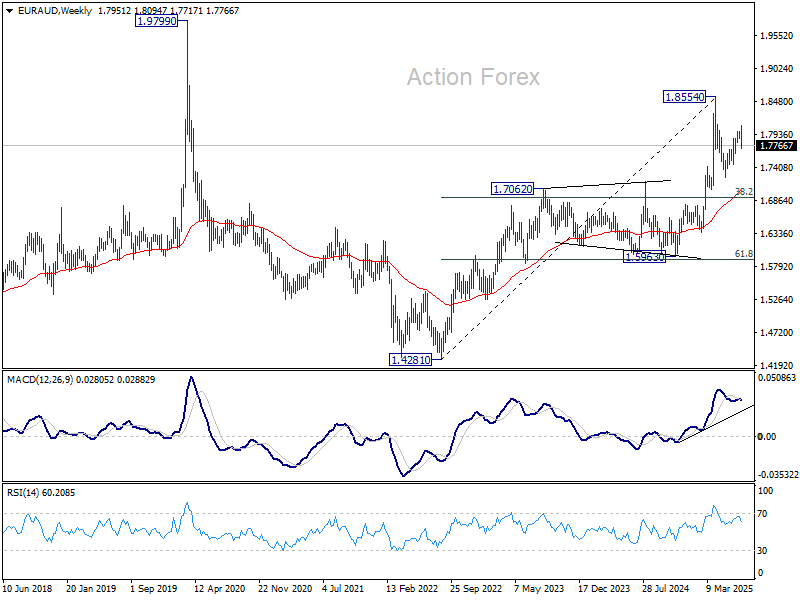
EUR/AUD Weekly Outlook
EUR/AUD edged higher to 1.8094 last week but reversed from there. The development suggests that rebound from 1.7245 has completed with three waves up to 1.8094. Initial bias stays on the downside this week. Sustained trading below 55 D EMA (now at 1.7694) will argue that corrective pattern from 1.8554 is already in the third leg. Deeper fall should then be seen back to 1.7245 support. Nevertheless, strong rebound from 55 D EMA will maintain near term bullishness for another rise through 1.8094 later.
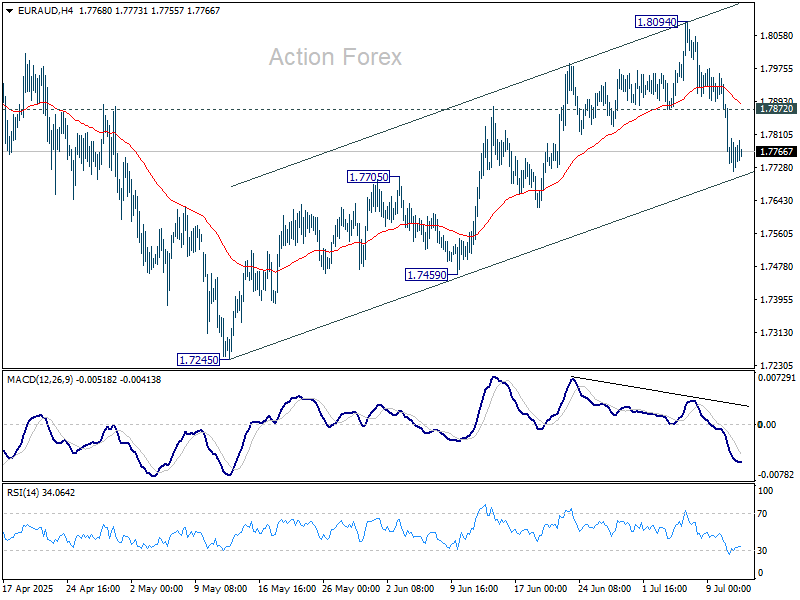
In the bigger picture, price actions from 1.8554 medium term are seen as a corrective pattern. While deeper pullback might be seen, downside should be contained by 38.2% retracement of 1.4281 (2022 low) to 1.8554 at 1.6922 to bring rebound. Up trend from 1.4281 is expected to resume at a later stage.
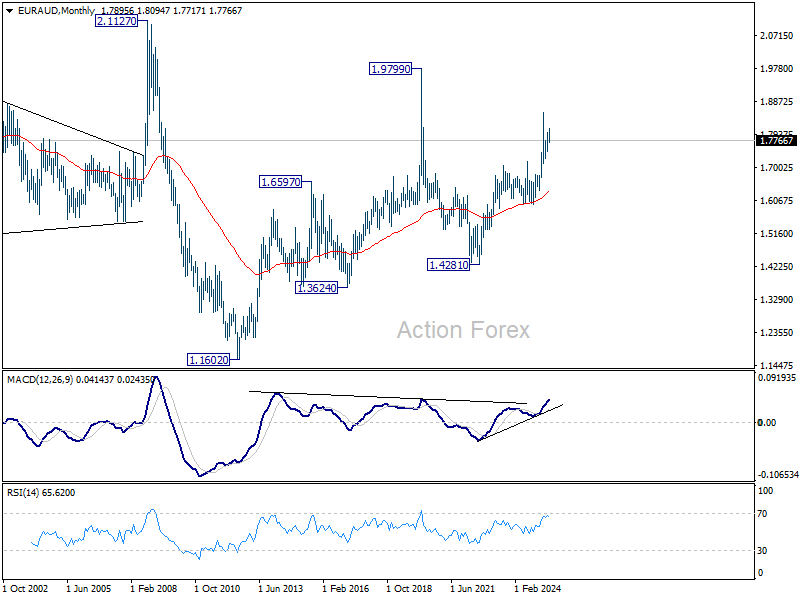
In the longer term picture, rise from 1.4281 is seen as the second leg of the pattern from 1.9799 (2020 high), which is part of the pattern from 2.1127 (2008 high). As long as 55 M EMA (now at 1.6365) holds, this second leg could still extend higher.
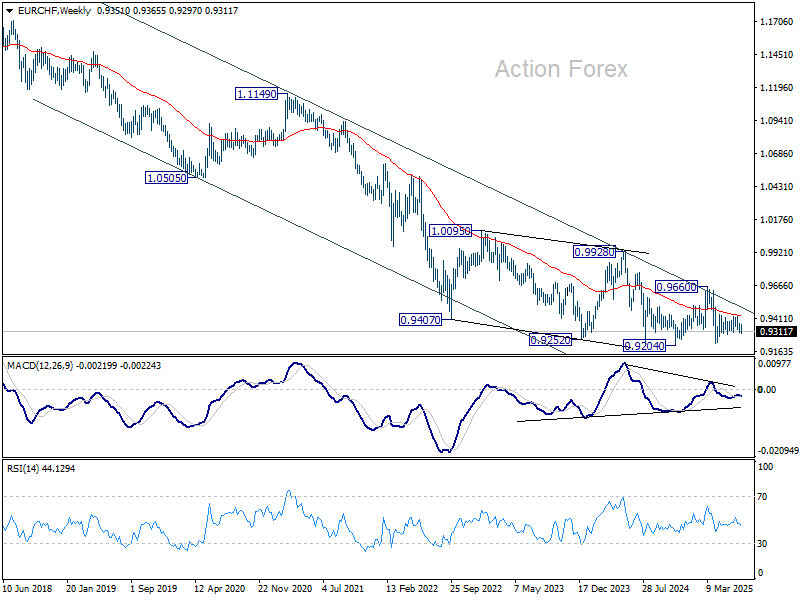
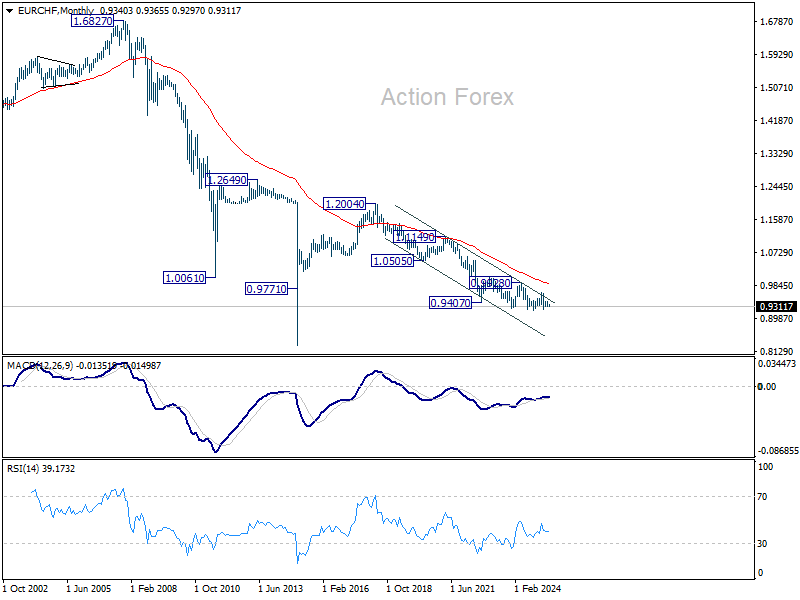
EUR/CHF Weekly Outlook
EUR/CHF edged lower to 0.9297 last week but quickly turned sideway again. After all, range trading continued between 0.9260/9428. Initial bias remains neutral this week first. On the upside, break of 0.9428/45 resistance zone will resume the rebound from 0.9218. On the downside, firm break of 0.9260 will bring retest of 0.9218 low instead.
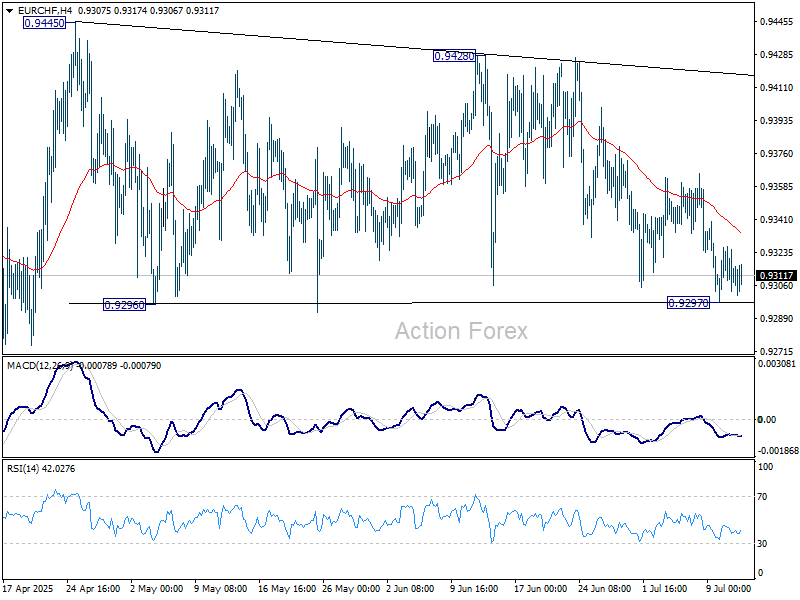
In the bigger picture, while downside momentum has been diminishing as seen in W MACD, there is no sign of bottoming yet. EUR/CHF is still staying below 55 W EMA (now at 0.9437) and well inside long term falling channel. Outlook will stay bearish as long as 0.9660 resistance holds. Break of 0.9204 (2024 low) will confirm resumption of down trend from 1.2004 (2018 high).
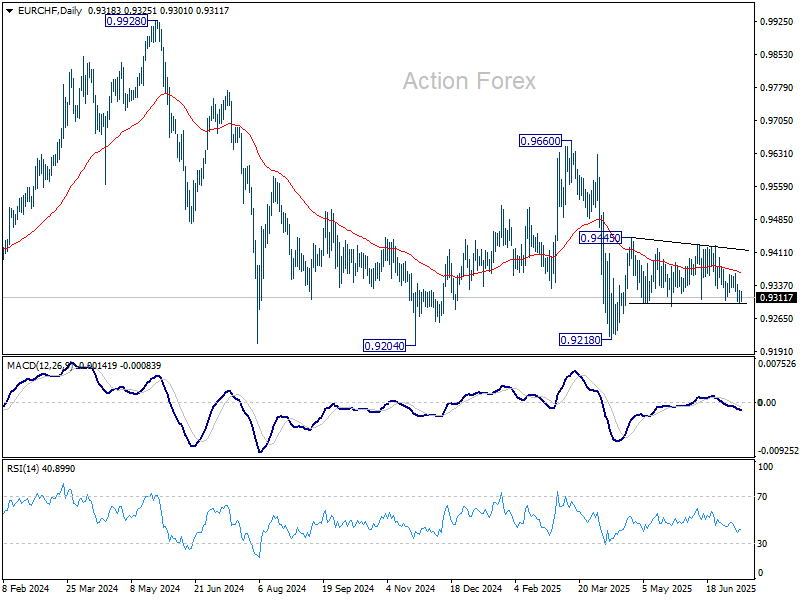
In the long term picture, overall long term down trend is still in progress in EUR/CHF. Outlook will continue to stay bearish as long as 55 M EMA (now at 0.9877) holds.
Markets Weekly Outlook – Inflation Storm Ahead as Earnings Season Gets Underway
Week in review: Tariff Uncertainty Drags On
The July 9 tariff deadline has come and gone and market participants are still left with a lot of questions. Trade deals have begun to filter through but the majority of countries are still locked in negotiations with the US as the tariff implementation date of August 1 beckons.
The lack of high impact US data this week left markets with tariffs and trade deals to focus on. In typical Donald Trump style, the US President did not disappoint. Levying new tariffs on allies and other countries while urging them to ‘keep working hard’ in the tariff discussions.
The Fear and Greed index remains comfortably in greed territory despite the uncertainty which continued this week.
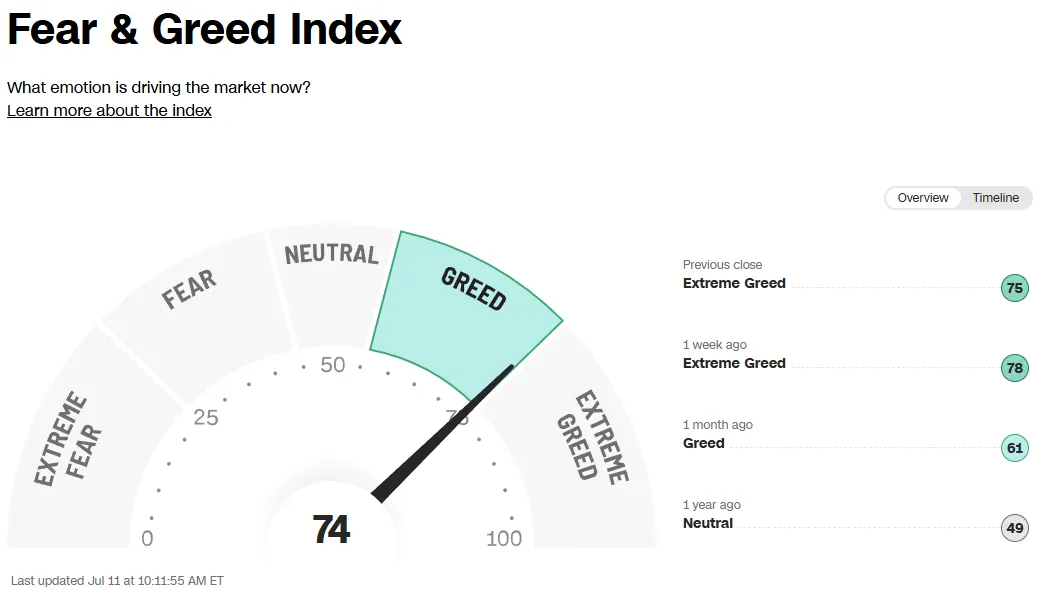
Source: FinancialJuice
On Thursday, Trump announced a 35% tariff on Canadian imports starting next month, increasing from the 25% set in March. He also warned the tariff could go even higher if Canada fights back.
Trump also suggested raising tariffs on other countries to 15% or 20%, up from the current 10%.
Source: LSEG
The market reacted more calmly to the new tariff announcements compared to the sharp drops seen after April's "Liberation Day," when major indexes had their worst weekly losses in nearly six years.
The S&P 500 and Nasdaq are heading for a slight drop this week, while the Dow is set to break its three-week winning streak, the longest since January. Nvidia (NVDA.O) made history by becoming the first company to reach a $4 trillion valuation, with its shares hitting a new record high.
The reaction by Gold may be a sign that market participants are still concerned about the uncertainty. The precious metal roared to life at the back end of the week, rising to trade at 3365/oz at the time of writing.
Cryptocurrencies were another winner this week with Bitcoin in particular faring excellently. The World's largest cryptocurrency rose to fresh all-time highs as institutional investors continue to pile in.
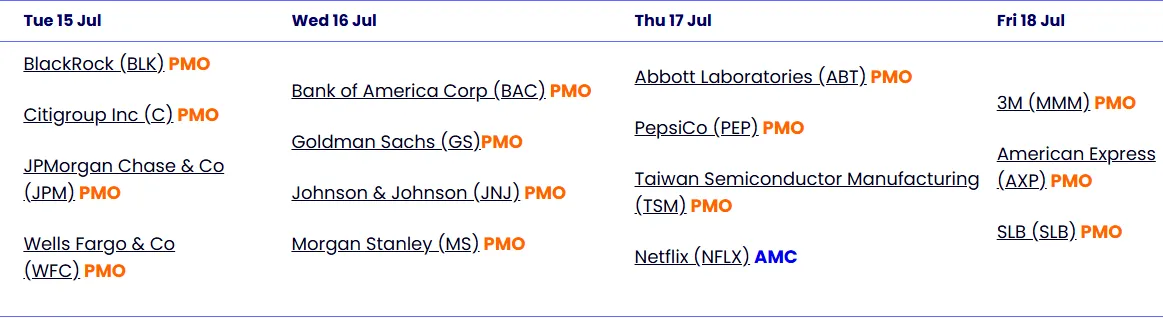
Earnings Season is Back. What to Expect?
Earnings season will kick into gear in the US next week and with tariffs yet to begin one wonders if it may mirror the Q1 run with a lot of caution and concerns being noted by major corporations.
Investors are looking ahead to understand how trade issues have affected businesses in the US and what are businesses expecting moving forward into Q3 and beyond. Given that tariffs are yet to be implemented, market participants may be left with more questions than answers once more and such uncertainty could weigh on US equities.
However, if companies do provide optimistic updates and we do get a flurry of trade deal announcements, US equities could continue to advance.
Source: Interactive Investor
The Week Ahead: Flurry of Inflation Data, Earnings Season Returns and Tariff Uncertainty Lingers
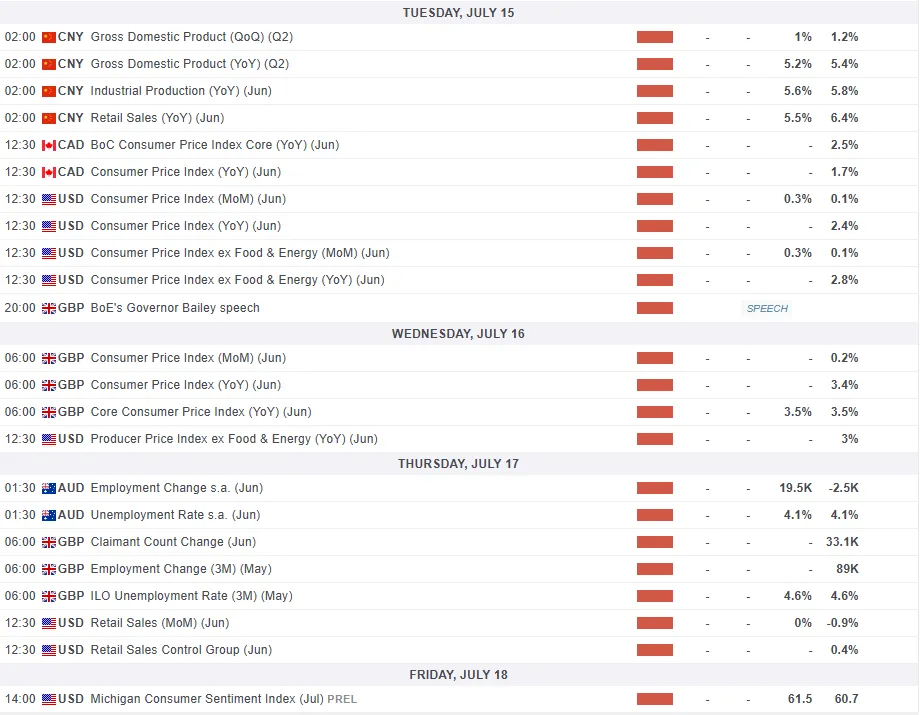
The week ahead has several important data releases lined up. The US and UK will release inflation data with key GDP data from China and manufacturing data from Japan.
Asia Pacific Markets
In China, Trade data on Monday is expected to show slight growth in exports and imports, with little sign of trade frontloading during the tariff pause.
Second-quarter GDP is expected to stay around 5% year-on-year. Housing price data will reveal if recent declines continue or were temporary. Another big drop may lead to more real estate stimulus, with a possible meeting in the week ahead to discuss it.
Retail sales have been strong, but industrial production and investment have weakened. Markets expect this mixed trend to continue in June.
In Japan, June exports are expected to rebound, with stronger growth to Asia (excluding China) and the EU, while exports to China and the US may lag due to tariffs.
Machinery orders are expected to show a slight increase supported by strong tech investment. Friday's CPI report should show a slight drop in pressure due to capped energy and food prices, but inflation will likely stay above 3%.
Economic Data from Europe, UK and the US
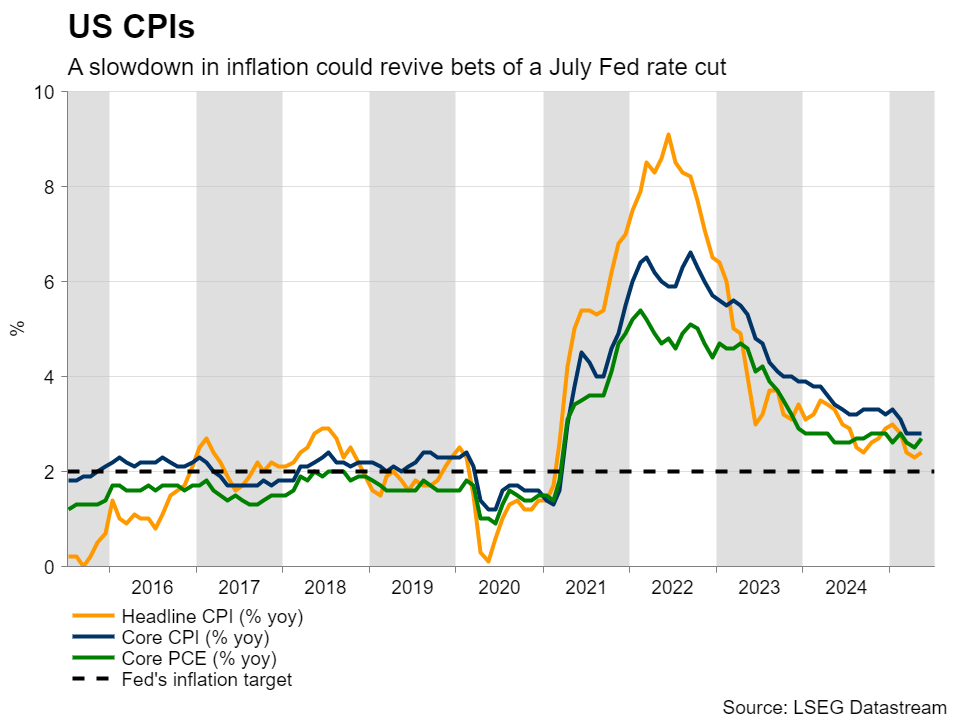
In developed markets, US inflation takes center stage. Inflation has been steady recently, with monthly increases of 0.1% and 0.2%. However, I expect it would take about three months after the tariffs for their effects to appear. This means the July, August, and September CPI reports will likely show a bigger impact. There is a possibility that core CPI will rise in Tuesday's report and may be worth monitoring.
Looking at the Euro Area, we have a few data releases to pay attention to.
The Euro Area saw strong growth in production and exports in the first quarter, driven by frontloading before “Liberation Day,” April saw declines as those effects faded. However, industrial production in April was still higher than in January.
While new orders show signs of stabilizing, it seems April's production levels were still boosted by frontloading. The key question is whether the tariff pause caused another wave of frontloading or if production and exports have returned to normal or even dropped due to higher tariffs.
May data will be crucial in understanding this and will provide a clearer picture of second-quarter GDP trends.
Moving to the UK, we have both jobs and inflation data on deck next week.
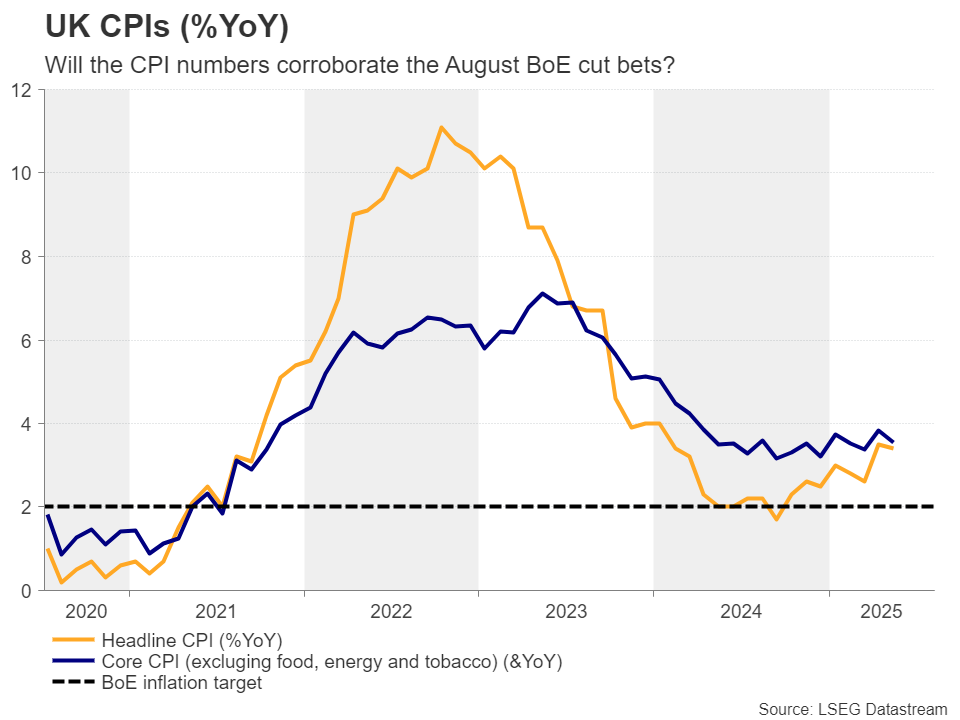
On the inflation front all eyes will be on UK service inflation which is expected to drop further, likely giving the Bank of England confidence to cut rates again in August. There will be even more pressure for a cut after the UK GDP release on Friday.
Job numbers are more important for markets than inflation next week. In May, payrolled employee numbers fell at the fastest rate since 2014 (excluding the pandemic). This data might be revised higher, but if it isn’t and if June’s numbers are also bad, it could push the Bank of England to speed up rate cuts.
For all market-moving economic releases and events, see the MarketPulse Economic Calendar. (click to enlarge)
Chart of the Week - Gold (XAU/USD)
This week's Chart of the week is Gold (XAU/USD).
Gold has shrugged off its early week decline with an eye on three successive days of gains to end the week.
The precious metal benefiting from tariffs imposed by Donald Trump this week on a host of countries including neighbor Canada.
The lack of concrete trade deal announcements only adds to the confusion as market participants surely cannot wait for an end to the saga.
From a technical standpoint Gold bounced from the golden pocket fibonacci area between the 61.8-78.6 and printed a fresh high.
The question heading into next week will be whether there will be follow through and if the precious metal can regain the $3400/oz handle.
This is likely to depend on the developments around tariffs and trade deals, which will likely remain the driving factor for the precious metal and either fuel haven demand or lead to some form of unwinding, should a flurry of trade deals be announced.
Gold (XAU/USD) Four-Hour (H4) Chart - July 11, 2025
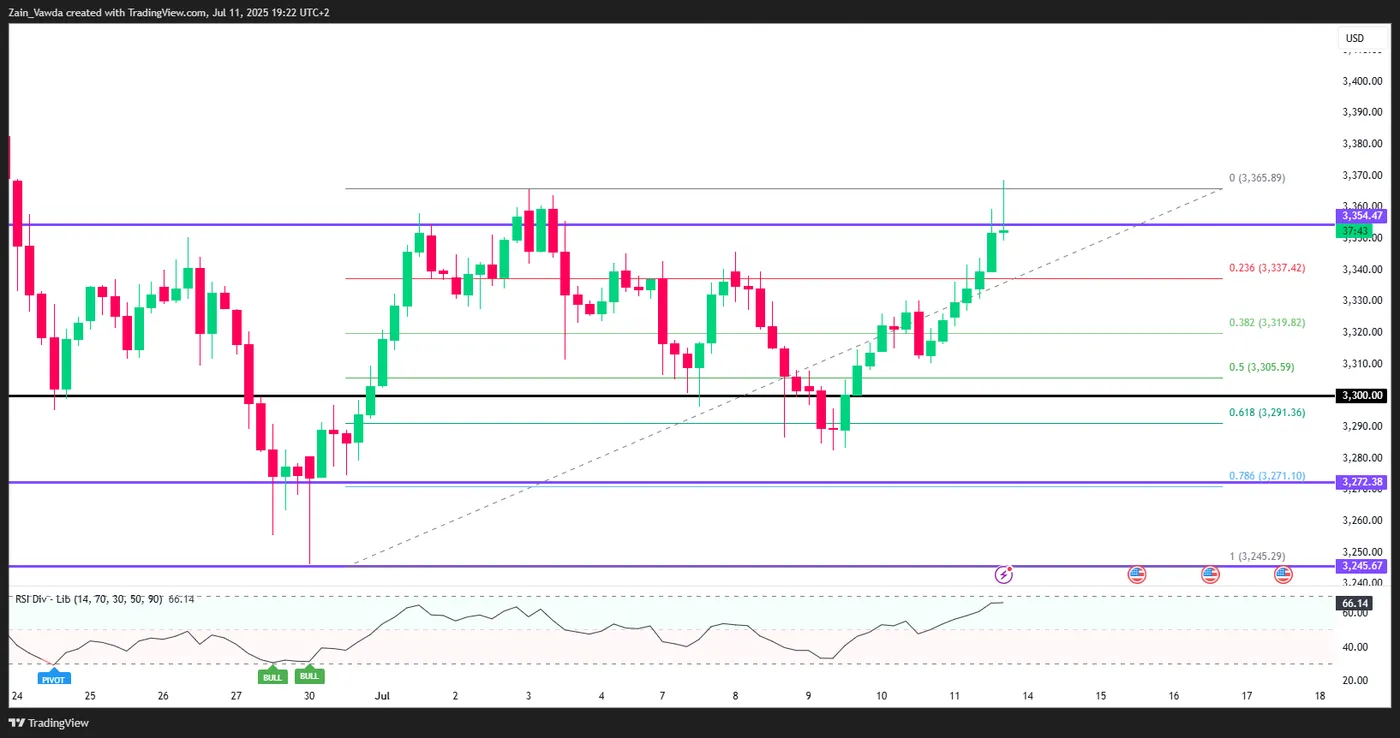
Source:TradingView.Com (click to enlarge)
Key Levels to Consider:
Support
- 3337
- 3325
- 3300
Resistance
- 3375
- 3400
- 3425
The Weekly Bottom Line: Trade Fireworks in July
Canadian Highlights
- The tariff roller coaster rumbled on this week with Canada receiving a tariff letter from President Trump announcing a higher 35% tariff rate beginning August 1st.
- The market response to the Canadian news has been muted, and rightfully so, as hope for negotiations persists.
- The labour market offered some good news this morning, with the unemployment rate falling back to 6.9%, on healthy employment gains.
U.S. Highlights
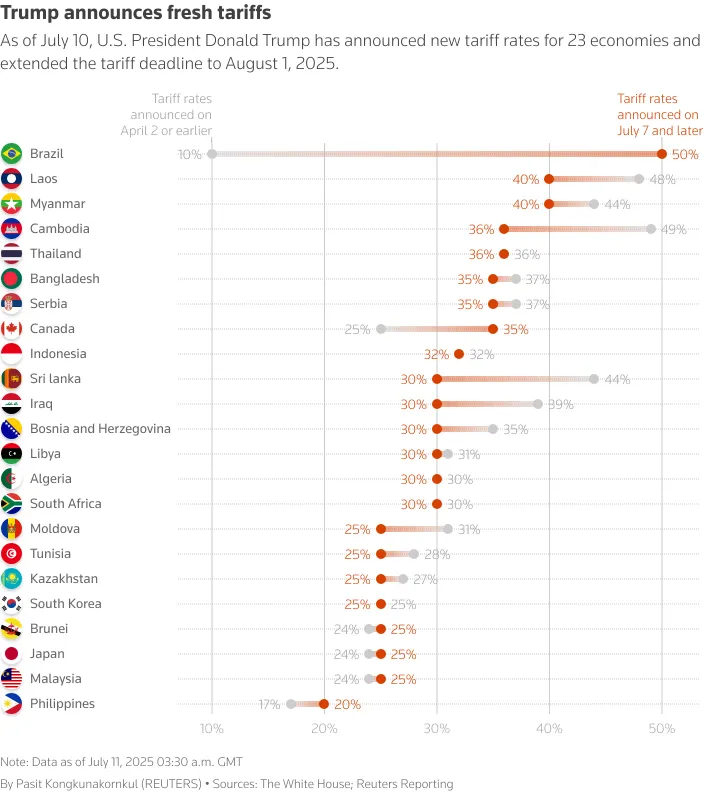
- Trade tensions heated up this week, as President Trump announced higher tariffs on 23 trading partners as well as a 50% tariff on copper imports as of August 1st.
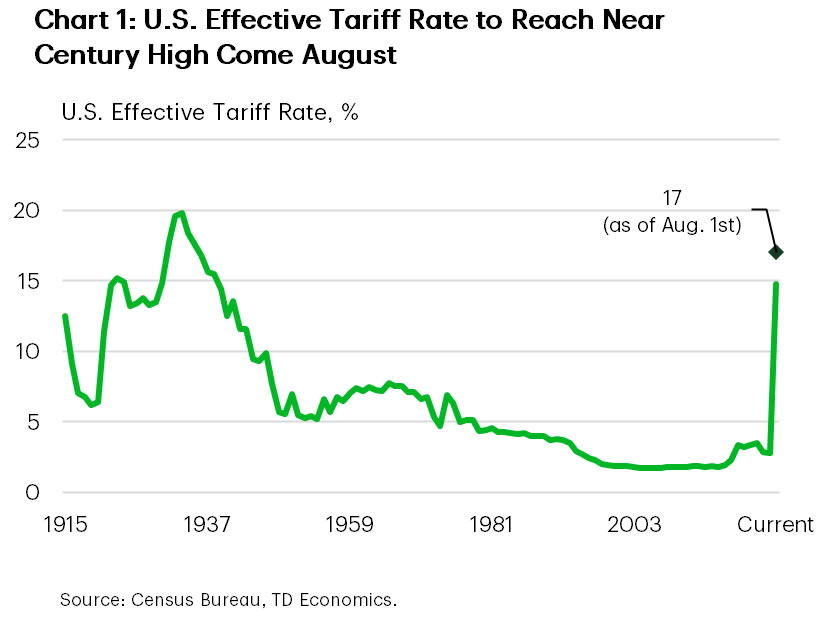
- If implemented, the combined announcements would add over 2 percentage points to the U.S. effective tariff rate, bringing it to a near century high of 17%.
- Minutes from the June 17th-18th FOMC meeting showed a growing divide among policymakers on when to resume rate cuts. A September rate cut is currently 63% priced in by Fed futures markets.
Canada – Good News, Bad News
The tariff roller coaster rumbled on this week with Canada among the list of countries receiving a tariff letter from President Trump. A higher tariff rate of 35% is supposed to take effect August 1st, a date that comes after the one month deadline Prime Minister Carney and President Trump outlined at the G-7 meeting in June. The President also announced a new 50% tariff on copper, and a delay in the threatened pharmaceutical tariff.
The market response to the Canadian news has been muted, and rightfully so as a lot remains unclear. The 35% rate is above the current 25% rate on non-USMCA compliant goods from the fentanyl-related tariffs. However, further muddying the water are emerging reports that USMCA compliant goods might still be eligible for duty free access to the U.S., blunting some of the pain of the higher rate.
Any carve-out is material. Although the top-line tariffs are still high, and together with the sectoral tariffs, are impacting the flows of goods to the U.S., many products (almost 60%) that crossed the border were USMCA compliant in May.
Ultimately, where the final rate lands is still an open question. The President continues to emphasize room for negotiation, and talks are ongoing. Unfortunately for the Canadian economy, uncertainty abounds amid the multitude of different tariff rates, deadlines and exemptions. Steely patience seems to be a prerequisite as the deadline for a deal approaches.
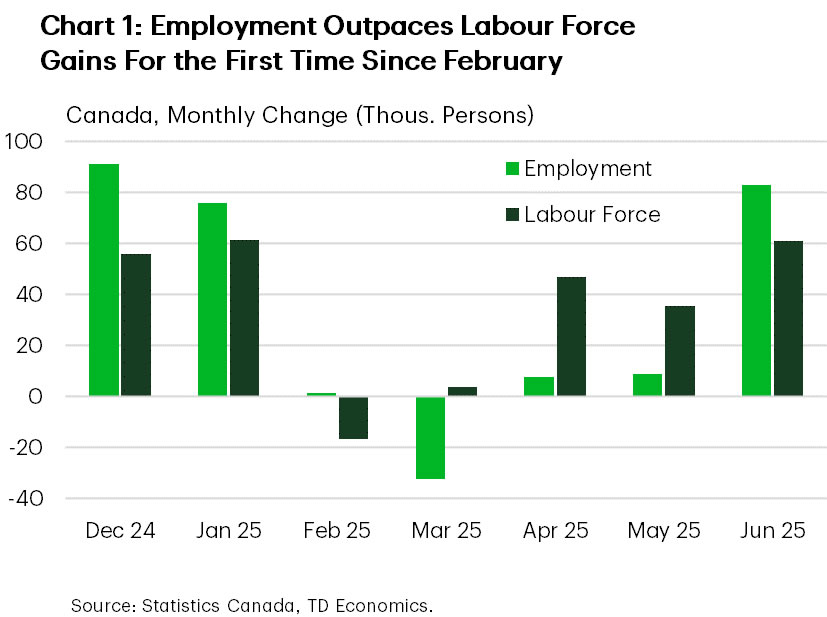
For Canadians tired of the roller coaster, the labour market brought good news this week. Employment growth popped, outstripping the ongoing strenght of gains in the labour force, to bring the unemployment rate back down to 6.9% (Chart 1). The gains were healthy and broad based, with the private sector leading the way. Even emphasis on part-time job gains this month can’t gloss over the fact that 13k full time positions were added, building on the 58k gain last month, and continuing their recovery from the losses in February and March.
So this is a week of two opposite signals. The tariff threat looms with a new August 1st deadline, but the labour market has shown some verve after the initial shock of uncertainty and fear. A healthier than expected labour market does give the Bank of Canada some additional breathing room, something markets have responded to, now expecting only one cut by the end of the year.
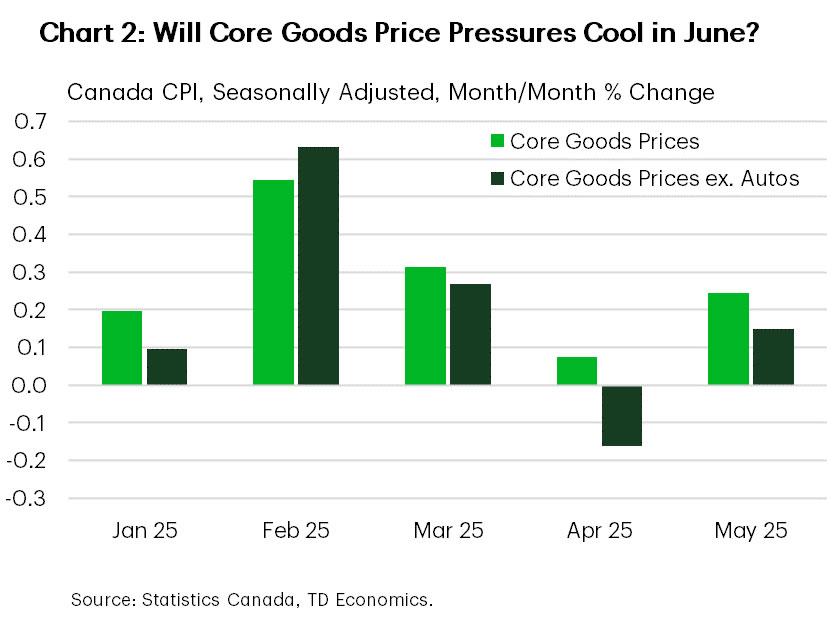
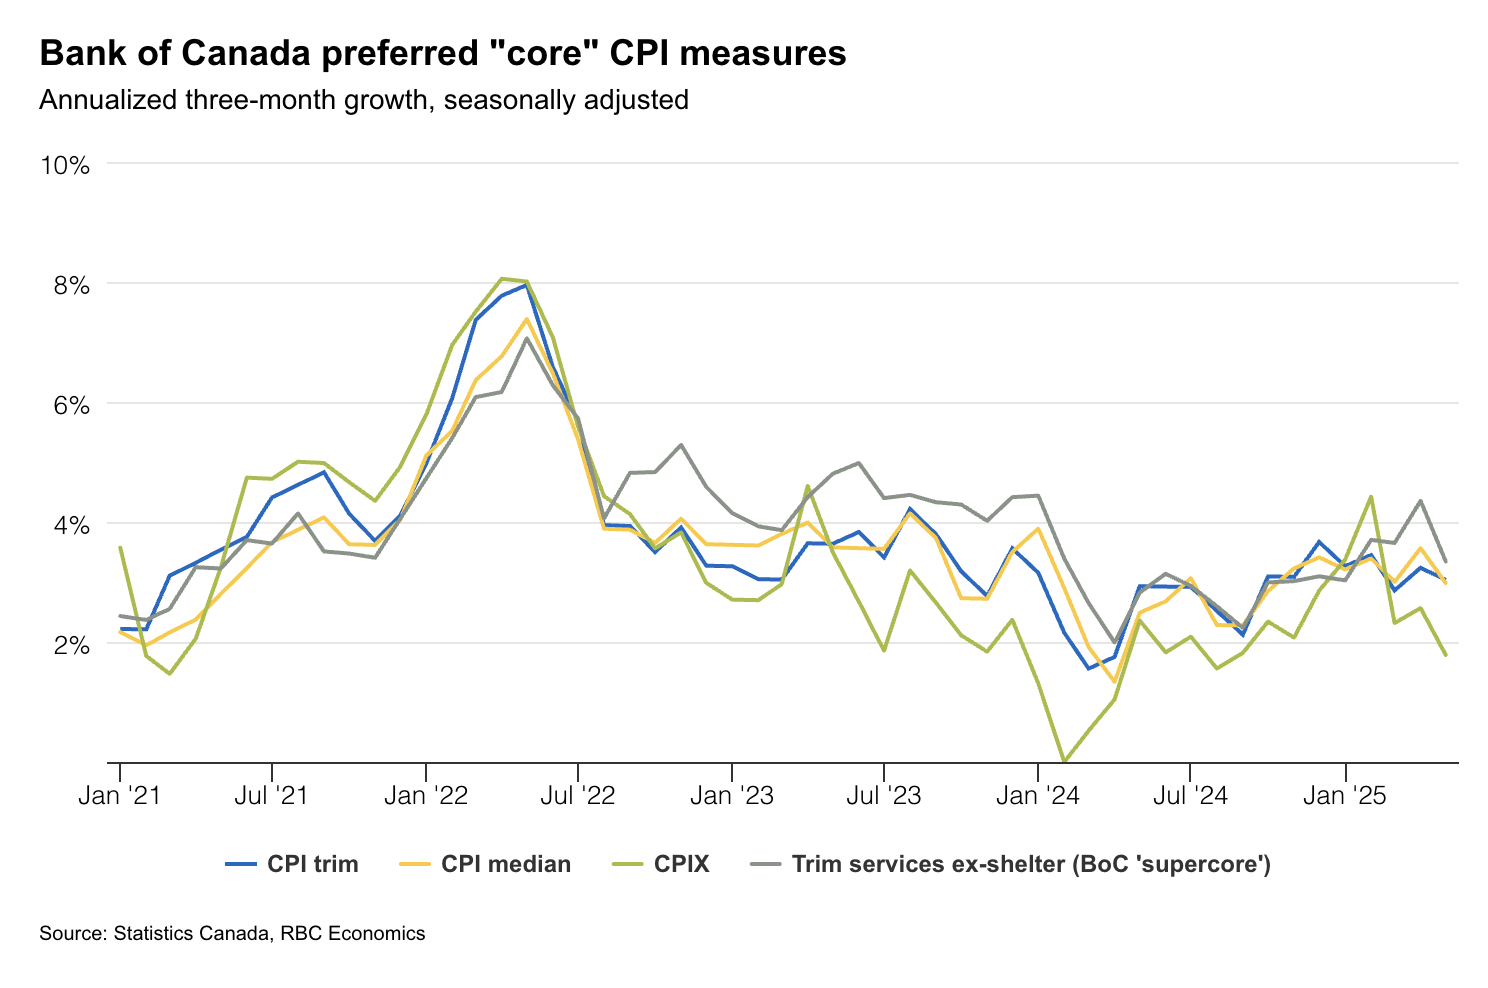
That said, the primary focus remains on inflation, and we will be getting the next iteration of the Consumer Price Index report next week. Canadian tariffs on U.S. goods have targetted food and beverage items, categories that have seen large price gains. However, core goods prices (excluding automobiles) have registered more tepid growth (Chart 2). The name of the game will be looking for hints of further tariff pass through to prices, and whether they seem persistent of temporary.
U.S. – Trade Fireworks in July
Financial markets were jittery to start the week, with the 90-day delay on the April 2nd “reciprocal tariffs” set to expire on Wednesday. While President Trump ultimately extended the deadline for another few weeks, he simultaneously ratcheted up trade threats on various fronts. He announced a 50% tariff on all copper imports, raised the tariff rate on Brazil to 50% and Canada to 35%, all effective August 1st. For Canada, the details remain sparse, but it’s assumed that all exports that are USMCA complaint – which is just under 60% of goods – would remain exempt from these tariffs. In addition, the administration sent letters to 21 other countries, including larger trading partners like Japan and South Korea, also threatening significantly higher tariffs come August. In total, the 23 countries put on notice account for $827B (or 25%) of annual U.S. imports – after accounting for USMCA compliance. Combined, these additional tariffs would raise the effective tariff rate by 2.2 percentage points if they come into effect August 1st, bringing it to 17%, or the highest level in nearly a century (Chart 1).
Investors appear to be taking the latest trade escalation in stride. U.S. equity markets briefly hit a new record high on Thursday, but then retraced on Friday in response to President Trump’s tariff threats on Canada. The S&P 500 looks to end the week 0.4% lower but is still up 6% on the year. Meanwhile, longer-term Treasury yields were a touch higher on the week, despite another healthy 10-year Treasury auction on Wednesday. As of the time of writing, the 10-year sits at 4.41%.
But the recent calm that has descended over global financial markets feels eerily tenuous, particularly amidst the ongoing shifts in trade policy and Q2 earnings season set to kickoff next week. Last quarter, much of the guidance companies were providing was purely speculative, as tariff policies were only in the early stages of being rolled out and were also changing on an almost daily basis. However, now that the tariffs have been in place for some time, companies are likely in a better position to gauge their impact and provide updates to earnings guidance for the second half of the year.
With the inflation impact so far proving more subdued than previously expected, there’s been a growing divide among FOMC members on when to resume rate cuts. Minutes from the June 17-18 meeting released on Wednesday showed that while most committee members favor delaying cuts until there’s more certainty on the inflation and labor market impacts, recent speeches suggest that two board members – Governor Waller and Bowman – support cutting rates as early as July.
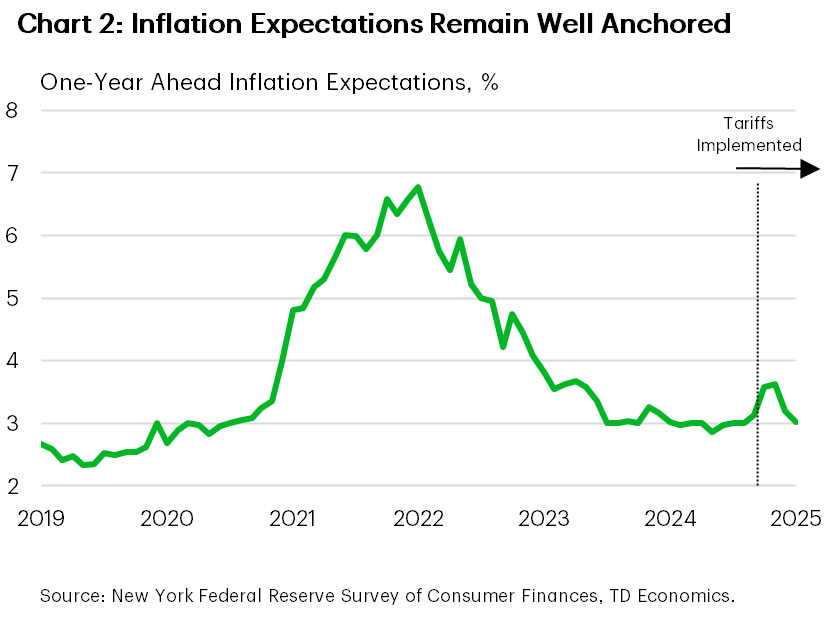
This puts next week’s CPI inflation release under the spotlight. We expect the June CPI report to show inflation having strengthened, with both goods and services price pressures having heated up relative to May. But at this juncture, the uptick is unlikely to unnerve policymakers, particularly with inflation expectations remaining well anchored. According to the New York Fed’s Survey of Consumer Expectations, one-year ahead inflation expectations fell to 3.0% in June – returning to its pre-tariff levels (Chart 2). In our view, this supports the Fed remaining on the sidelines until at least September.
Weekly Economic & Financial Commentary: You Get a Tariff! You Get a Tariff!
Summary
United States: Dog Days of Summer
- While it was a light week on the economic data front, there was still plenty of news to digest with tariffs coming back to center stage. Elevated uncertainty is beginning to creep into economic activity, leading us to revise down our estimate for Q2 real GDP growth.
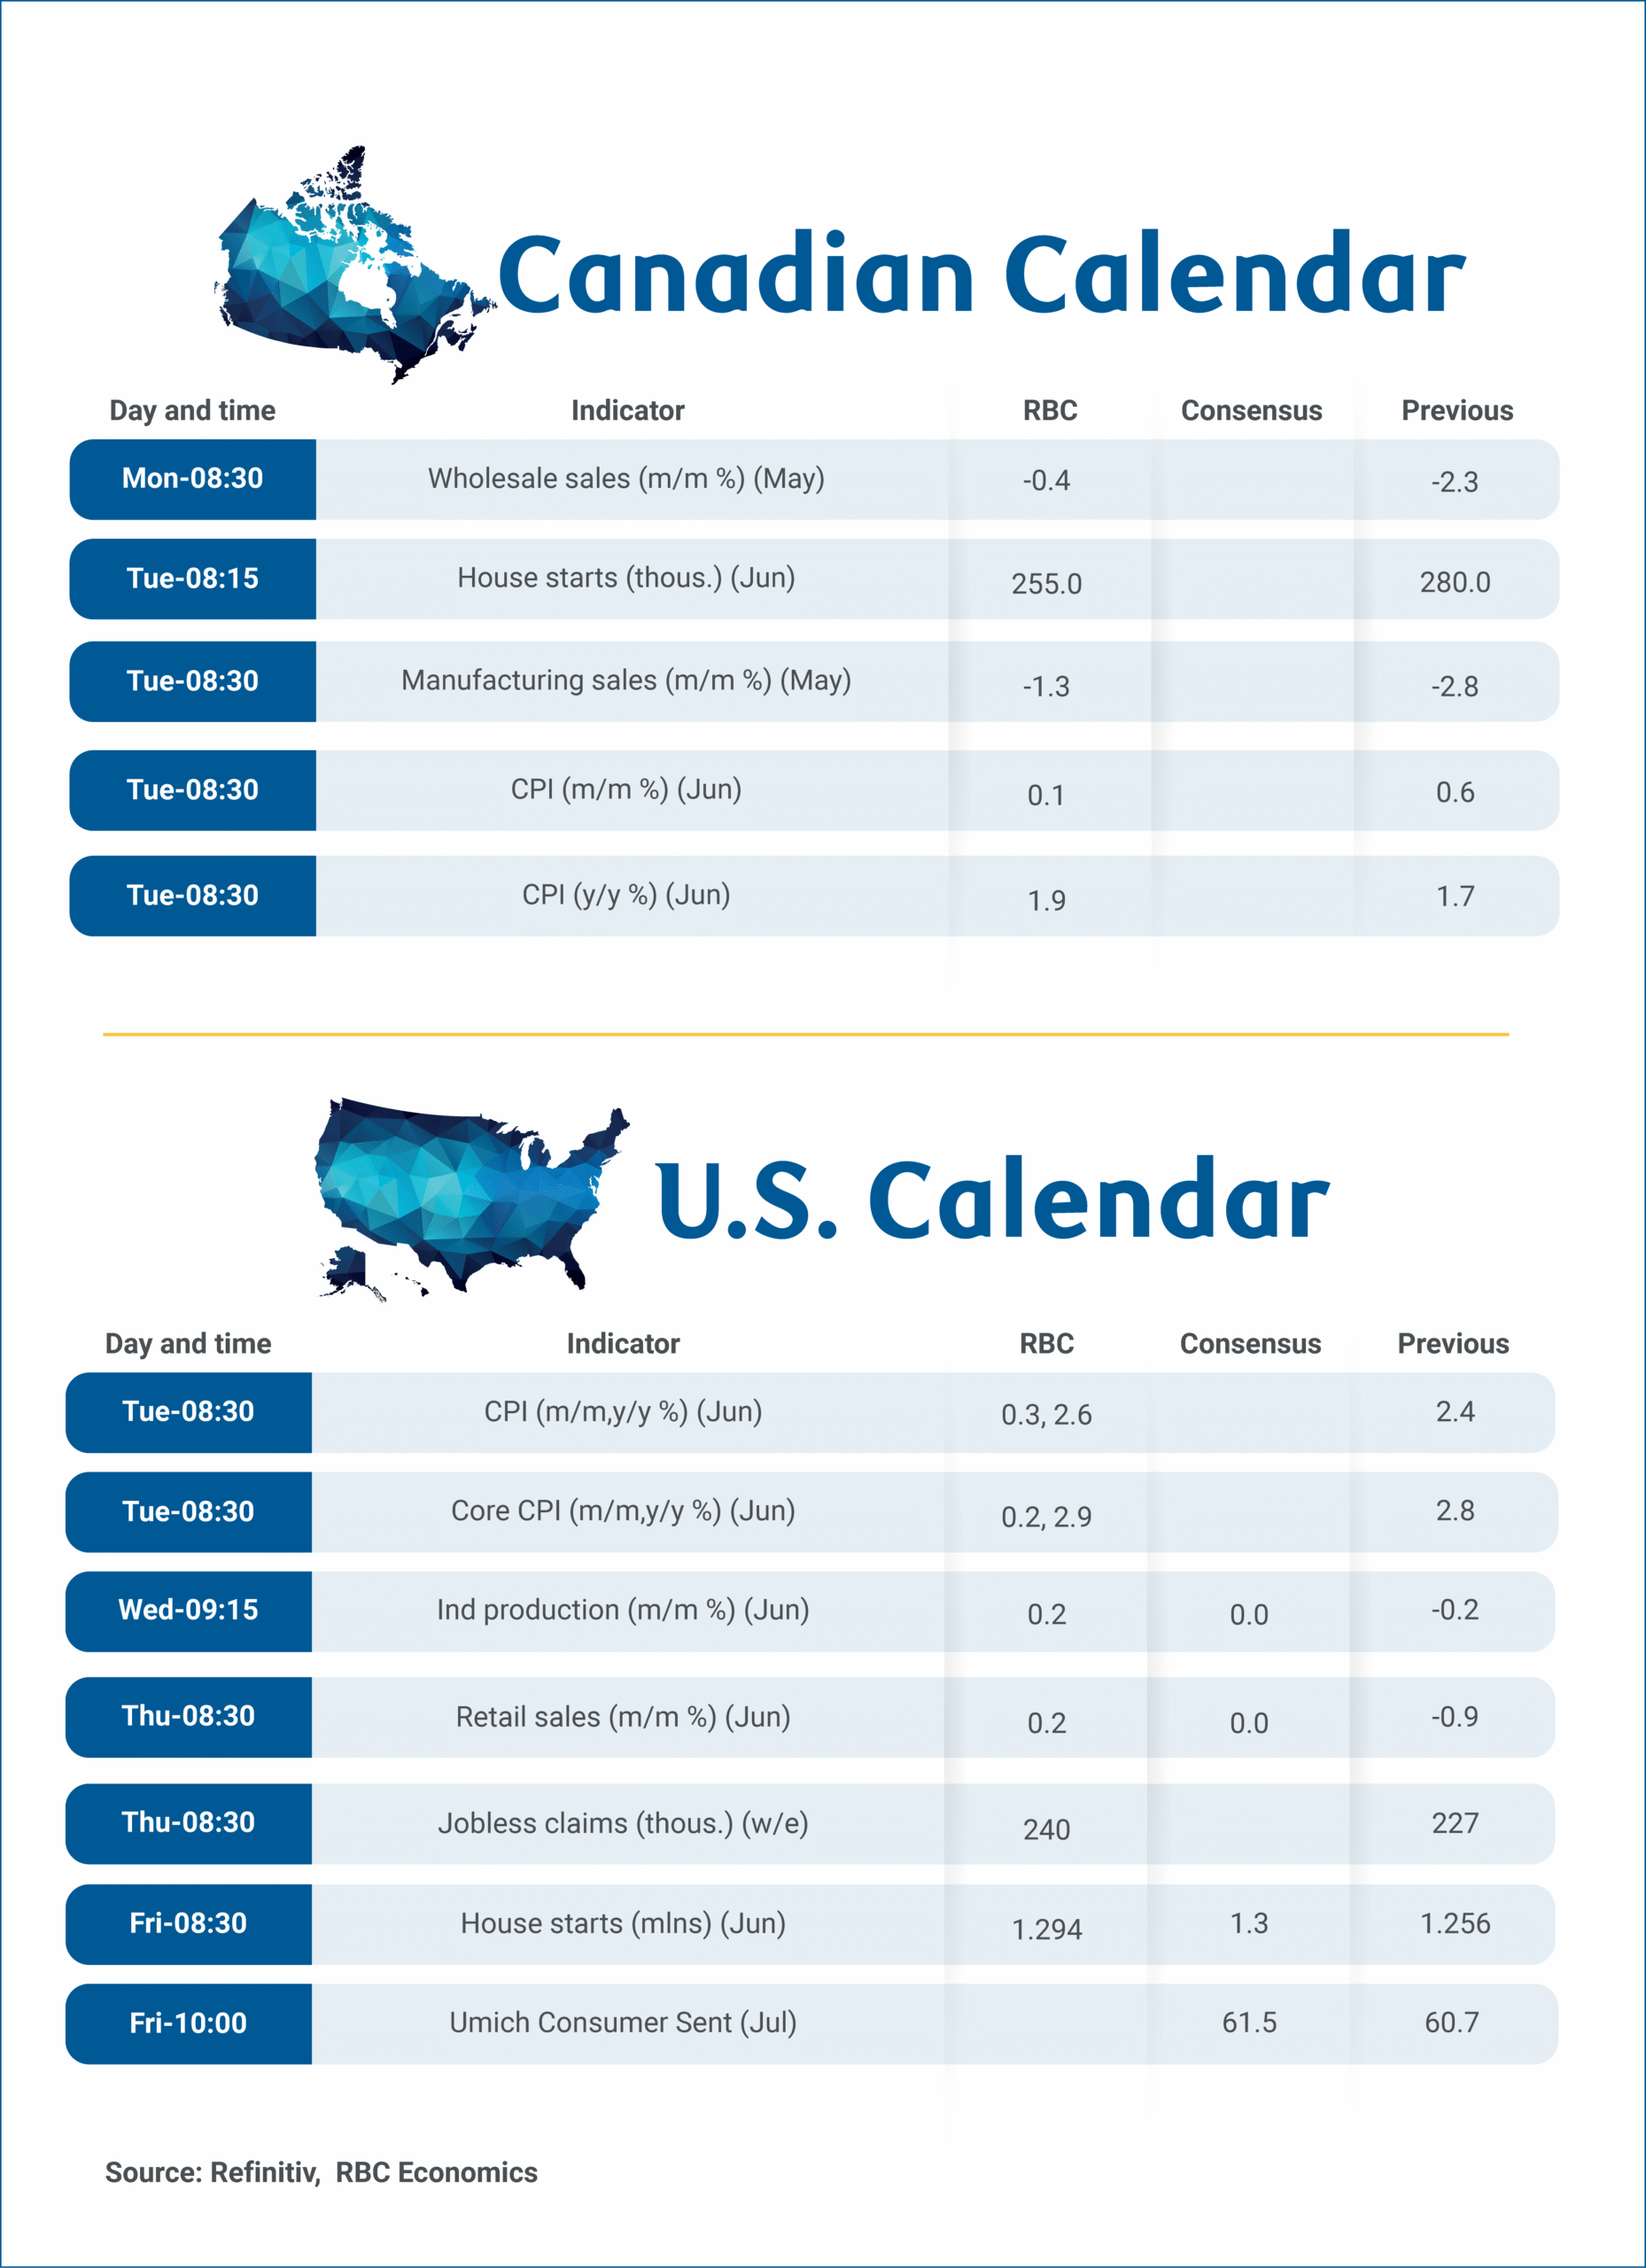
- Next week: CPI (Tue.), Retail Sales (Thu.), Housing Starts (Fri.)
International: Down Under Central Banks Take Rate Cut Time-Outs
- The Reserve Bank of Australia surprised markets by holding its policy rate steady at 3.85% this week, though its accompanying statement and comments suggest an August rate cut remains on course. The Reserve Bank of New Zealand also held rates steady at 3.25% and signaled further easing should be forthcoming. U.K. May GDP was soft, but Canadian June jobs data showed some resilience, while June inflation surprised to the upside in both Mexico and Brazil.
- Next week: China GDP (Tue.), Canada CPI (Tue.), United Kingdom CPI (Wed.)
Interest Rate Watch: FOMC Remains in Wait & See Mode, at Least for Now
- The minutes of the June 17-18 FOMC meeting indicate that the Committee likely will not cut rates at its next meeting at the end of this month. However, we think conditions will warrant a 25 bps rate cut in September.
Topic of the Week: You Get a Tariff! You Get a Tariff!
- In a flurry of tariff announcements this week, President Trump extended the pause on reciprocal rates, upped rates for some countries and brought new sector-level tariffs back into the fold. We summarize these developments and estimate the effect on the U.S. effective tariff rate.
Inflation Watch—Canada’s Consumer Prices to Tick Higher in June after May’s Downside Surprise
We expect it is likely too early to see a significant increase in prices due to tariffs in Canadian and U.S. inflation data for June on Tuesday.
There have been signs of tariffs raising prices for some Canadian food products, and vehicle prices have been climbing steadily since March. But, the broader impact of tariffs on prices has been limited. Canadian retaliatory tariffs announced earlier this year were measured and targeted, and in many cases, have been paused to avoid raising costs for Canadian consumers and producers.
Tariff hikes in the U.S. have been much larger and broader, but data from the U.S. Department of the Treasury suggests tariff revenues collected have lagged tariff announcements in April, but ramped up by 40% in May and another 20% in June. We expect the increases will ultimately raise consumer prices this year, but not right away with pre-tariff inventory building limiting the immediate impact.
Removal of carbon tax continues to distort Canadian CPI growth
For June, we expect a slight increase in the consumer price index to an annual 1.9% following a lower-than-expected 1.7% reading in May.
Gasoline prices edged down 0.9% from May despite a 10% jump in oil prices due to conflict in the Middle East, and were still more than 10% lower from a year ago, reflecting the removal of the consumer carbon tax in April.
Food price inflation—which picked up earlier this year due to higher costs for groceries potentially related to Canadian retaliatory tariffs on imports from the U.S. and dining out—eased slightly in May on an annual basis. We expect this softening to persist in June.
More focus on BoC measures
With tax changes significantly distorting annual price growth, the Bank of Canada’s preferred core inflation metrics (which exclude the impact of indirect tax changes) will continue to be watched closely for signs of changes in underlying trends.
We expect month-over-month increases in the trim and median measures close to the 0.2% increases posted for both in May. That would leave annual rates little changed from May and still significantly above the BoC’s 2% inflation target. Excluding food and energy, inflation is forecast to rise slightly to 2.7% from May’s 2.6%.
U.S. inflation to head higher
In the U.S., rising costs from tariffs will ultimately be paid by U.S. purchasers. But, it will likely be spread across the supply chain from transport companies to wholesalers/manufacturers/retailers with only a portion finally showing up in consumer prices.
We expect year-over-year growth in U.S. consumer prices to rise to 2.6% in June from 2.4% in May on a 0.3% monthly increase from May. We expect core (excluding food and energy products) prices to post a 0.2% increase from May and gain 2.9% from a year ago.
Week ahead data watch:
Canadian manufacturing sales likely dropped again in May, with the largest decreases observed in the petroleum and coal product subsector, the transportation equipment subsector, and the food product subsector. Part of the headline sales decline was price-related, as the IPPI (price of manufactured goods) dipped 0.5% during the month.
We look for Canadian housing starts to come in at 255,000 units in June, down about 9% from the prior month. This decline partially offsets the surge observed at the beginning of this quarter.
We expect the Canadian core wholesale sales to decrease by 0.4% in May, in line with StatsCan’s early indicator, and this was driven by lower sales in the machinery, equipment, and supplies subsector.
U.S. retail sales are expected to have increased by 0.2% in June after dropping 0.9% in May. Higher gasoline prices likely boosted sales at gasoline stations, but unit auto sales edged lower again after an almost 9% drop in May.
A modest recovery in U.S. industrial production is expected for June (+0.2%), bouncing back after a 0.2% decline in May. While the ISM manufacturing index improved during the month, it remained below 50. We anticipate slight improvement in manufacturing (excluding autos) sector output.
Summary 7/14 – 7/18
Monday, Jul 14, 2025
| GMT | Ccy | Events | Consensus | Previous |
|---|---|---|---|---|
| 22:30 | NZD | Business NZ PSI Jun | 44 | |
| 23:50 | JPY | Machinery Orders M/M May | -1.40% | -9.10% |
| 03:00 | CNY | Trade Balance (USD) Jun | 113.2B | 103.2B |
| 04:30 | JPY | Tertiary Industry Index M/M May | 0.10% | 0.30% |
| 04:30 | JPY | Industrial Production M/M May F | 0.50% | 0.50% |
| 06:30 | CHF | PPI M/M Jun | 0.20% | -0.50% |
| 06:30 | CHF | PPI Y/Y Jun | -0.70% | |
| 12:30 | CAD | Wholesale Sales M/M May | -0.40% | -2.30% |
| GMT | Ccy | Events | |
|---|---|---|---|
| 22:30 | NZD | Business NZ PSI Jun | |
| Forecast: | Previous: 44 | ||
| 23:50 | JPY | Machinery Orders M/M May | |
| Forecast: -1.40% | Previous: -9.10% | ||
| 03:00 | CNY | Trade Balance (USD) Jun | |
| Forecast: 113.2B | Previous: 103.2B | ||
| 04:30 | JPY | Tertiary Industry Index M/M May | |
| Forecast: 0.10% | Previous: 0.30% | ||
| 04:30 | JPY | Industrial Production M/M May F | |
| Forecast: 0.50% | Previous: 0.50% | ||
| 06:30 | CHF | PPI M/M Jun | |
| Forecast: 0.20% | Previous: -0.50% | ||
| 06:30 | CHF | PPI Y/Y Jun | |
| Forecast: | Previous: -0.70% | ||
| 12:30 | CAD | Wholesale Sales M/M May | |
| Forecast: -0.40% | Previous: -2.30% | ||
Tuesday, Jul 15, 2025
| GMT | Ccy | Events | Consensus | Previous |
|---|---|---|---|---|
| 00:30 | AUD | Westpac Consumer Confidence Jul | 0.50% | |
| 02:00 | CNY | GDP Y/Y Q2 | 5.10% | 5.40% |
| 02:00 | CNY | Industrial Production Y/Y Jun | 5.60% | 5.80% |
| 02:00 | CNY | Retail Sales Y/Y Jun | 5.20% | 6.40% |
| 02:00 | CNY | Fixed Asset Investment (YTD) Y/Y Jun | 3.70% | 3.70% |
| 09:00 | EUR | Eurozone Industrial Production M/M May | 0.60% | -2.40% |
| 09:00 | EUR | Germany ZEW Economic Sentiment Jul | 50.2 | 47.5 |
| 09:00 | EUR | Germany ZEW Current Situation Jul | -66 | -72 |
| 09:00 | EUR | Eurozone ZEW Economic Sentiment Jul | 37.8 | 35.3 |
| 12:30 | CAD | Manufacturing Sales M/M May | -1.30% | -2.80% |
| 12:30 | CAD | CPI M/M Jun | 0.20% | 0.60% |
| 12:30 | CAD | CPI Y/Y Jun | 1.70% | |
| 12:30 | CAD | CPI Median YY/Y Jun | 3.00% | 3.00% |
| 12:30 | CAD | CPI Trimmed Y/Y Jun | 3.00% | 3.00% |
| 12:30 | CAD | CPI Common Y/Y Jun | 2.70% | 2.60% |
| 12:30 | USD | Empire State Manufacturing Index Jul | -10.1 | -16 |
| 12:30 | USD | CPI M/M Jun | 0.30% | 0.10% |
| 12:30 | USD | CPI Y/Y Jun | 2.60% | 2.40% |
| 12:30 | USD | CPI Core M/M Jun | 0.30% | 0.10% |
| 12:30 | USD | CPI Core Y/Y Jun | 2.80% |
| GMT | Ccy | Events | |
|---|---|---|---|
| 00:30 | AUD | Westpac Consumer Confidence Jul | |
| Forecast: | Previous: 0.50% | ||
| 02:00 | CNY | GDP Y/Y Q2 | |
| Forecast: 5.10% | Previous: 5.40% | ||
| 02:00 | CNY | Industrial Production Y/Y Jun | |
| Forecast: 5.60% | Previous: 5.80% | ||
| 02:00 | CNY | Retail Sales Y/Y Jun | |
| Forecast: 5.20% | Previous: 6.40% | ||
| 02:00 | CNY | Fixed Asset Investment (YTD) Y/Y Jun | |
| Forecast: 3.70% | Previous: 3.70% | ||
| 09:00 | EUR | Eurozone Industrial Production M/M May | |
| Forecast: 0.60% | Previous: -2.40% | ||
| 09:00 | EUR | Germany ZEW Economic Sentiment Jul | |
| Forecast: 50.2 | Previous: 47.5 | ||
| 09:00 | EUR | Germany ZEW Current Situation Jul | |
| Forecast: -66 | Previous: -72 | ||
| 09:00 | EUR | Eurozone ZEW Economic Sentiment Jul | |
| Forecast: 37.8 | Previous: 35.3 | ||
| 12:30 | CAD | Manufacturing Sales M/M May | |
| Forecast: -1.30% | Previous: -2.80% | ||
| 12:30 | CAD | CPI M/M Jun | |
| Forecast: 0.20% | Previous: 0.60% | ||
| 12:30 | CAD | CPI Y/Y Jun | |
| Forecast: | Previous: 1.70% | ||
| 12:30 | CAD | CPI Median YY/Y Jun | |
| Forecast: 3.00% | Previous: 3.00% | ||
| 12:30 | CAD | CPI Trimmed Y/Y Jun | |
| Forecast: 3.00% | Previous: 3.00% | ||
| 12:30 | CAD | CPI Common Y/Y Jun | |
| Forecast: 2.70% | Previous: 2.60% | ||
| 12:30 | USD | Empire State Manufacturing Index Jul | |
| Forecast: -10.1 | Previous: -16 | ||
| 12:30 | USD | CPI M/M Jun | |
| Forecast: 0.30% | Previous: 0.10% | ||
| 12:30 | USD | CPI Y/Y Jun | |
| Forecast: 2.60% | Previous: 2.40% | ||
| 12:30 | USD | CPI Core M/M Jun | |
| Forecast: 0.30% | Previous: 0.10% | ||
| 12:30 | USD | CPI Core Y/Y Jun | |
| Forecast: | Previous: 2.80% | ||
Wednesday, Jul 16, 2025
| GMT | Ccy | Events | Consensus | Previous |
|---|---|---|---|---|
| 06:00 | GBP | CPI M/M Jun | 0.20% | |
| 06:00 | GBP | CPI Y/Y Jun | 3.40% | 3.40% |
| 06:00 | GBP | Core CPI Y/Y Jun | 3.50% | 3.50% |
| 06:00 | GBP | RPI M/M Jun | 0.20% | |
| 06:00 | GBP | RPI Y/Y Jun | 4.30% | 4.30% |
| 09:00 | EUR | Eurozone Trade Balance (EUR) May | 12.0B | 14.0B |
| 12:30 | USD | PPI M/M Jun | 0.30% | 0.10% |
| 12:30 | USD | PPI Y/Y Jun | 2.60% | |
| 12:30 | USD | PPI Core M/M Jun | 0.20% | 0.10% |
| 12:30 | USD | PPI Core Y/Y Jun | 3% | |
| 13:15 | USD | Industrial Production M/M Jun | 0.00% | -0.20% |
| 13:15 | USD | Capacity Utilization Jun | 77.40% | 77.40% |
| 14:30 | USD | Crude Oil Inventories | 7.1M | |
| 18:00 | USD | Fed's Beige Book | ||
| 23:50 | JPY | Trade Balance (JPY) Jun | -0.26T | -0.31T |
| GMT | Ccy | Events | |
|---|---|---|---|
| 06:00 | GBP | CPI M/M Jun | |
| Forecast: | Previous: 0.20% | ||
| 06:00 | GBP | CPI Y/Y Jun | |
| Forecast: 3.40% | Previous: 3.40% | ||
| 06:00 | GBP | Core CPI Y/Y Jun | |
| Forecast: 3.50% | Previous: 3.50% | ||
| 06:00 | GBP | RPI M/M Jun | |
| Forecast: | Previous: 0.20% | ||
| 06:00 | GBP | RPI Y/Y Jun | |
| Forecast: 4.30% | Previous: 4.30% | ||
| 09:00 | EUR | Eurozone Trade Balance (EUR) May | |
| Forecast: 12.0B | Previous: 14.0B | ||
| 12:30 | USD | PPI M/M Jun | |
| Forecast: 0.30% | Previous: 0.10% | ||
| 12:30 | USD | PPI Y/Y Jun | |
| Forecast: | Previous: 2.60% | ||
| 12:30 | USD | PPI Core M/M Jun | |
| Forecast: 0.20% | Previous: 0.10% | ||
| 12:30 | USD | PPI Core Y/Y Jun | |
| Forecast: | Previous: 3% | ||
| 13:15 | USD | Industrial Production M/M Jun | |
| Forecast: 0.00% | Previous: -0.20% | ||
| 13:15 | USD | Capacity Utilization Jun | |
| Forecast: 77.40% | Previous: 77.40% | ||
| 14:30 | USD | Crude Oil Inventories | |
| Forecast: | Previous: 7.1M | ||
| 18:00 | USD | Fed's Beige Book | |
| Forecast: | Previous: | ||
| 23:50 | JPY | Trade Balance (JPY) Jun | |
| Forecast: -0.26T | Previous: -0.31T | ||
Thursday, Jul 17, 2025
| GMT | Ccy | Events | Consensus | Previous |
|---|---|---|---|---|
| 01:00 | AUD | Consumer Inflation Expectations Jul | 5% | |
| 01:30 | AUD | NAB Business Confidence Q2 | -4 | |
| 01:30 | AUD | Employment Change Jun | 21.0K | -2.5K |
| 01:30 | AUD | Unemployment Rate Jun | 4.10% | 4.10% |
| 06:00 | CHF | Trade Balance (CHF) Jun | 4.22B | 3.83B |
| 06:00 | GBP | Claimant Count Change Jun | 17.9K | 33.1K |
| 06:00 | GBP | ILO Unemployment Rate (3M) May | 4.60% | 4.60% |
| 06:00 | GBP | Average Earnings Including Bonus 3M/Y May | 5.00% | 5.30% |
| 06:00 | GBP | Average Earnings Excluding Bonus 3M/Y May | 5.20% | |
| 09:00 | EUR | Eurozone CPI Y/Y Jun F | 2.00% | 2.00% |
| 09:00 | EUR | Eurozone CPI Core Y/Y Jun F | 2.30% | 2.30% |
| 12:30 | USD | Initial Jobless Claims (Jul 11) | 234K | 227K |
| 12:30 | USD | Retail Sales M/M Jun | 0.20% | -0.90% |
| 12:30 | USD | Retail Sales ex Autos M/M Jun | 0.30% | -0.30% |
| 12:30 | USD | Initial Jobless Claims 4-week average (Jul 11) | 235.5K | |
| 12:30 | USD | Import Price Index M/M Jun | 0.20% | 0.00% |
| 12:30 | USD | Philadelphia Fed Survey Jul | 0.4 | -4 |
| 14:00 | USD | Business Inventories May | 0.20% | 0.00% |
| 14:00 | USD | NAHB Housing Market Index Jul | 33 | 32 |
| 14:30 | USD | Natural Gas Storage | 53B | |
| 23:30 | JPY | National CPI Y/Y Jun | 3.50% | |
| 23:30 | JPY | National CPI Core Y/Y Jun | 3.30% | 3.70% |
| 23:30 | JPY | National CPI Core-Core Y/Y Jun | 3.30% |
| GMT | Ccy | Events | |
|---|---|---|---|
| 01:00 | AUD | Consumer Inflation Expectations Jul | |
| Forecast: | Previous: 5% | ||
| 01:30 | AUD | NAB Business Confidence Q2 | |
| Forecast: | Previous: -4 | ||
| 01:30 | AUD | Employment Change Jun | |
| Forecast: 21.0K | Previous: -2.5K | ||
| 01:30 | AUD | Unemployment Rate Jun | |
| Forecast: 4.10% | Previous: 4.10% | ||
| 06:00 | CHF | Trade Balance (CHF) Jun | |
| Forecast: 4.22B | Previous: 3.83B | ||
| 06:00 | GBP | Claimant Count Change Jun | |
| Forecast: 17.9K | Previous: 33.1K | ||
| 06:00 | GBP | ILO Unemployment Rate (3M) May | |
| Forecast: 4.60% | Previous: 4.60% | ||
| 06:00 | GBP | Average Earnings Including Bonus 3M/Y May | |
| Forecast: 5.00% | Previous: 5.30% | ||
| 06:00 | GBP | Average Earnings Excluding Bonus 3M/Y May | |
| Forecast: | Previous: 5.20% | ||
| 09:00 | EUR | Eurozone CPI Y/Y Jun F | |
| Forecast: 2.00% | Previous: 2.00% | ||
| 09:00 | EUR | Eurozone CPI Core Y/Y Jun F | |
| Forecast: 2.30% | Previous: 2.30% | ||
| 12:30 | USD | Initial Jobless Claims (Jul 11) | |
| Forecast: 234K | Previous: 227K | ||
| 12:30 | USD | Retail Sales M/M Jun | |
| Forecast: 0.20% | Previous: -0.90% | ||
| 12:30 | USD | Retail Sales ex Autos M/M Jun | |
| Forecast: 0.30% | Previous: -0.30% | ||
| 12:30 | USD | Initial Jobless Claims 4-week average (Jul 11) | |
| Forecast: | Previous: 235.5K | ||
| 12:30 | USD | Import Price Index M/M Jun | |
| Forecast: 0.20% | Previous: 0.00% | ||
| 12:30 | USD | Philadelphia Fed Survey Jul | |
| Forecast: 0.4 | Previous: -4 | ||
| 14:00 | USD | Business Inventories May | |
| Forecast: 0.20% | Previous: 0.00% | ||
| 14:00 | USD | NAHB Housing Market Index Jul | |
| Forecast: 33 | Previous: 32 | ||
| 14:30 | USD | Natural Gas Storage | |
| Forecast: | Previous: 53B | ||
| 23:30 | JPY | National CPI Y/Y Jun | |
| Forecast: | Previous: 3.50% | ||
| 23:30 | JPY | National CPI Core Y/Y Jun | |
| Forecast: 3.30% | Previous: 3.70% | ||
| 23:30 | JPY | National CPI Core-Core Y/Y Jun | |
| Forecast: | Previous: 3.30% | ||
Friday, Jul 18, 2025
| GMT | Ccy | Events | Consensus | Previous |
|---|---|---|---|---|
| 06:00 | EUR | Germany PPI M/M Jun | 0.10% | -0.20% |
| 06:00 | EUR | Germany PPI Y/Y Jun | -1.20% | |
| 08:00 | EUR | Eurozone Current Account (EUR) May | 19.8B | |
| 12:30 | USD | Housing Starts Jun | 1.29M | 1.26M |
| 12:30 | USD | Building Permits Jun | 1.39M | 1.39M |
| 14:00 | USD | Michigan Consumer Sentiment Jul P | 61.5 | 60.7 |
| 14:00 | USD | UoM 1-year Inflation Expectations Jul P | 5.0% |
| GMT | Ccy | Events | |
|---|---|---|---|
| 06:00 | EUR | Germany PPI M/M Jun | |
| Forecast: 0.10% | Previous: -0.20% | ||
| 06:00 | EUR | Germany PPI Y/Y Jun | |
| Forecast: | Previous: -1.20% | ||
| 08:00 | EUR | Eurozone Current Account (EUR) May | |
| Forecast: | Previous: 19.8B | ||
| 12:30 | USD | Housing Starts Jun | |
| Forecast: 1.29M | Previous: 1.26M | ||
| 12:30 | USD | Building Permits Jun | |
| Forecast: 1.39M | Previous: 1.39M | ||
| 14:00 | USD | Michigan Consumer Sentiment Jul P | |
| Forecast: 61.5 | Previous: 60.7 | ||
| 14:00 | USD | UoM 1-year Inflation Expectations Jul P | |
| Forecast: | Previous: 5.0% | ||
Week Ahead – A Storm of CPI Data and China’s GDP in Focus Amid Trade Uncertainty
- Dollar attracts safe haven flows amid trade anxiety.
- US inflation data could shake July Fed cut probability.
- UK, Canadian and Japanese CPI numbers also on tap.
- Weak Chinese growth may increase calls for more stimulus.
Dollar reacts differently to tariff concerns now
The dollar has held very well against its major peers this week, although it is still down since April 2, when US President Turmp announced reciprocal tariffs against all the US’s main trading partners, before postponing them and keeping only a 10% base duty.
Although the 90-day delay, which was supposed to expire on Wednesday, was extended until August 1, Trump said this week that he would impose a 25% tariff on goods from Japan and South Korea, while he threatened Brazil with a 50% levy, and other partners with lower rates. This allowed the US dollar to stay strong due to safe-haven inflows.
This marks a shift in how the dollar responds to tariff-related anxiety. Back in April, it was hurt due to fears about a recession. Now, it is benefiting as a safe haven, while upside risks to inflation are adding further momentum. A few weeks ago, investors were penciling in 65bps worth of rate cuts by the Fed, with the probability of a July reduction rising as a couple of policymakers expressed clear support for such a move, while Fed Chair Powell did not rule it out when testifying before Congress.
Nonetheless, following the better-than-expected jobs data for June and Trump’s fresh tariff-related threats, the probability of a July cut dropped to 5%, while markets now price in 50bps of easing this year - fully alighned with the Fed's latest dot plot.
Inflation cooling could revive July Fed cut bets
Next week, investors will keep their gaze locked on tariff-related headlines, but they will also have to evaluate the US CPI data for June. According to the ISM PMIs, prices in the manufacturing sector accelerated somewhat, but the non-manufacturing prices subindex slid notably. Given that the manufacturing sector accounts for only 10% of US GDP, the risks to CPI appear tilted to the downside. A slowdown in inflation may allow some market participants to reopen the door to the possibility of a July rate cut, which in turn could end the latest recovery in the US dollar.
The US PPI numbers for June will be released on Wednesday, while on Thursday, retail sales data for the same month will be released. The preliminary University of Michigan consumer sentiment survey for July on Friday could also attract special attention as it includes the closely watched 1-year inflation expectations print. The year-over-year rate of that metric surged to 6.6% in May, but it slipped to 5% in June. Further cooling could add credence to the idea that the upside risks to inflation are not that prominent and may allow the dollar to retreat a bit more.
UK CPI data awaited as BoE seen cutting in August
Speaking of inflation, the UK will also release its CPI numbers for June on Wednesday. At its latest decision, the Bank of England held interest rates unchanged, but the outcome was slightly more dovish than expected. Six out of nine policymakers voted to hold interest rates unchanged, with the remaining three opting for a 25bps reduction.
The Bank noted that GDP growth remained weak and that the labor market has continued to loosen, leading to clearer signs that a margin of slack has appeared. This led investors to add to their rate cut bets, now assigning a nearly 77% chance of a 25bps reduction at the upcoming meeting, in August. Another one is fully priced in by the end of the year.
Although the BoE expects inflation to continue accelerating to 3.7% y/y this year due to higher energy prices and some regulatory price increases, such as water utility bills, the Bank noted that the risks to inflation remain two-sided. Thus, even if the data reveals some acceleration, rate cut bets are unlikely to vanish. Perhaps traders will decide to take a few basis points off the table, but nothing too dramatic. On the other hand, a notable slowdown could give another green light to policymakers to lower interest rates in August, likely weighing on the British pound.
The UK employment report for May will be coming out on Thursday and will provide more information about whether the labor market is indeed cooling or not.
Canadian and Japanese inflation figures also on tap
More CPI data is on deck next week, with releases from Canada on Tuesday and Japan on Thursday. Getting the ball rolling with Canada, the BoC is expected to deliver one more quarter-point rate reduction this year, and with headline inflation already dropping to 1.7% in June, a very strong acceleration may be needed for the cut to be pushed into 2026. As for Japan, sticky inflation may allow yen traders to start reconsidering the likelihood of a BoJ rate hike before the turn of the year instead of the first quarter of 2026.
China releases trade and growth data amid trade uncertainty
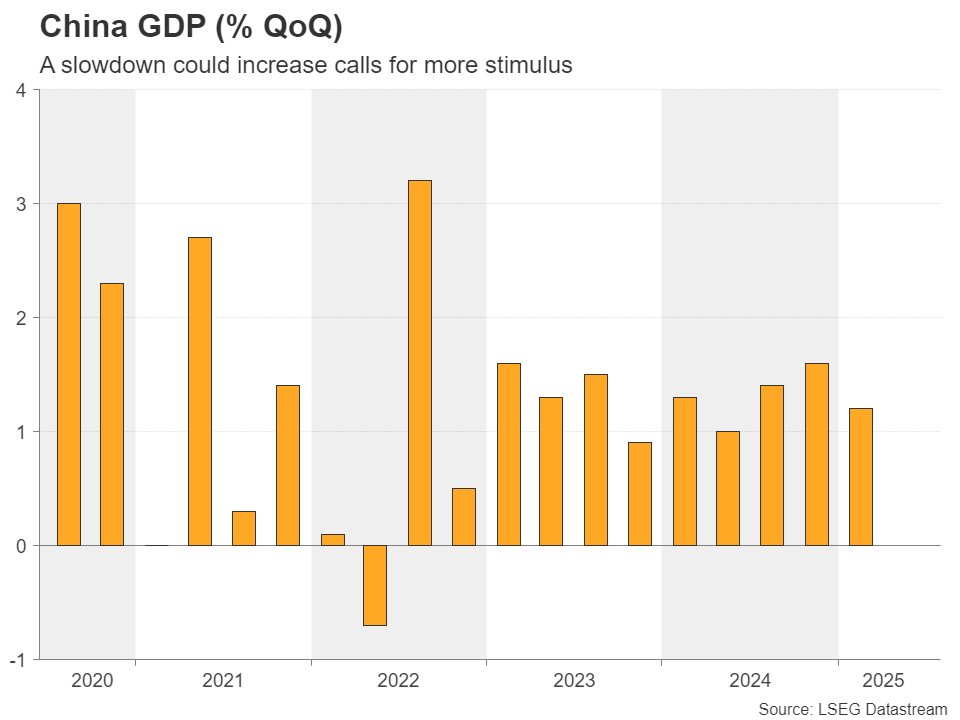
China will also be in the spotlight. On Monday, the world’s second largest economy will release trade data for June, while on Tuesday, the GDP for Q2 will be released alongside industrial production, retail sales and the unemployment rate, all for June.
The latest inflation data revealed that producer prices fell at a faster pace in June than in May, with deflation deepening to its worst level in almost two years. Although consumer prices accelerated for the first time in five months, the improvement was marginal, with the broader picture increasing pressure on Chinese policymakers to introduce more stimulatory measures.
Despite China's agreement with the US to pursue further trade talks, lingering uncertainty over global trade is dampening local demand, and should next week’s data corroborate the notion that the Chinese economy is struggling, the People’s Bank of China may need to cut rates further later this year. Such expectations could weigh on the aussie and kiwi, as China is the main trading partner of both Australia and New Zealand.
Aussie traders will have to digest Australia’s employment report for June, which is scheduled to be released during the Asian session on Wednesday.
Earnings season begins
Equity traders will be busier next week as the Q2 earnings season will kick off, with the big banks reporting on Tuesday and Wednesday. That said, the spotlight is likely to fall on Netflix, which announces results on Thursday. With the streaming giant’s stock hitting record highs around ten days ago, results may need to be astounding for the stock to stretch its prevailing uptrend.
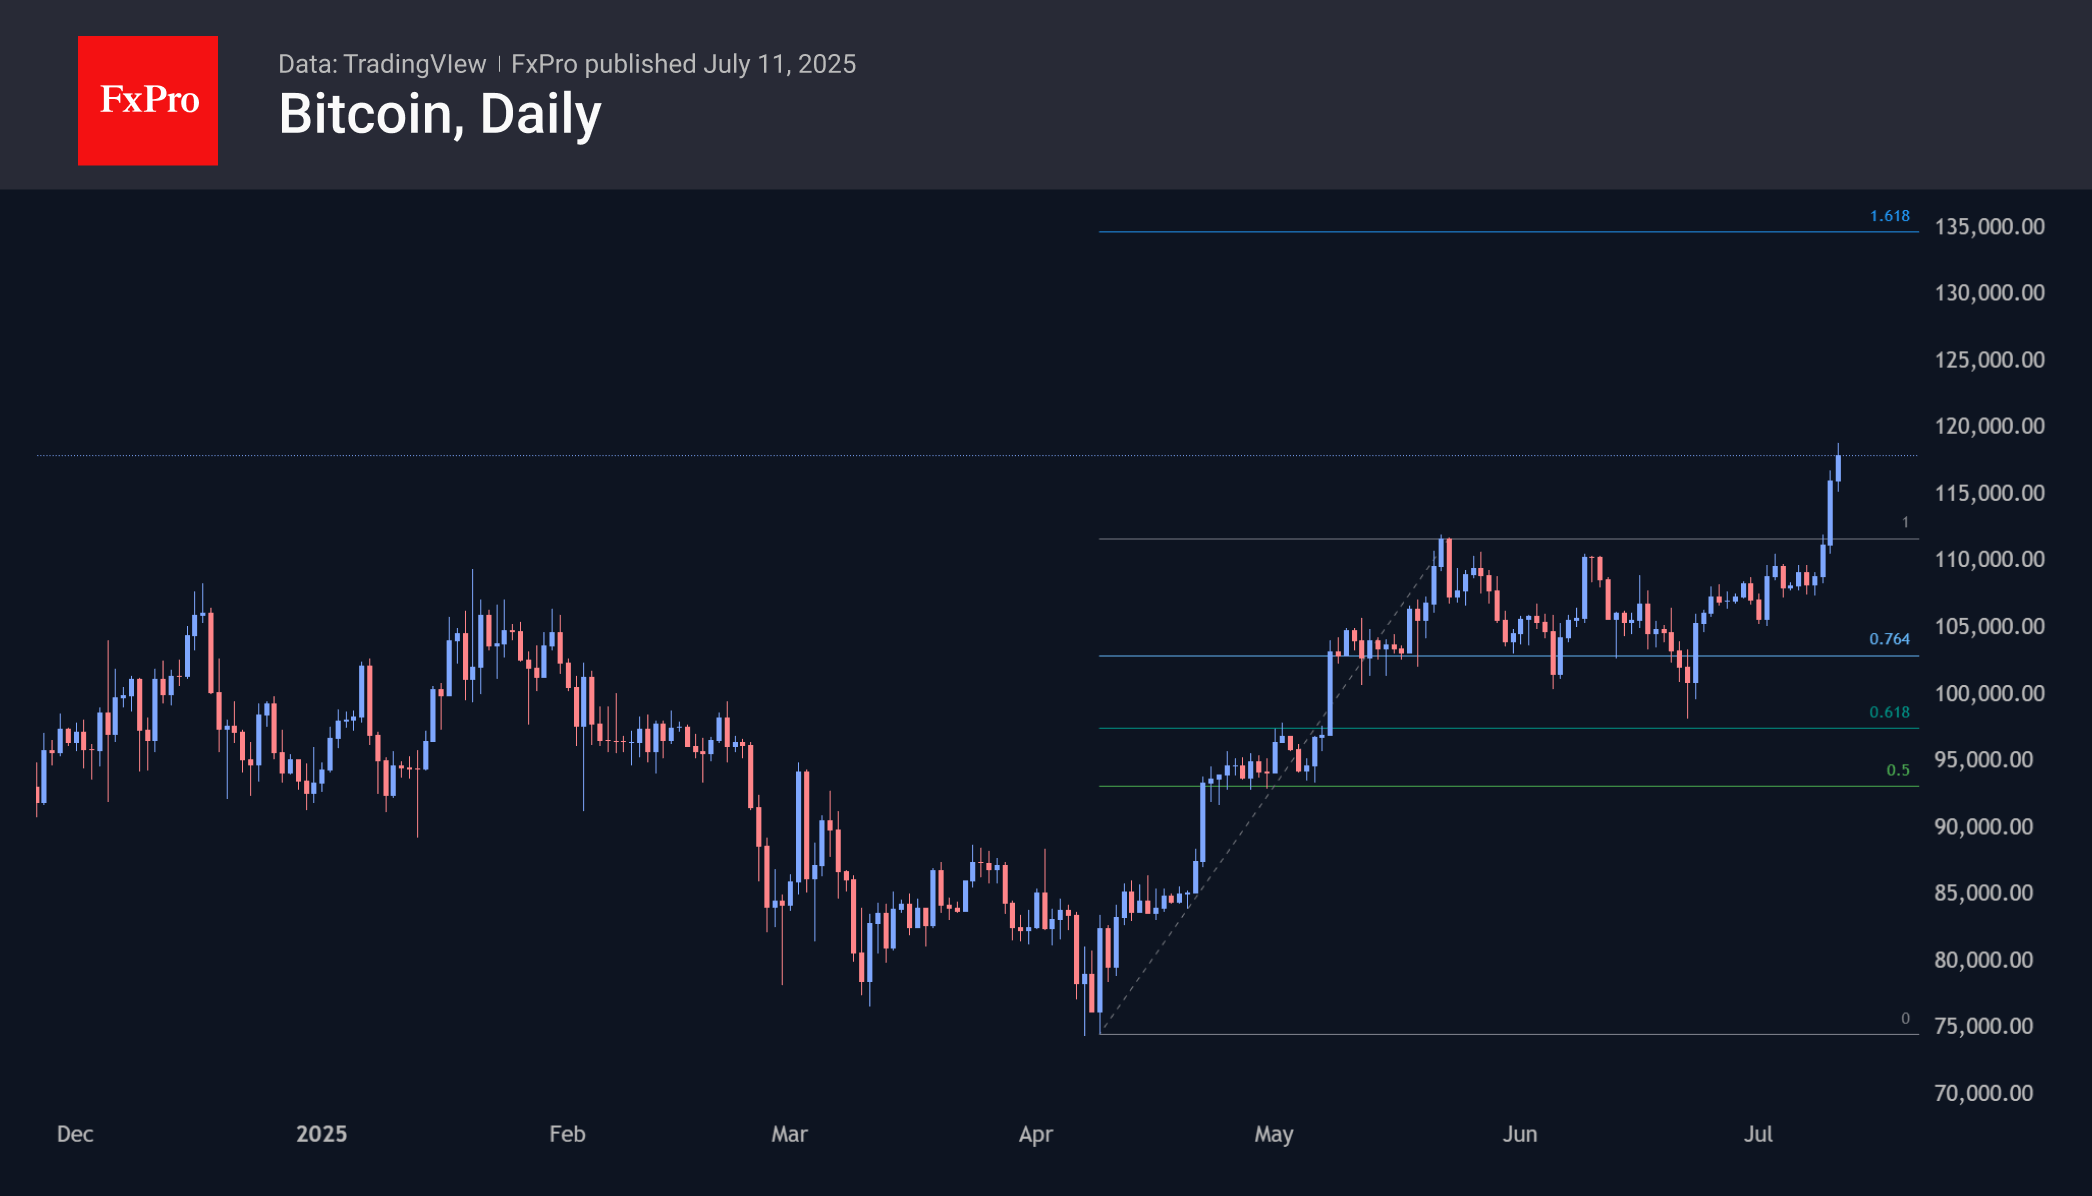
Bitcoin Breaks Records, Broad Market Just Joining the Rally
Market Overview
The crypto market capitalisation is at $3.66 trillion, having jumped 5.7% in the last 24 hours and approaching the record high of $3.72 trillion set in December. Risk appetite in the stock markets and Bitcoin’s record highs have drawn a wider range of altcoins into the rally, which have begun to catch up with the flagship.
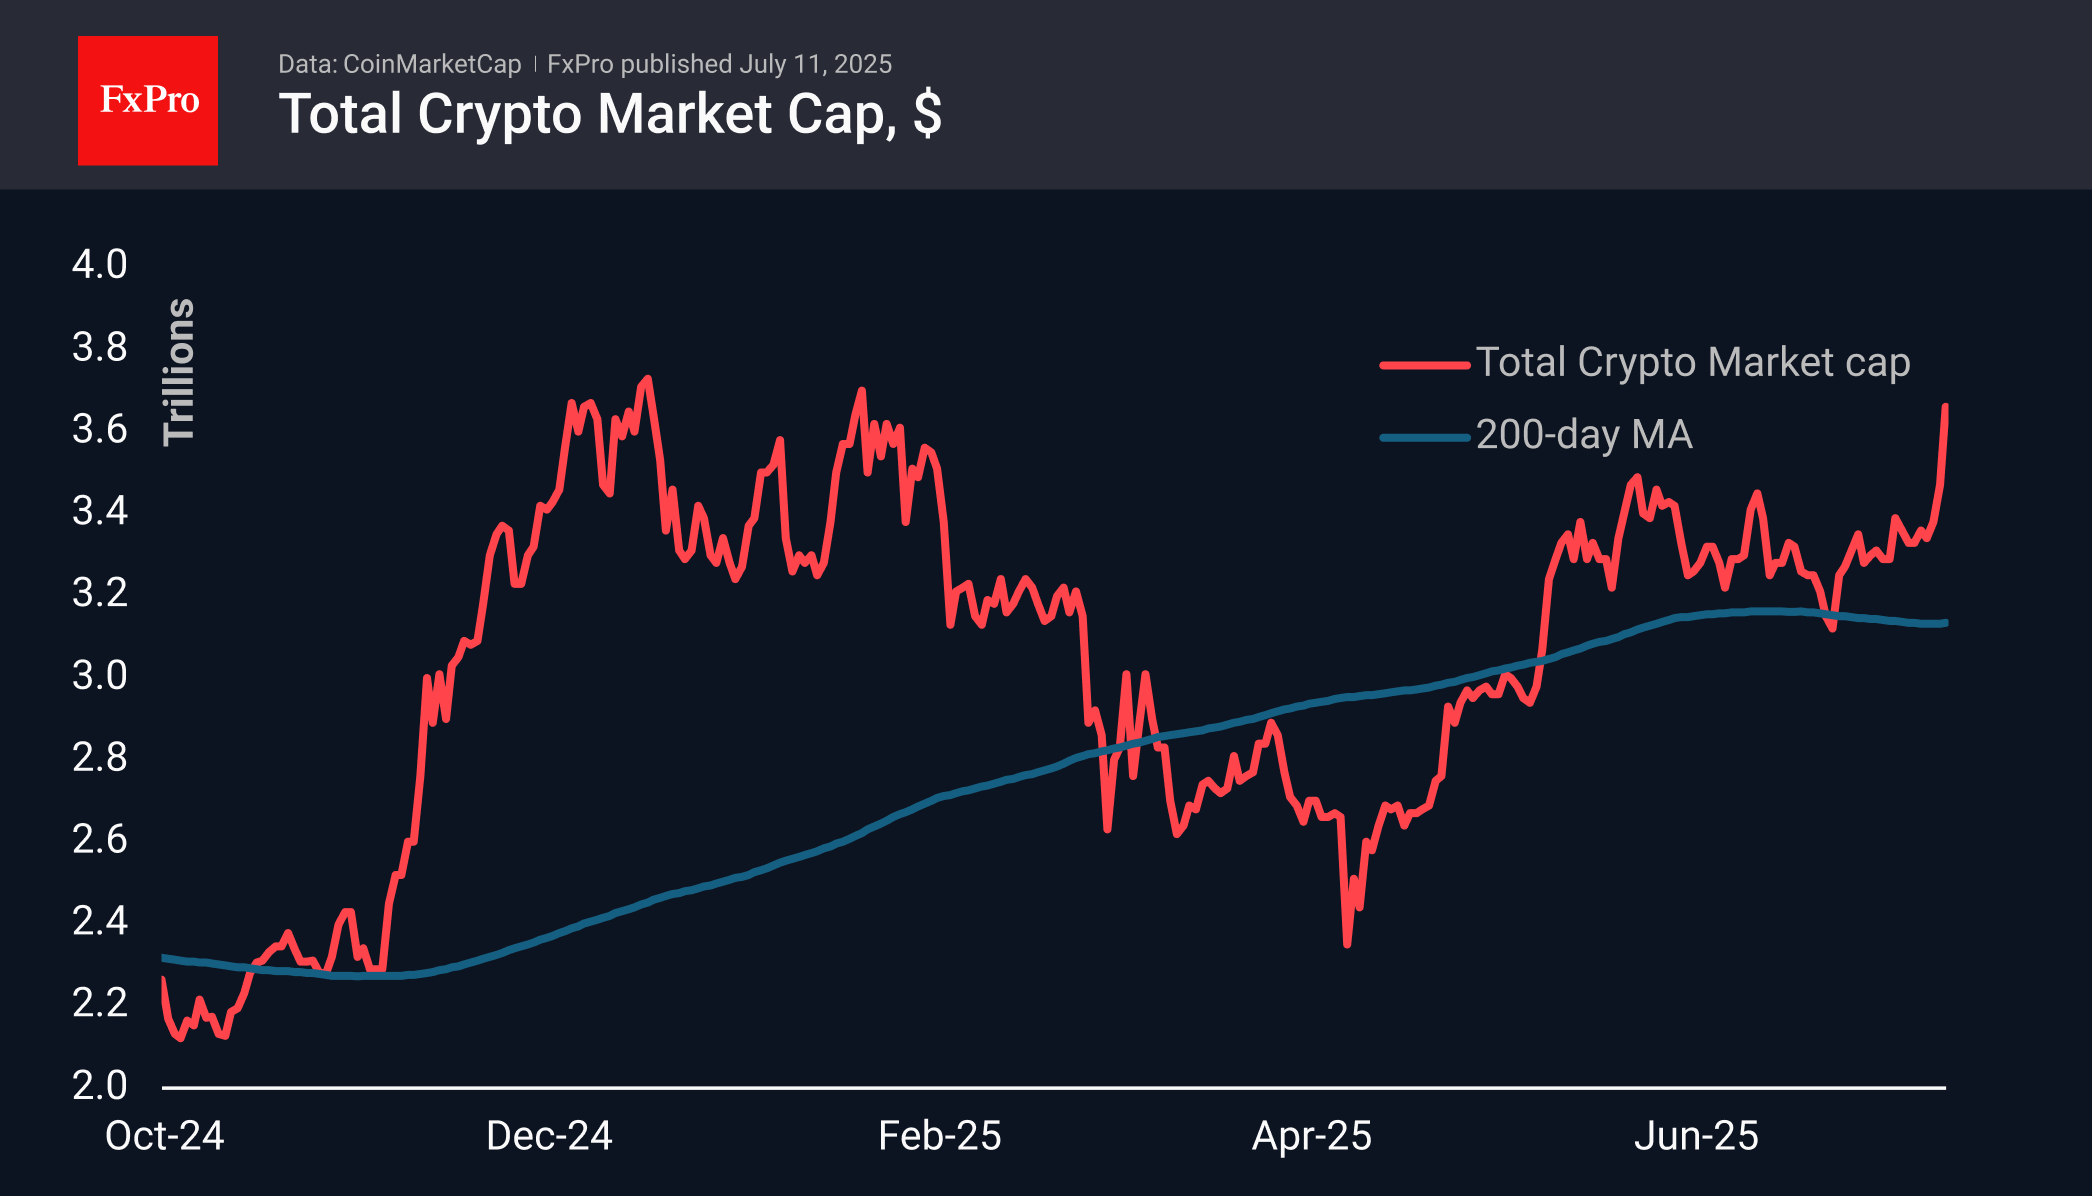
Bitcoin exceeded the $118K mark for the first time in history, thanks to capital inflows into specialised exchange-traded funds and demand from companies accumulating cryptocurrency. BTCUSD was supported by improved global risk appetite. In the short term, the chances of the bulls continuing the rally look high, with a technical growth target above 135,000.
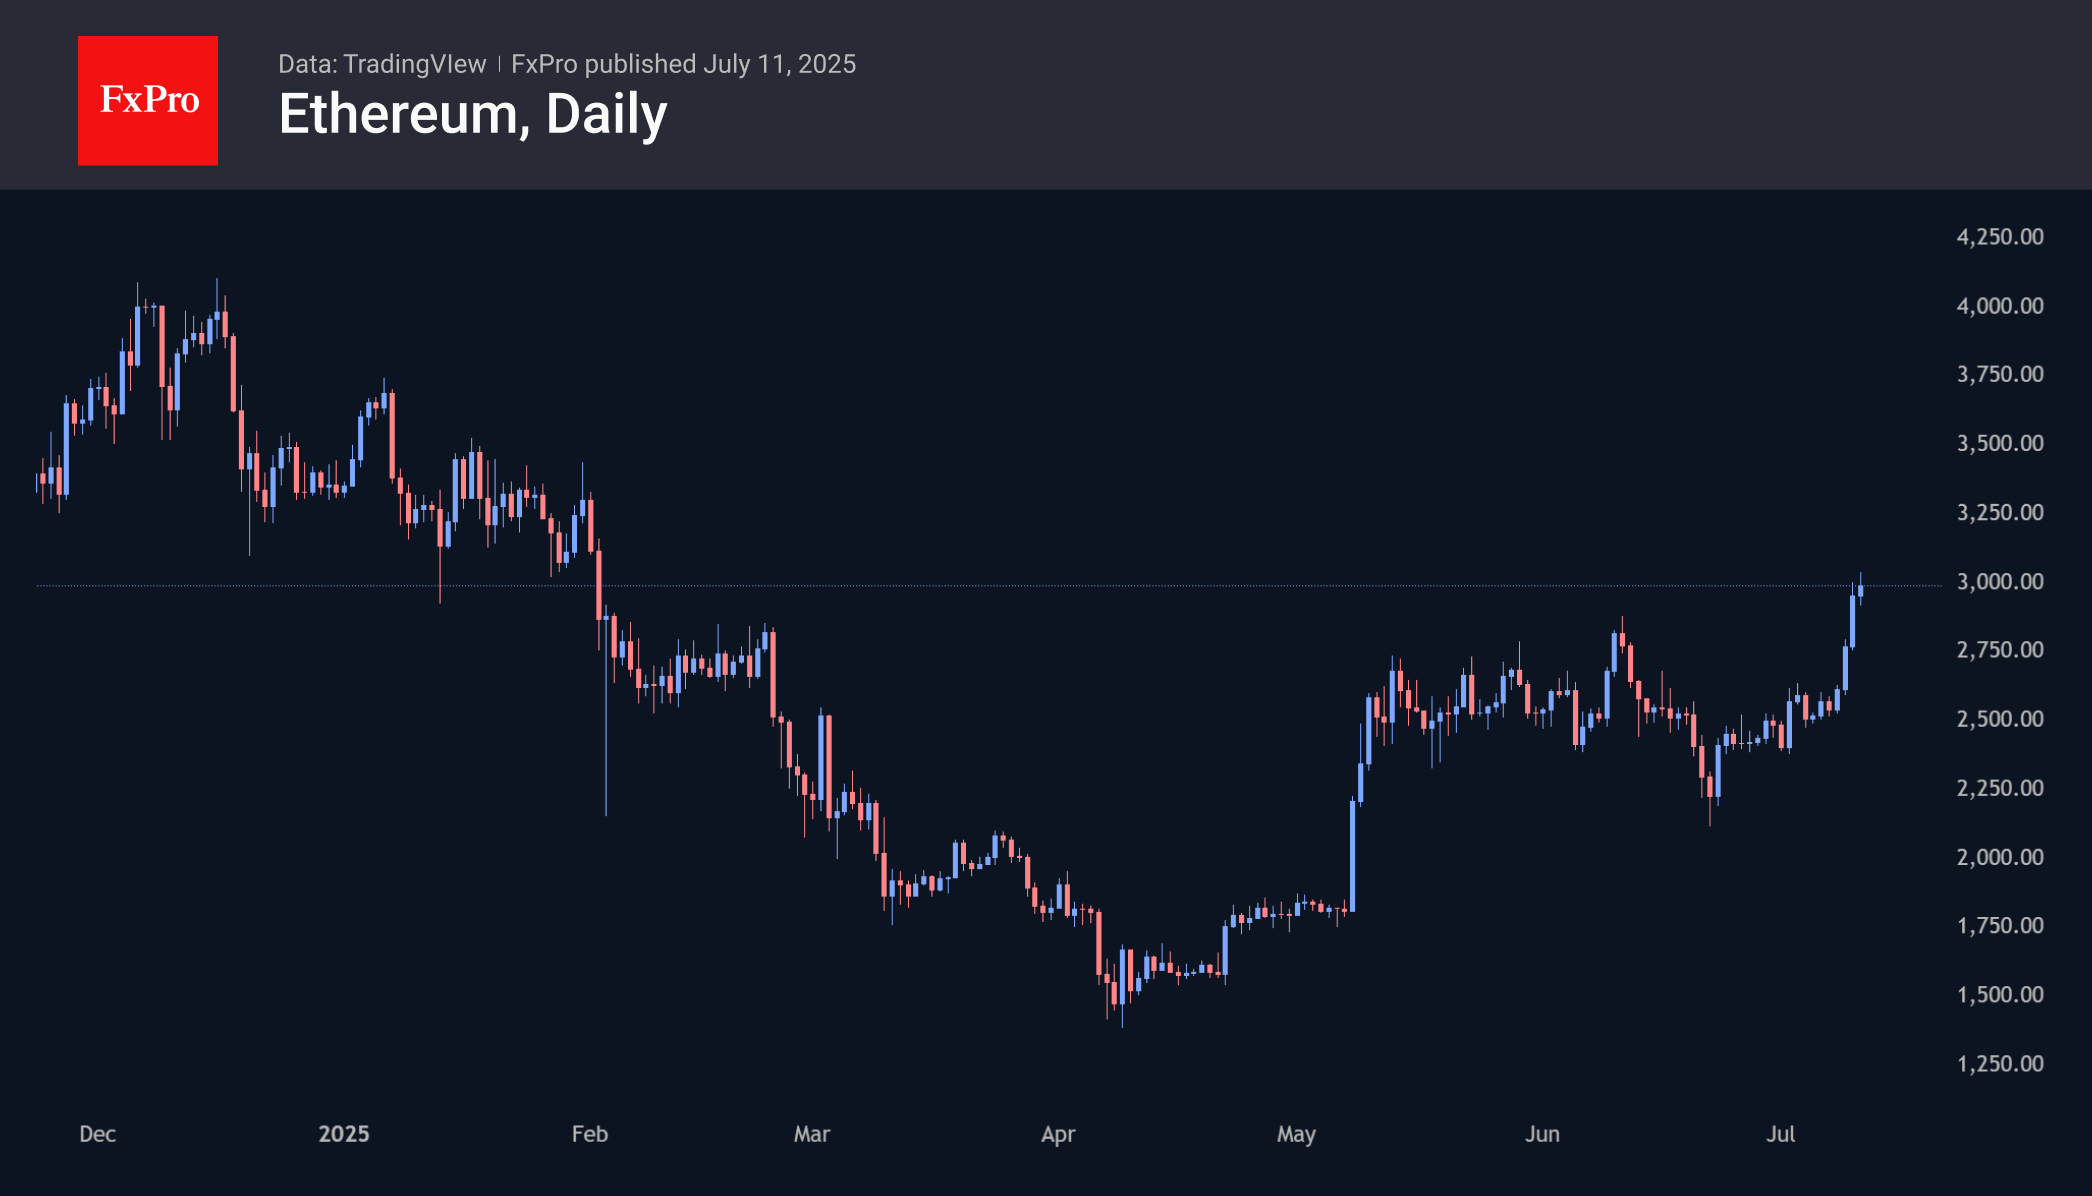
Old altcoins are being revived in light of the first cryptocurrency’s recent successes. Ethereum exceeded the $3,000 level at one point on Friday morning, above which it was last in early February. If we consider its past dynamics as a roadmap, the next areas of consolidation appear to be $3,300 and $4,000.
News Background
There is an active redistribution of roles in the digital asset market. Back in 2020, miners, offshore funds and anonymous wallets owned 95% of the bitcoins in circulation. As a result, a 2-9% increase in supply led to fluctuations in BTCUSD of 64-74%. Currently, about a quarter of tokens have passed into the hands of institutional investors. The movement of cryptocurrency is becoming more limited.
The inflow into spot Bitcoin ETFs in the US continues for the sixth trading session in a row, and for 21 of the last 22 days. According to SoSoValue, net inflows into spot BTC ETFs soared to $1.18 billion on 10 July, the highest in history. Total inflows since the approval of Bitcoin ETFs in January 2024 have increased to $51.34 billion, exceeding the $51 billion mark for the first time in history.
BTC Markets calls the achievement a ‘turning point in the institutionalisation of the asset.’ Retail investors do not drive growth; rather, they drive stable demand from asset managers, corporations, and platforms for wealthy clients.
CryptoQuant notes a jump in the ‘Coinbase premium,’ reflecting growing demand from American investors. After Strategy demonstrated a successful BTC accumulation strategy, many other companies followed suit.