Sample Category Title
US Dollar Strengthens Following Trump’s Tariff Decision
US President Donald Trump has announced his decision to impose new tariffs:
→ For Canada, tariffs are set at 35%. They are scheduled to take effect on 1 August, although negotiations may take place before this date, potentially influencing Trump’s final stance.
→ For many other countries, tariffs may be set at 15% or 20%;
→ For the European Union, the exact tariff levels have not yet been disclosed.
Overall, Trump’s latest comments have added to the uncertainty surrounding the specific tariffs to be applied to each country. The financial markets reacted as follows:
→ The US dollar strengthened against other currencies (including the Canadian dollar);
→ Equity markets saw a modest decline.
Technical Analysis of the USD/CAD Chart
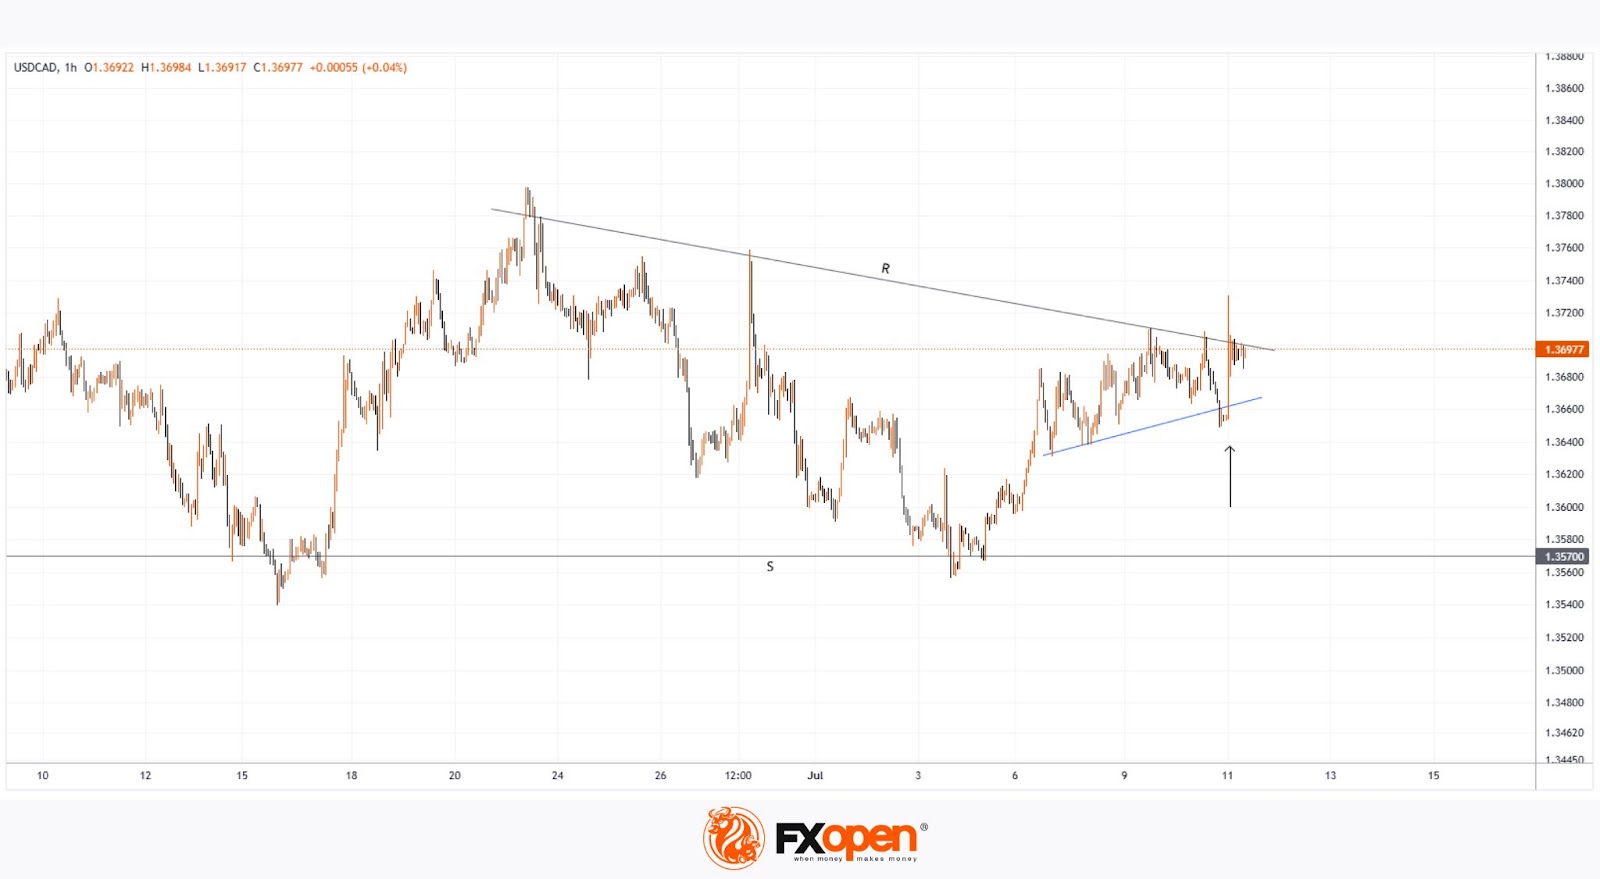
As soon as the announcement of a 35% tariff on Canadian imports to the US was made public, the USD/CAD rate spiked sharply (as indicated by the arrow), reaching levels last seen at the end of June. In the hours that followed, the pair stabilised.
Taking a broader view, the chart appears to show a triangular formation, which consists of:
→ A descending resistance line (R);
→ A key support level (S) around 1.3570.
From this perspective, it is worth noting that the bulls’ attempt to break above the resistance line amid the 35% tariff news did not succeed, indicating strong selling pressure.
At the same time, the price action of USD/CAD in early July allows us to identify a local support level (marked by the blue line). This suggests that, for now, the pair is consolidating within a formation bounded by the blue support line and resistance line R.
However, how long this consolidation will last, and which direction the breakout will take, will most likely depend on the next round of news regarding US–Canada trade negotiations.
Trade over 50 forex markets 24 hours a day with FXOpen. Take advantage of low commissions, deep liquidity, and spreads from 0.0 pips. Open your FXOpen account now or learn more about trading forex with FXOpen.
This article represents the opinion of the Companies operating under the FXOpen brand only. It is not to be construed as an offer, solicitation, or recommendation with respect to products and services provided by the Companies operating under the FXOpen brand, nor is it to be considered financial advice.
USD/JPY Climbs as Yen Struggles Amid Trade Tensions
On Friday, the USD/JPY pair advanced to 146.93, marking a three-week high as the US dollar continued to strengthen against a backdrop of escalating global trade tensions.
Recent developments in US trade policy have further unsettled markets. US President Donald Trump announced additional tariffs, including a 35% levy on Canadian imports, alongside plans for sweeping 15-20% duties on most other trading partners.
Of particular concern are US-Japan relations, following Trump’s imposition of a 25% tariff on Japanese goods this week, set to take effect on 1 August. The move has intensified bilateral strains, with Japanese Prime Minister Shigeru Ishiba warning of the need to reduce Japan’s reliance on the US in defence, food security, and energy.
Ishiba described the ongoing negotiations as a “battle for national interests”. At the same time, a leading Japanese think tank projected that the tariffs could shave 0.8% off Japan’s GDP in 2025, with a cumulative decline of 1.9% by 2029.
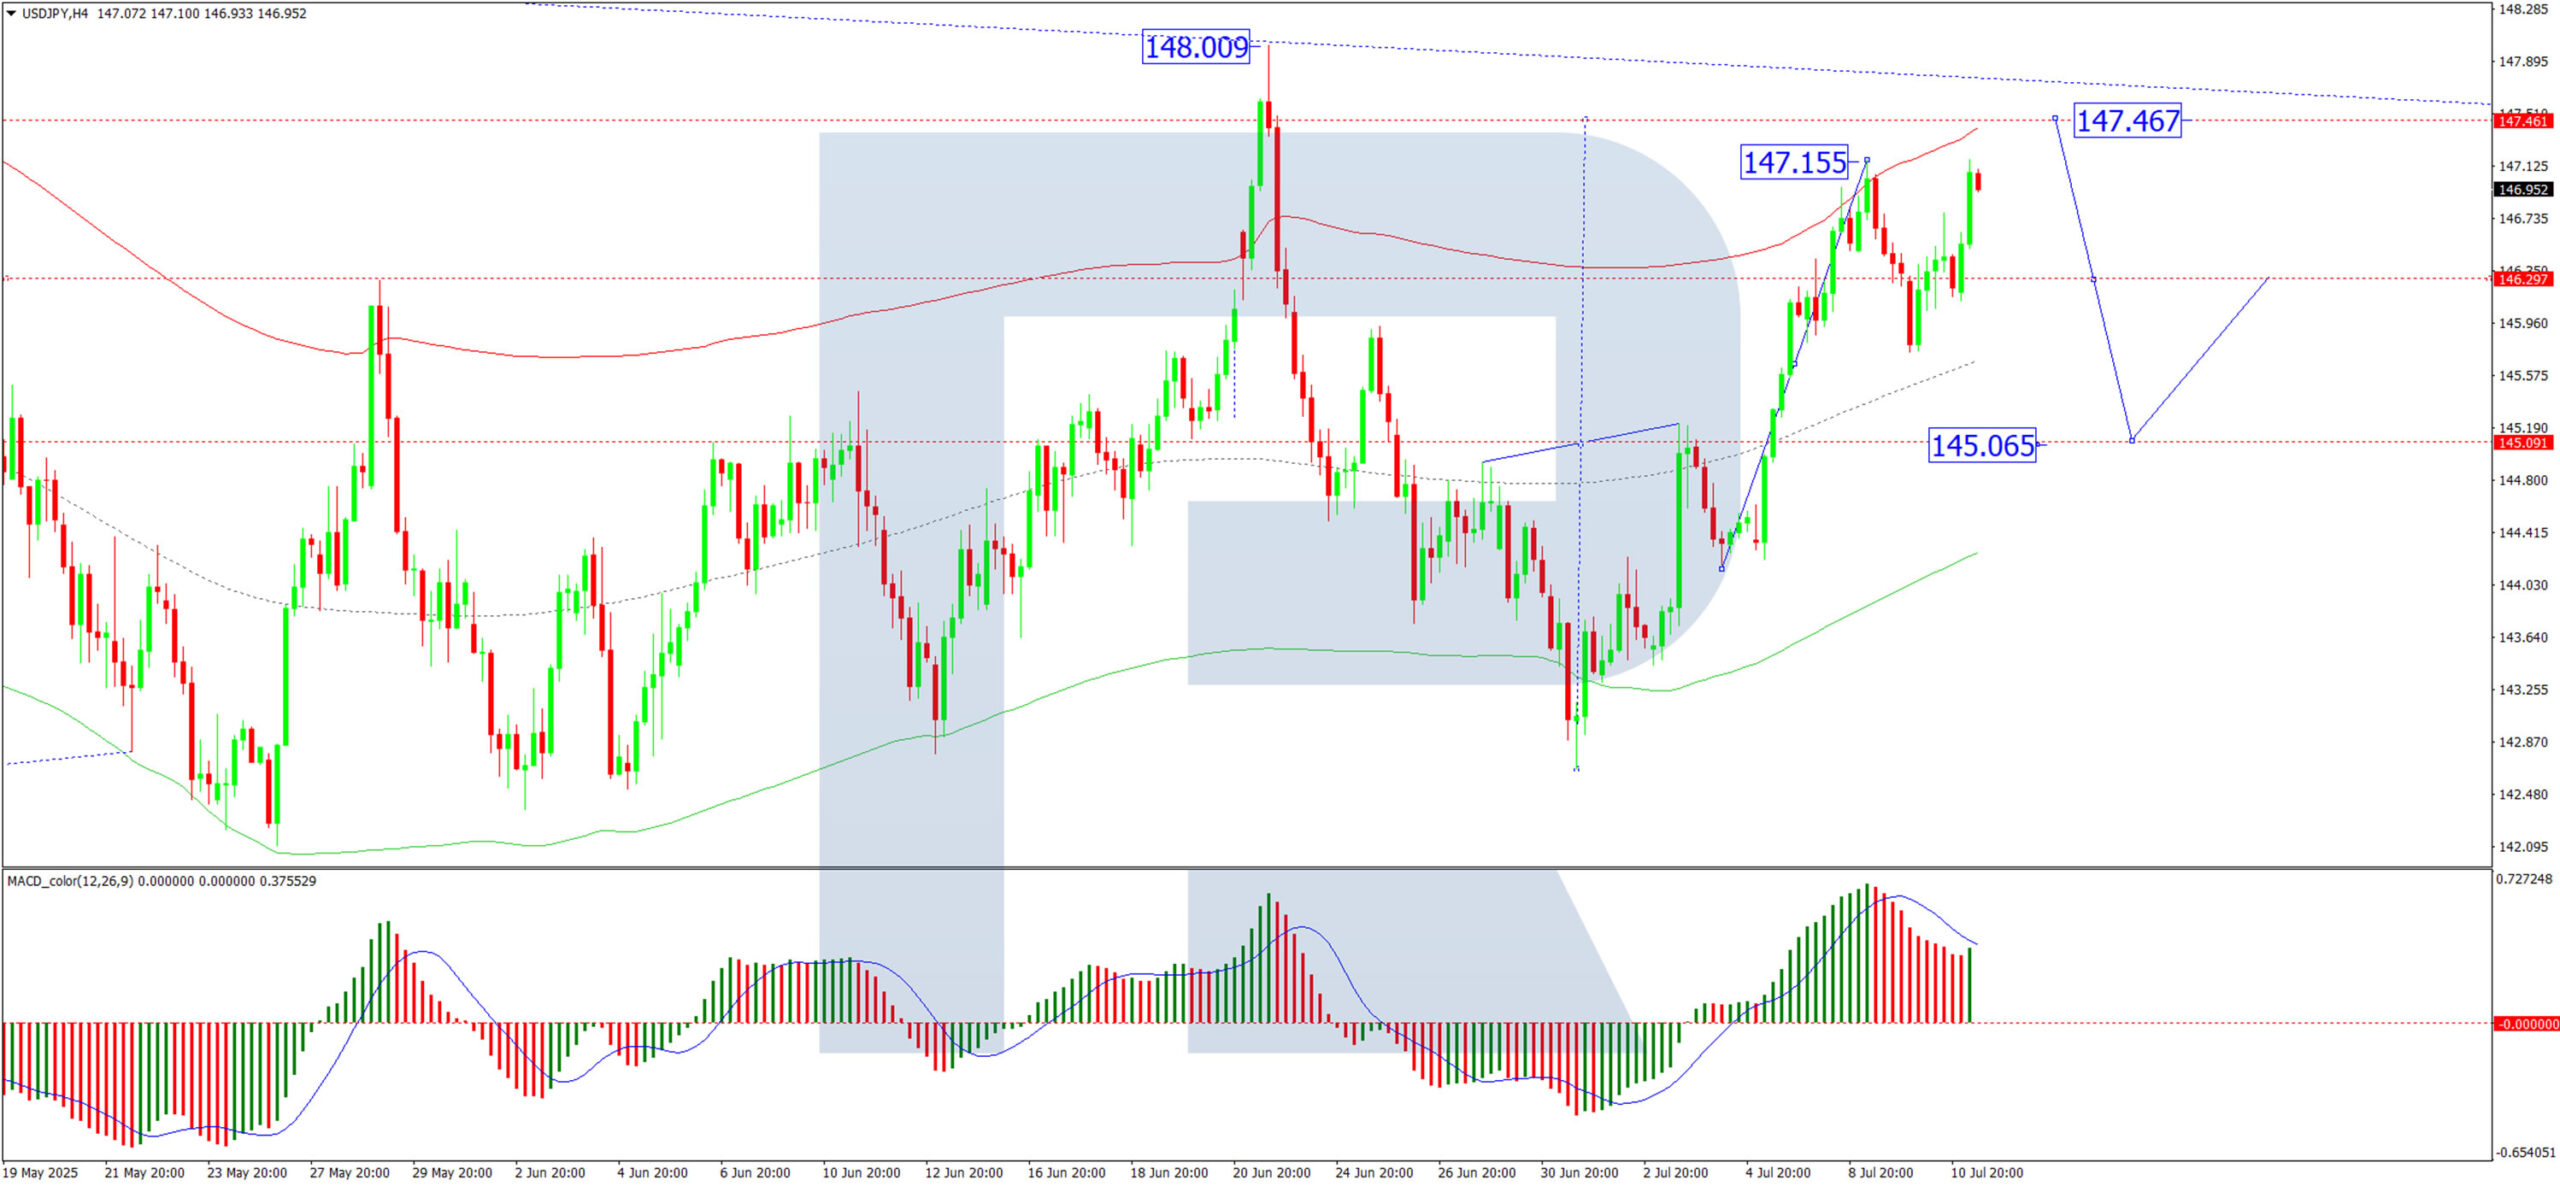
Technical Analysis: USD/JPY
H4 Chart:
The USD/JPY has established a consolidation range around 145.65, now extending to 147.17. A short-term pullback to 145.65 (testing from above) is anticipated, followed by a potential upward wave targeting 147.47 at minimum. This outlook is supported by the MACD indicator, with its signal line firmly above zero and trending upward.
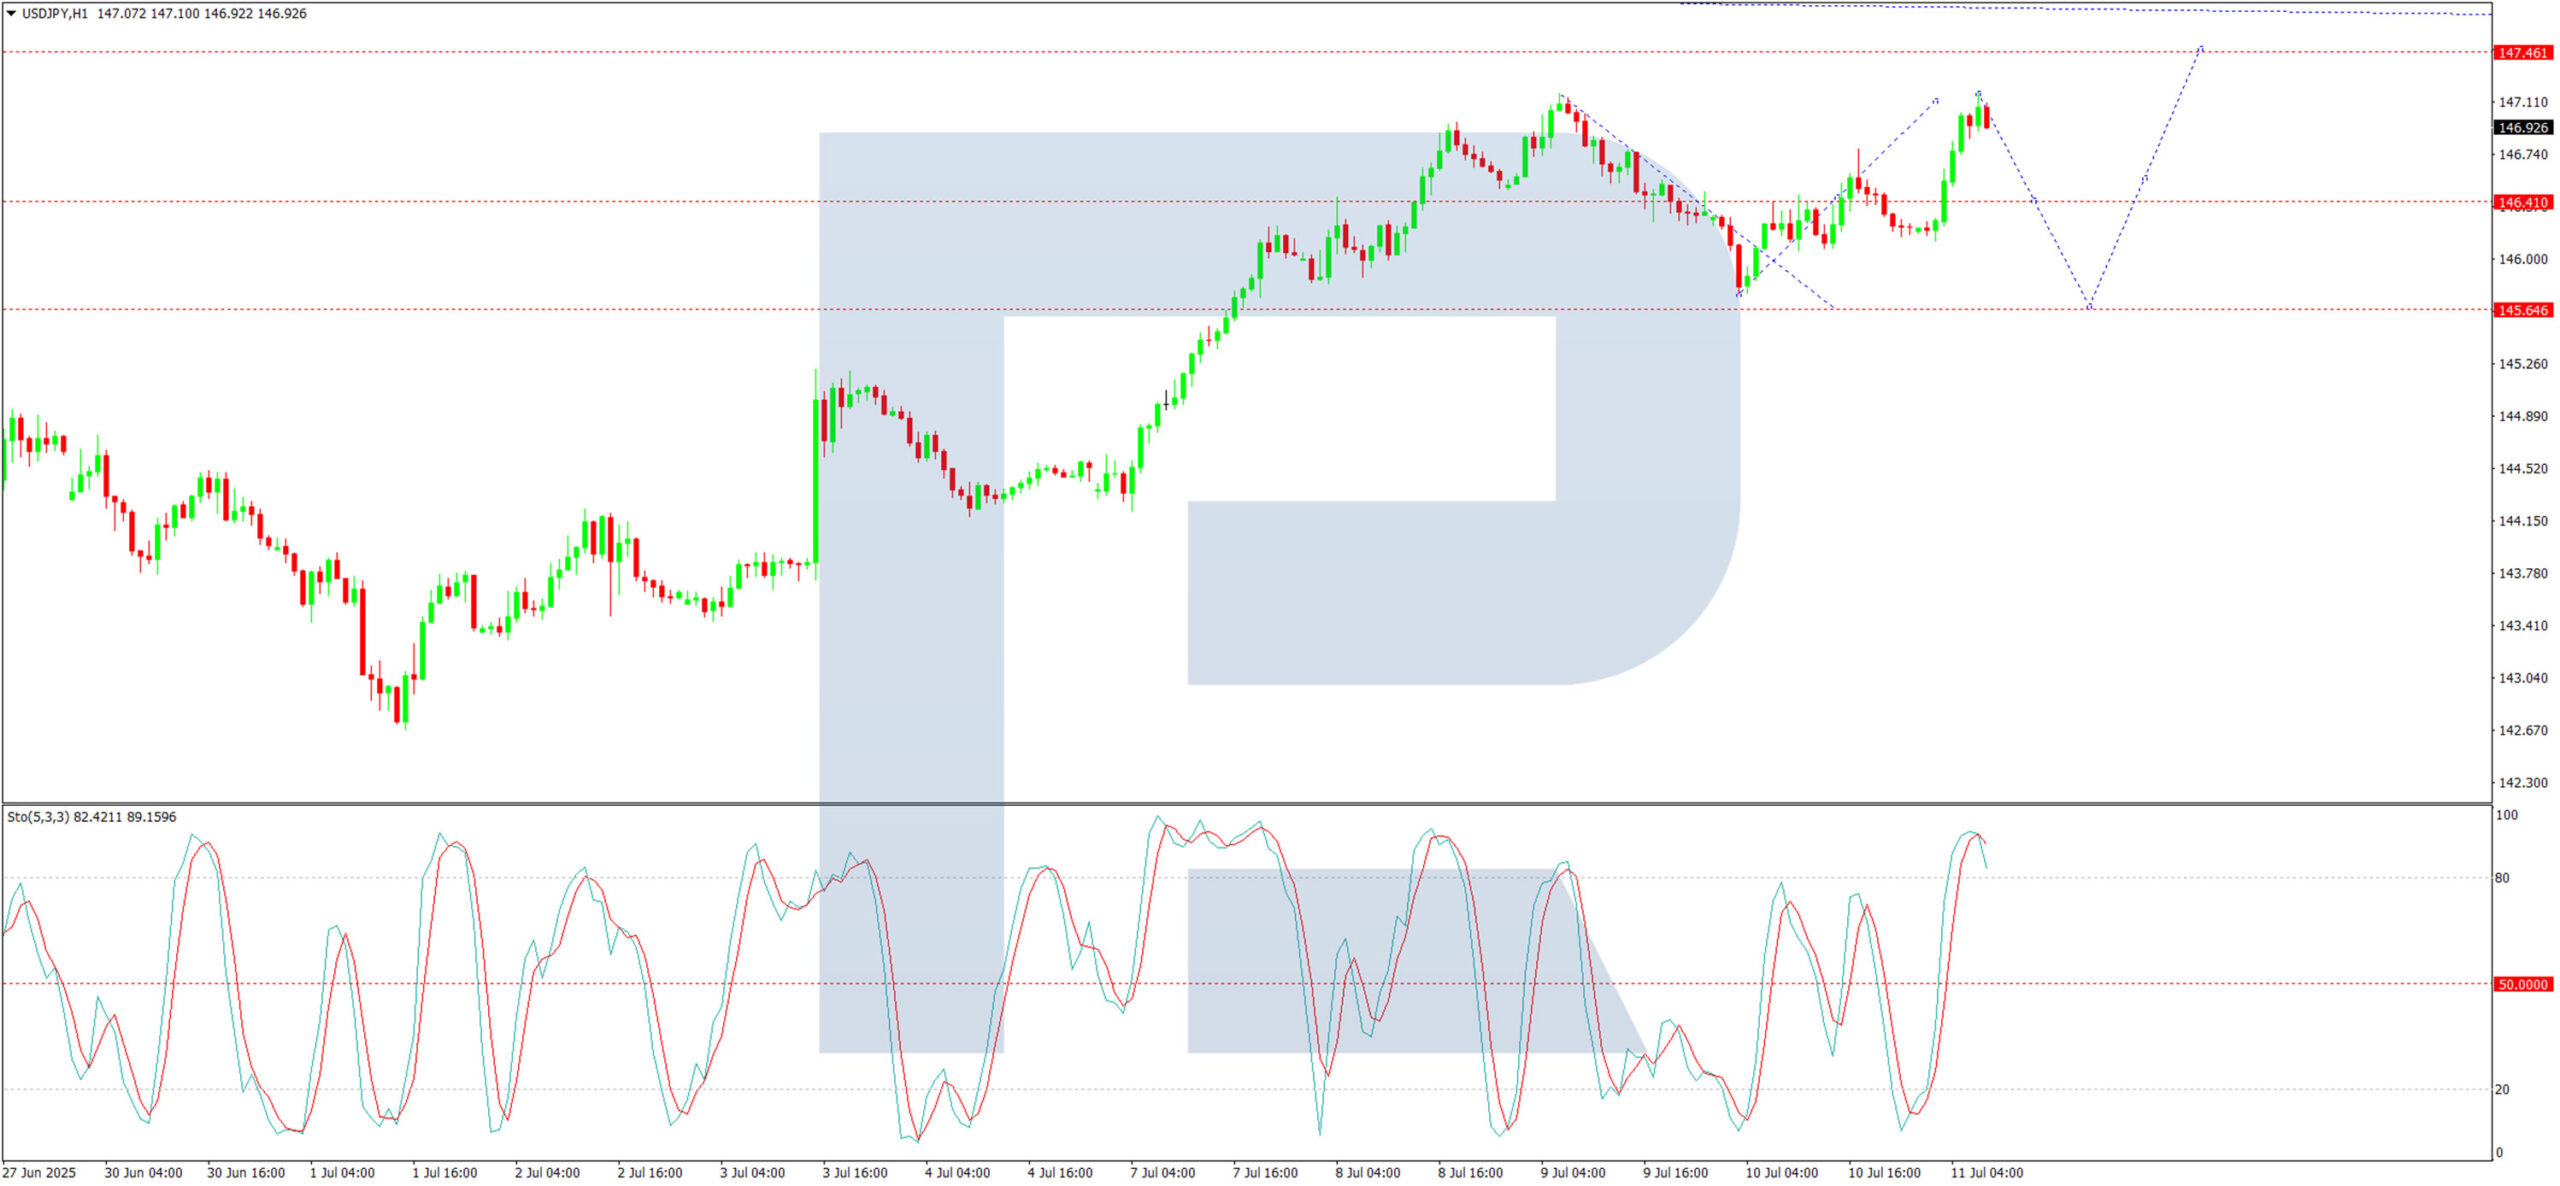
H1 Chart:
A consolidation phase near 146.41 preceded an upward breakout, completing a wave structure at 147.17. A downward correction towards 145.65 is now in view, corroborated by the Stochastic oscillator, where the signal line sits at 80 and points sharply downward.
Conclusion
The yen’s weakness persists amid dollar strength and trade uncertainties, with technical indicators suggesting near-term volatility. Traders should monitor 145.65 as a key support level, while further upside towards 147.47 remains plausible.
ECB’s Schnabel: Inflation on track, economy resilient, bar for further rate cut very high
ECB Executive Board member Isabel Schnabel signaled in an interview with Econostream Media that there is urgency for further easing. Schnabel noted that inflation is now projected to be at 2% target over the medium term, and expectations remain "well anchored", while interest rates are in a "good place". She added that "the bar for another rate cut is very high".
Schnabel emphasized that there is "no risk of a sustained undershooting" and that core inflation is forecast to meet target throughout the horizon. She also downplayed concerns over the disinflationary impact of Euro strength, calling such fears “exaggerated” given limited pass-through effects. Schnabel argued that temporary factors such as low energy inflation are unlikely to derail the ECB’s price stability goals.
On the growth front, Schnabel was notably upbeat. Recent PMI data suggesting further recovery ahead. Manufacturing indicators such as new orders and export demand have all reached three-year highs, pointing to more than just temporary momentum. Combined with record-low unemployment and the expectation of a large fiscal impulse, she argued that risks to the growth outlook are now "more balanced", reducing the case for near-term rate action.
Hong Kong Stocks Rally on China Stimulus Hopes, AUD/USD (Chart of the Day)
The S&P 500 edged up 0.3% on Thursday, 10 July, closing at a marginal new record high of 6,280. However, bullish momentum faded in the Asian session, with S&P 500 and Nasdaq 100 E-mini futures both down 0.3% amid renewed tariff anxieties.
Trump escalates trade tensions with Canada
US President Trump announced a tariff hike on Canadian imports to 35%, up from the current 25%, set to take effect on 1 August. These apply to Canadian goods not covered under the USMCA trade pact. He also hinted that the base tariff rate on all US trading partners might rise from 10% to 15–20%.
Asia stocks rally on hopes of China stimulus
Asia Pacific stock markets largely shrugged off US tariff threats, buoyed by reports that China may unveil a new stimulus plan targeting its embattled property sector. The rumoured high-level policy meeting next week is said to mirror the 2015 Central Urban Work Conference, which spurred infrastructure and urban development spending.
Hang Seng and STI extend gains; Nikkei lags
Hong Kong’s Hang Seng Index jumped 1.7% to a four-month high, breaking above its 20-day moving average for the first time since 24 June. Singapore’s Straits Times Index climbed 0.4%, on track for a fifth straight record close, nearing the psychological 4,100 level. In contrast, Japan’s Nikkei 225 fell by 0.2%.
FX market mixed; USD gains against JPY and CAD
The US dollar strengthened most against the Japanese yen (-0.4%) and Canadian dollar (-0.3%) in today’s Asia session. Meanwhile, the Australian dollar held steady, with AUD/USD staying above its 20-day moving average support around 0.6540.
Gold climbs for a third day despite stronger dollar
Gold (XAU/USD) defied the firmer dollar, rising 0.5% intraday for its third straight gain. Ongoing tariff fears provided safe-haven support, pushing prices toward the key intermediate resistance at US$3,360.
Economic data releases
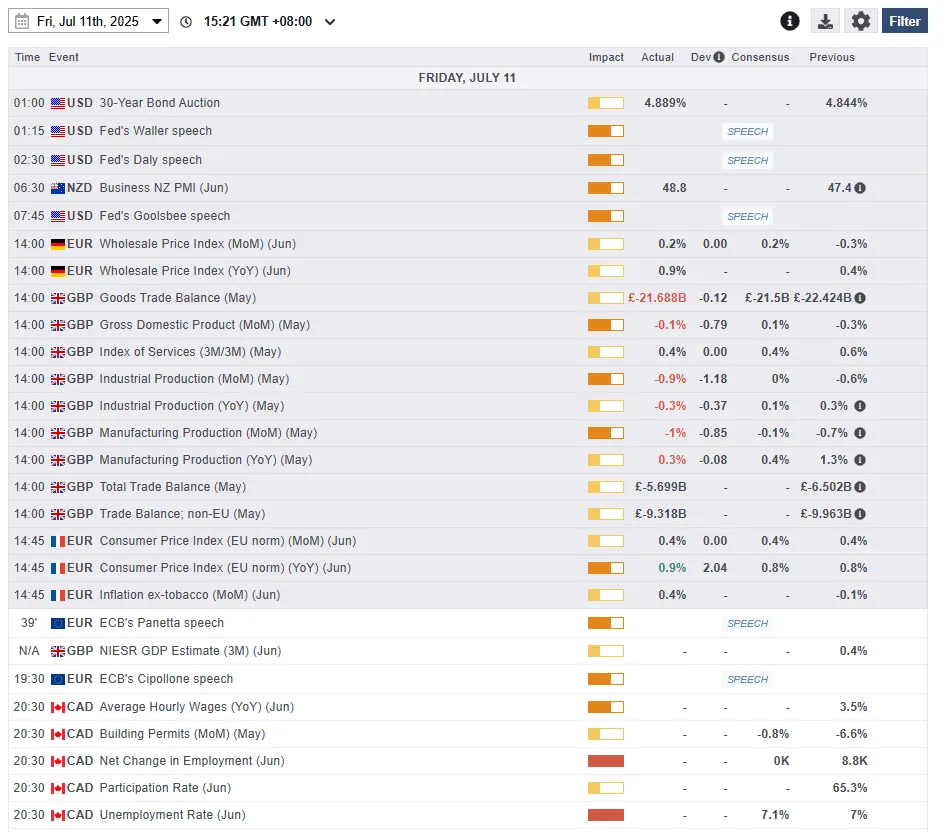
Fig 1: Key data for today’s Asia mid-session (Source: MarketPulse)
Chart of the day – Bullish momentum remains intact in AUD/USD
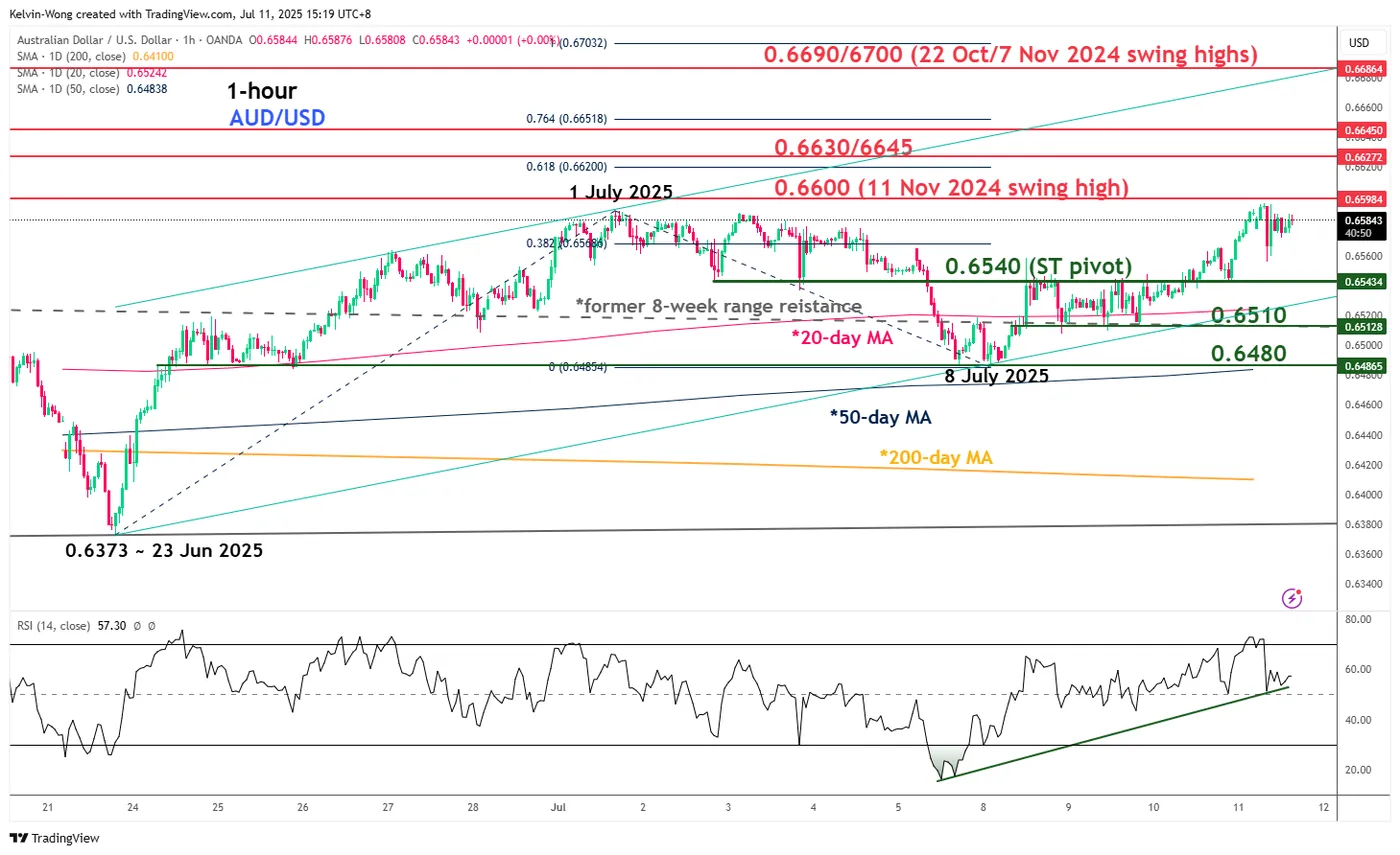
Fig 2: AUD/USD minor trend as of 11 July 2025 (Source: TradingView)
The recent up move seen in the AUD/USD from this Tuesday, 8 July’s minor swing low of 0.6485, and the reintegration back above its 20-day moving average. These observations suggest that the minor corrective decline sequence from the 1 July high to the 8 July low is likely to have ended (see Fig 2).
In addition, the hourly RSI momentum indicator has managed to stage a bounce right at a parallel ascending support and the 50 level, which highlights a revival of bullish momentum conditions.
Watch the 0.6540 key short-term pivotal support, and a clearance above 0.6600 increases the odds of a new bullish impulsive up move sequence to see the next intermediate resistances coming in at 0.6630/6645 and 0.6690/6700 (Fibonacci extension and upper boundary of the minor ascending channel).
However, failure to hold at 0.6540 negates the bullish tone for a slide to revisit the next immediate supports at 0.6510 (also the 20-day moving average) and 0.6480 (also the 50-day moving average).
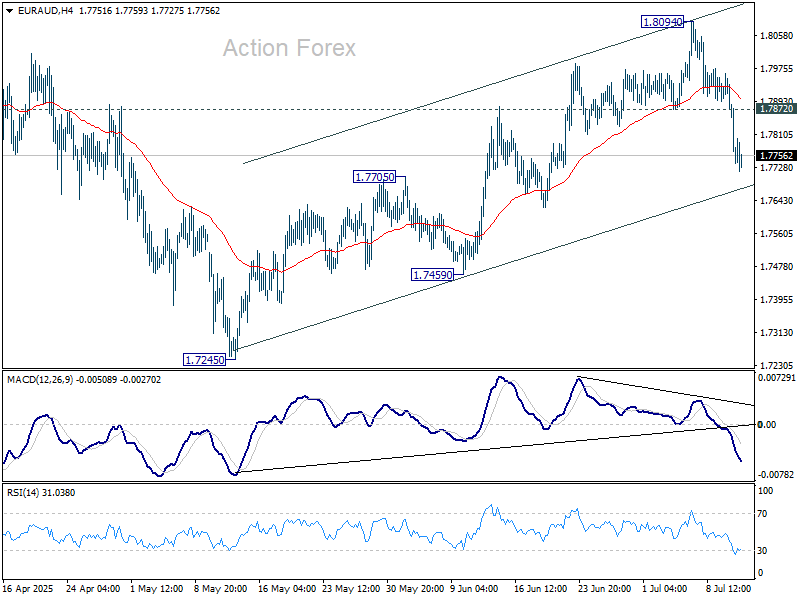
EUR/AUD Daily Outlook
Daily Pivots: (S1) 1.7679; (P) 1.7822; (R1) 1.7902; More...
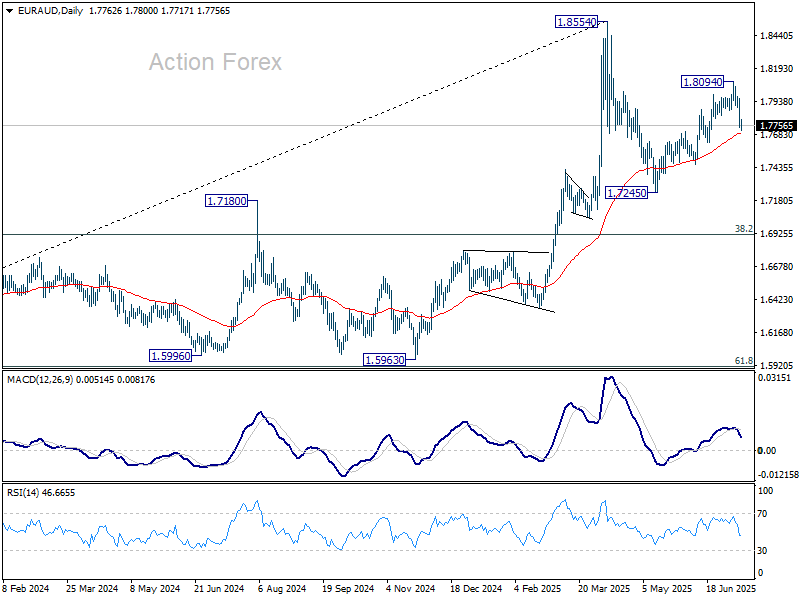
EUR/AUD's strong break of 1.7872 support suggests that rebound from 1.7245 has completed with three waves up to 1.8094. Intraday bias is back on the downside. Sustained trading below 55 D EMA (now at 1.7694) will suggest that corrective pattern from 1.8554 high is already in the third leg. Deeper fall should then be seen back to 1.7245 support. Nevertheless, strong rebound from the EMA will maintain near term bullishness for another rise through 1.8094 later.
In the bigger picture, price actions from 1.8554 medium term are seen as a corrective pattern. While deeper pullback might be seen, downside should be contained by 38.2% retracement of 1.4281 (2022 low) to 1.8554 at 1.6922 to bring rebound. Up trend from 1.4281 is expected to resume at a later stage.
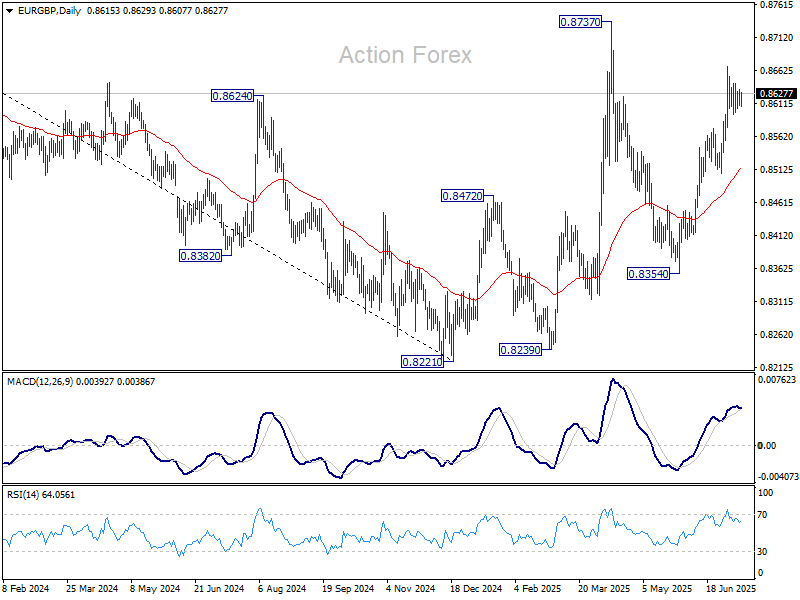
EUR/GBP Daily Outlook
Daily Pivots: (S1) 0.8606; (P) 0.8620; (R1) 0.8630; More...
Intraday bias in EUR/GBP remains neutral for consolidations below 0.8668. Further rise is expected as long as 0.8506 support holds. Above 0.8668 will target a retest on 0.8737 high. Decisive break there will resume the whole rise from 0.8221 low.
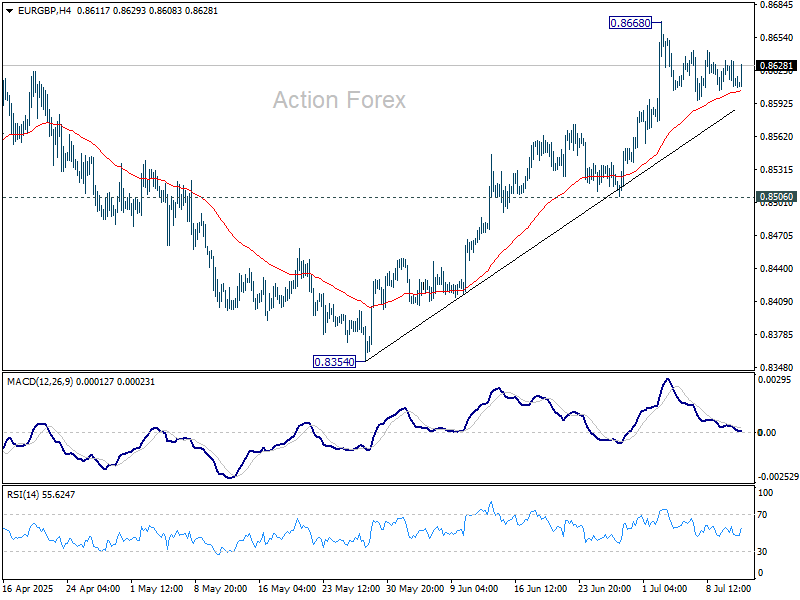
In the bigger picture, the structure from 0.8221 medium term bottom are not impulsive enough to suggest that it's reversing the downside from 0.9267 (2022 high). But even if it's a correction, firm break of 0.8737 will still pave the way to 61.8% retracement of 0.9267 to 0.8221 at 0.8867.
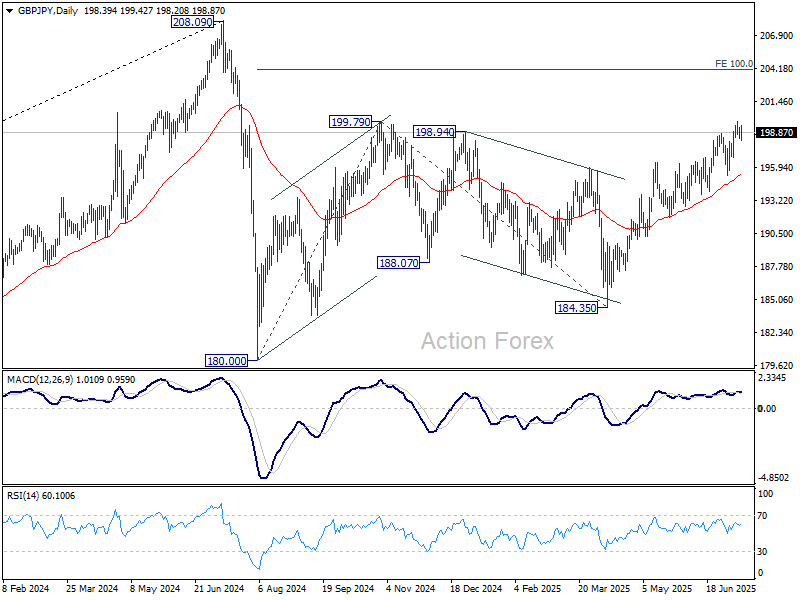
GBP/JPY Daily Outlook
Daily Pivots: (S1) 198.24; (P) 198.74; (R1) 199.11; More...
Intraday bias in GBP/JPY remains neutral for consolidations below 199.80. Further rise is expected as long as 195.33 support holds. Break of 199.80 will resume the rise from 184.35 to 100% projection of 180.00 to 199.79 from 184.35 at 204.14 next.
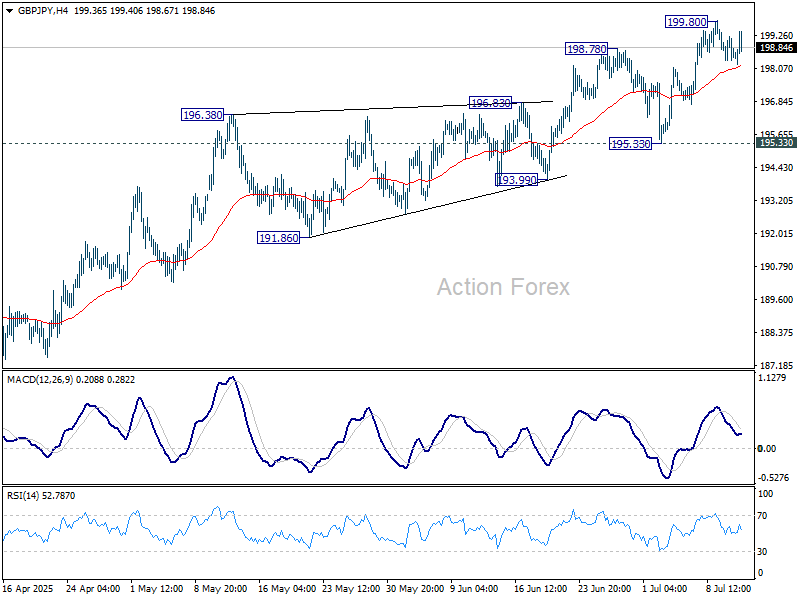
In the bigger picture, price actions from 208.09 (2024 high) are seen as a correction to rally from 123.94 (2020 low). The pattern might still extend with another falling leg. But in that case, strong support should be seen from 38.2% retracement of 123.94 to 208.09 at 175.94 to contain downside. Meanwhile, decisive break of 208.09 will confirm long term up trend resumption.
EUR/JPY Daily Outlook
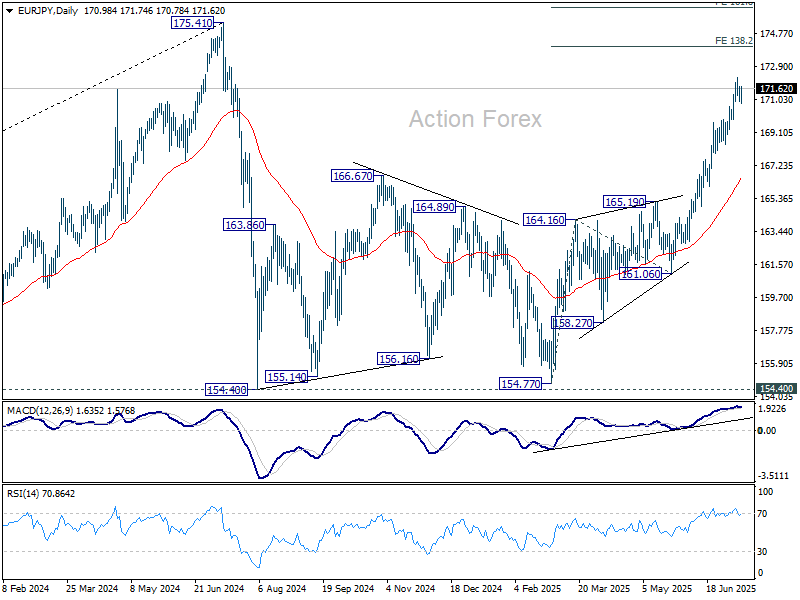
Daily Pivots: (S1) 170.78; (P) 171.28; (R1) 171.62; More...
Intraday bias in EUR/JPY remains neutral and more consolidations could be seen below 172.25. Downside should be contained above 168.44 support to bring another rally. On the upside, break of 172.25 will extend the rise from 154.77 to 138.2% projection of 154.77 to 164.16 from 161.06 at 174.03.
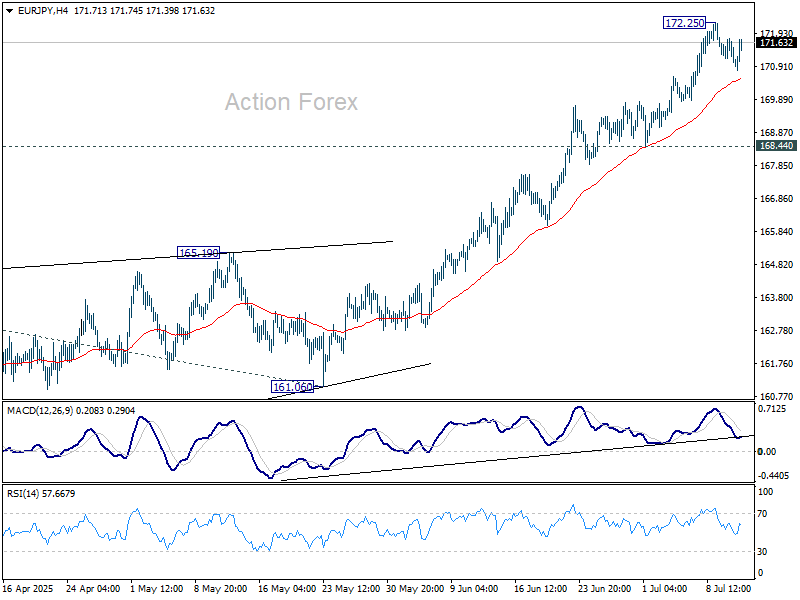
In the bigger picture, price actions from 175.41 (2024 high) are seen as correction to up trend from 114.42 (2020 low). The pattern might still extend with another falling leg. But in that case, strong support should be seen from 38.2% retracement of 114.42 to 175.41 at 152.11 to contain downside. Meanwhile, decisive break of 175.41 will confirm long term up trend resumption.
EUR/CHF Daily Outlook
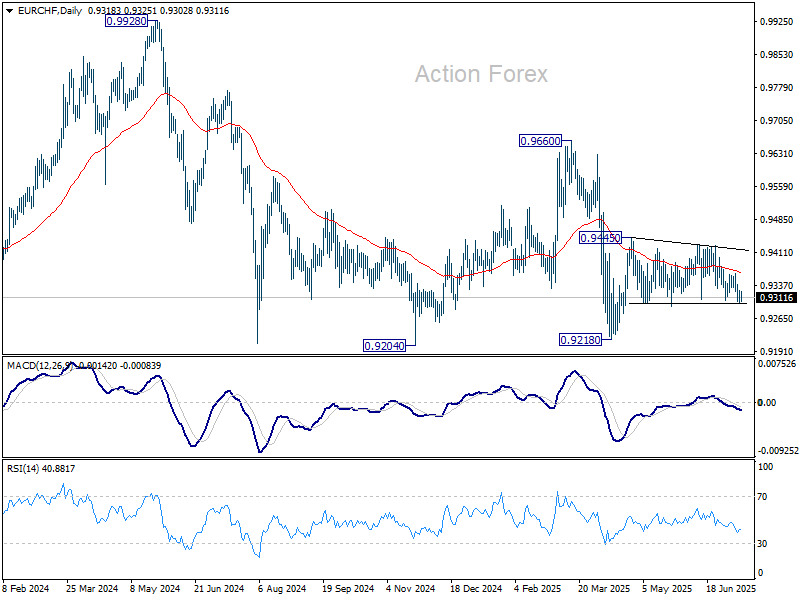
Daily Pivots: (S1) 0.9308; (P) 0.9318; (R1) 0.9334; More....
Intraday bias in EUR/CHF remains neutral for the moment. On the upside, break of 0.9428/45 resistance zone will resume the rebound from 0.9218. On the downside, break of 0.9297 will bring retest of 0.9218 low instead.
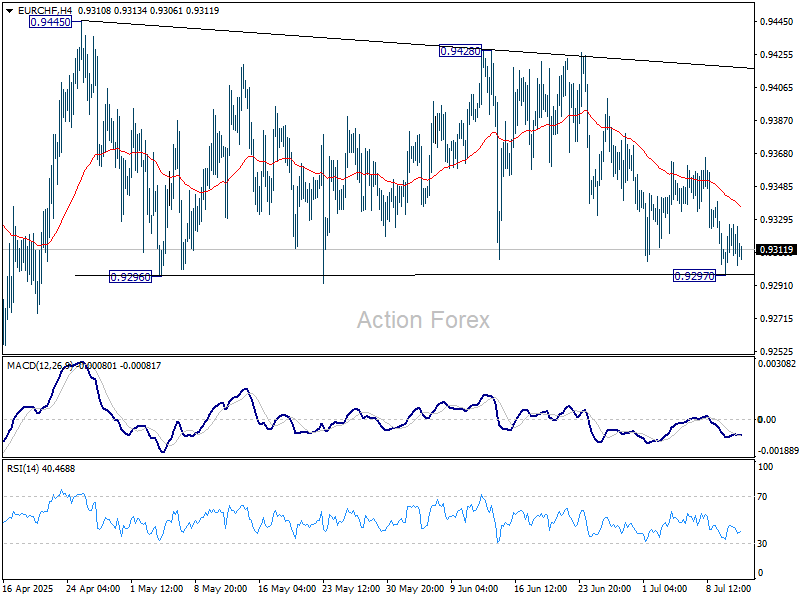
In the bigger picture, while downside momentum has been diminishing as seen in W MACD, there is no sign of bottoming yet. EUR/CHF is still staying below 55 W EMA (now at 0.9433) and well inside long term falling channel. Outlook will stay bearish as long as 0.9660 resistance holds. Break of 0.9204 (2024 low) will confirm resumption of down trend from 1.2004 (2018 high).
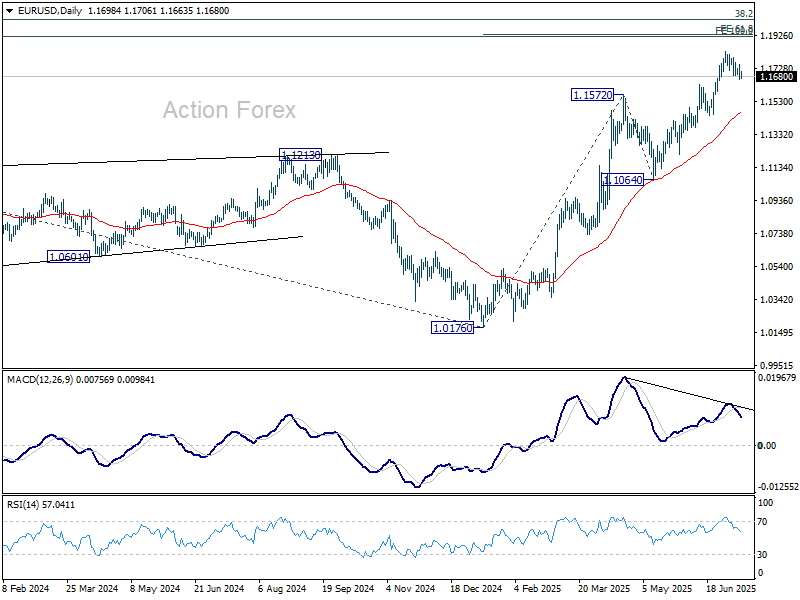
EUR/USD Daily Outlook
Daily Pivots: (S1) 1.1659; (P) 1.1705; (R1) 1.1746; More...
Intraday bias in EUR/USD remains neutral at this point. Strong support is expected from 1.1630 resistance turned support to complete the correction from 1.1829. On the upside, firm break of 1.1829 will resume the rise from 1.0176 and target 61.8% projection of 1.0176 to 1.1572 from 1.1064 at 1.1927. However, sustained break of 1.1630 will bring deeper fall to 55 D EMA (now at 1.1459) instead.
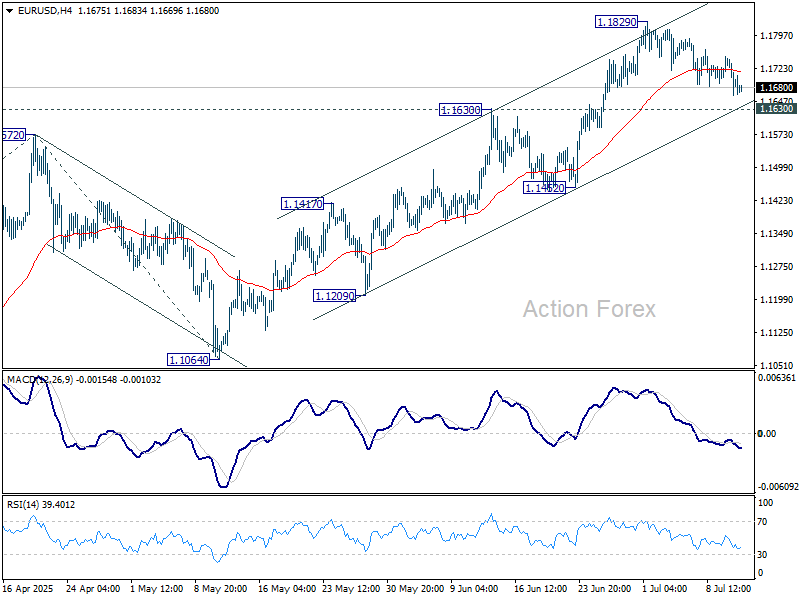
In the bigger picture, rise from 0.9534 long term bottom could be correcting the multi-decade downtrend or the start of a long term up trend. In either case, further rise should be seen to 100% projection of 0.9534 to 1.1274 from 1.0176 at 1.1916. This will now remain the favored case as long as 1.1604 support holds.