Sample Category Title
UK GDP Expected to Expand, British Pound Lower
The British pound is lower on Thursday. In the North American session, GBP/USD is trading at 1.3534, down 0.36% on the day.
The UK releases May GDP on Friday, with the markets expecting a rebound of 0.1% m/m, following a 0.3% contraction in April, which was the first decline in six months and the sharpest drop since October 2023. The soft April GDP report was affected by some one-on factors; namely, the announcement of the US tariffs and an increase in employers' national insurance contributions.
OBR says UK economy on "unsustainable" path
It hasn't been a great run for the UK government. Last week, the government failed to reform welfare spending. On Tuesday, the Office for Budget Responsibility (OBR) delivered a scathing report of the state of the UK's public finances on Tuesday. The report sent the British pound as low as 1.3524 the same day, its lowest level since June 24.
The OBR warned that spending, borrowing and the size of the government debt were set to soar in the coming decades without a change in policy. The report said that the country's public finances were on an "unsustainable" long-term path and bluntly noted that the "UK cannot afford any of the promises it has made to the public".
The bleak report led to higher bond yields, as investors are demanding higher yields for holding UK debt. That should boost the pound, but at a certain point even higher rates won't be enough to attract investors if concerns worsen over the UK's fiscal outlook.
FOMC minutes - how fast to cut rates?
The FOMC minutes indicated a broad consensus that the Fed will deliver additional rate cuts this year. The pace of those cuts, however, is up for debate. Some members favored cutting as soon as the July meeting, while others were more cautious and wanted to see where inflation and employment were headed. President Trump's tariffs have not boosted inflation so far, but the tariff effect on inflation could be felt in the following months and the Fed remains cautious.
GBPUSD Technical
The UK releases May GDP on Friday, with the markets forecasting a small gain of 0.1%. The OBR said that the UK's public finances are on an "unsustainble" path in the long-term. The FOMC minutes were dovish but members are split on the the timing of the next rate cut.
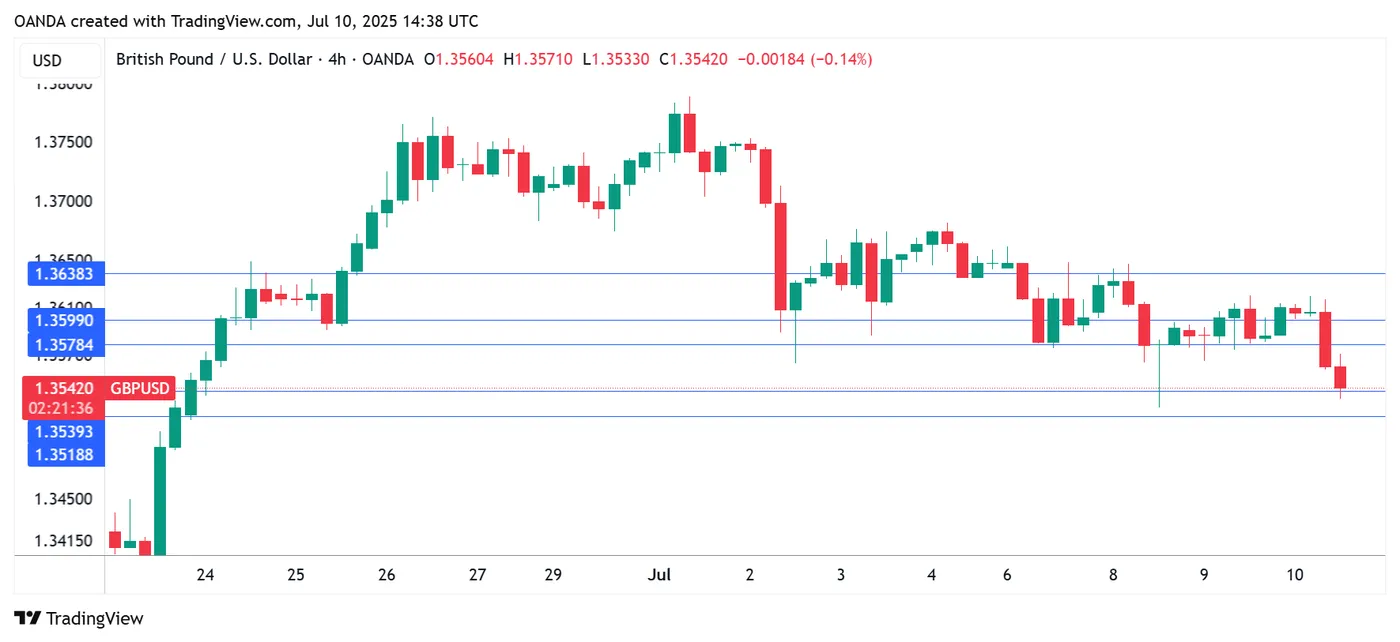
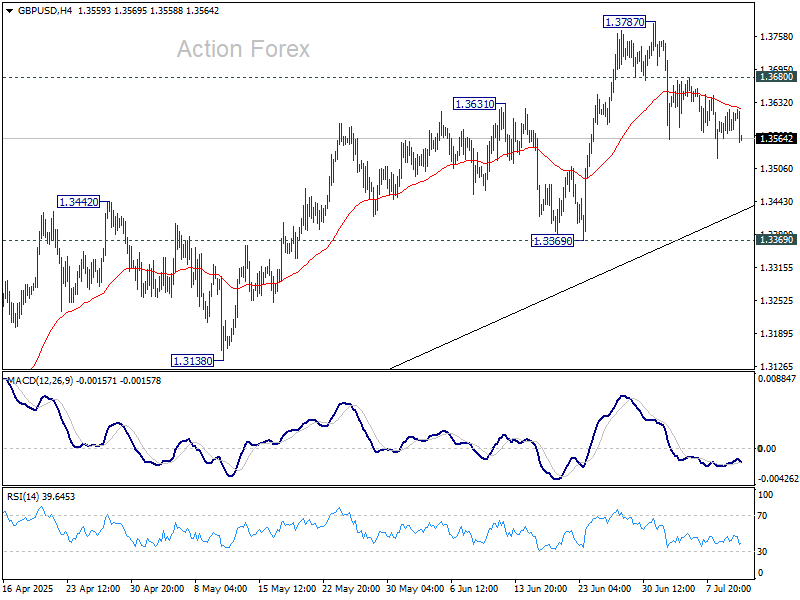
GBPUSD 4-Hour Chart, July 10, 2025
Fed’s Musalem: Tariff impact on inflation still unclear, economy in good place
St. Louis Fed President Alberto Musalem on warned that it’s too early to judge how deeply tariffs might affect US inflation. He projected the average effective tariff rate could land in the high teens to low 20s, but emphasized uncertainty about how the price impact will play out. “It’s too soon to tell” whether tariffs will trigger a one-time price jump or more persistent inflation, he said.
Musalem noted that Dollar depreciation could add to inflation pressures and highlighted differing reactions across businesses. Some firms may absorb the cost increases, while others are likely to pass them through to consumers depending on their profit margins and pricing power.
Despite the tariff noise, Musalem struck a generally upbeat tone on the macro backdrop. He said the economy is in a “good place,” with the labor market at or near full employment and monetary policy only “modestly restrictive.”
Sunset Market Commentary
Markets
This week was supposed to be a pivotal one but the July 9 deadline for the US import tariff reprieve eventually turned out to be just another TACO event. President Trump did sent out letters stating the applicable tariff this week, including a 25% levy for major trading partners South Korea and Japan, but the kick-off date is August 1. That offers another three weeks for negotiations, which is an age in market terms. Trump juggled with a 50% copper and a 200% pharmaceutical tariff, but other than a sharp price increase in the former (and even that is only on the US exchange), there’s little impact to be found of Trump’s announcements elsewhere. “Not credible” is what some European manufacturers are saying. The same goes for the Brazilian 50% politically motivated levy treat overnight. The Brazilian real slipped in a kneejerk reaction to above USD/BRL 5.6 but is already stabilizing the day after, let alone that fear spilled over to other markets. Neither do markets bother to take note of Trump’s umpteenth attack on Fed chair Powell. What started as a call for a 100 bps cut morphed into a 250 bps one before demanding a 300 bps lower policy rate recently. Public finances fought back in the center of attention too, originating from Japan at the start of the week and easily affecting other core markets that are facing similarly tricky budgetary issues. Yesterday’s solid US 10-yr auction and a Japanese 20-yr auction that wasn’t as bad as some feared took a little steam out of the long-term bond yield surge over the recent days. Yet, it’s interesting to see that from the initial 6 bps drop in Japan’s 30-yr yield this morning, for example, nothing remains left. It suggests being one of the market subjects that actually stick. Tonight’s US 30-yr auction most certainly will draw some additional attention to the matter. Yields elsewhere rise between 1-2.5 bps in a gentle flattening move in the US amid lower-than-expected jobless claims. The 227k print helped lower the 4-week MA from a 2-year high to the lowest since May of this year. European swap rates add about the same amount but in a bear steepener. Both stock and FX markets trade super quietly. The US dollar has a slight edge over the euro (EUR/USD 1.1707) and most other G10 peers (DXY 97.64) but it’s barely worth mentioning. Cyclicals including AUD and NZD are relative outperformers, CHF lags.
News & Views
In its 2025 World Oil Outlook report, OPEC said that global oil demand is set for a continued robust growth, rising almost 123mn bpd in 2050 compared to 103.7mn bpd in 2024. In a medium term perspective, OPEC sees demand rising by +/- 9% between 2024-2030. India, other Asia, the Middle East and Africa are set to be the primary sources of long-term long term oil demand growth, with India being the most important driver. China’s oil demand is projected to increase by less than 2m b/d over the same time horizon. Oil consumption in various transportation modes constitutes the backbone of global oil demand throughout the forecast period as this sector accounted for more than 57% of global oil demand in 2024 and is projected to retain this. Within this sector, the largest incremental demand is expected in road transportation and aviation. A significant demand increase also projected in the petrochemical sector. In a more short-term perspective, Bloomberg reports, referring to delegates familiar with the matter, that OPEC+ is discussing a pause in production increases from October after a next (tentative) monthly hike of 550k bpd (Sept) would complete a 2.2m bpd revival plan. Brent oil currently trades just below $70 p/b.
June CPI headline inflation in Norway rose by 0.2% M/M and 3.0% Y/Y. Underlying inflation, adjusted for taxes and ex. energy products rose 0.5% M/M and 3.1% Y/Y (was 2.8% in May). The outcome was close to expectations. The Norges Bank unexpectedly cut its policy rate by 25 bps in June to 4.25% as it saw inflation declining since March and as the inflation outlook indicated lower inflation than previously expected. Today’s data support the NB guidance for the policy rate to be reduced to near 4.0% by the end of the year. Markets see a next step possible at the September meeting. The krone intraday gained modest ground after the release with EUR/NOK 11.81 compared to a close of near 11.84 yesterday.
US Dollar Attempts a Rise After Beat in Jobless Claims
Forex markets have been taking what resembles a summer break, with two consecutive days of muted movements – Most major pairs are contained within a 300 pip range, but with the USD attempting a rally, let's see if this may add fuel to create some volatility.
The Weekly Jobless Claims report just came with a beat – 227K vs 235K expected and shows another sign of strength for US Employment. Claims had started to elevate in the middle of June but seems like it only was temporary as we just received another positive report.
The latest tariffs news were the announcement of 50% tariffs on Copper imports (questionable idea by the way, trying to relaunch US Industrial production and giving them higher import costs isn't the most viable thing, but markets are getting used to bad ideas from the Trump Administration), and also 50% tariffs on anything that comes from Brazil.
Let's take a look at the US Dollar as markets start to prepare for next week's US CPI Report.
Dollar Index 4H and 1H Analysis
DXY 4H Chart
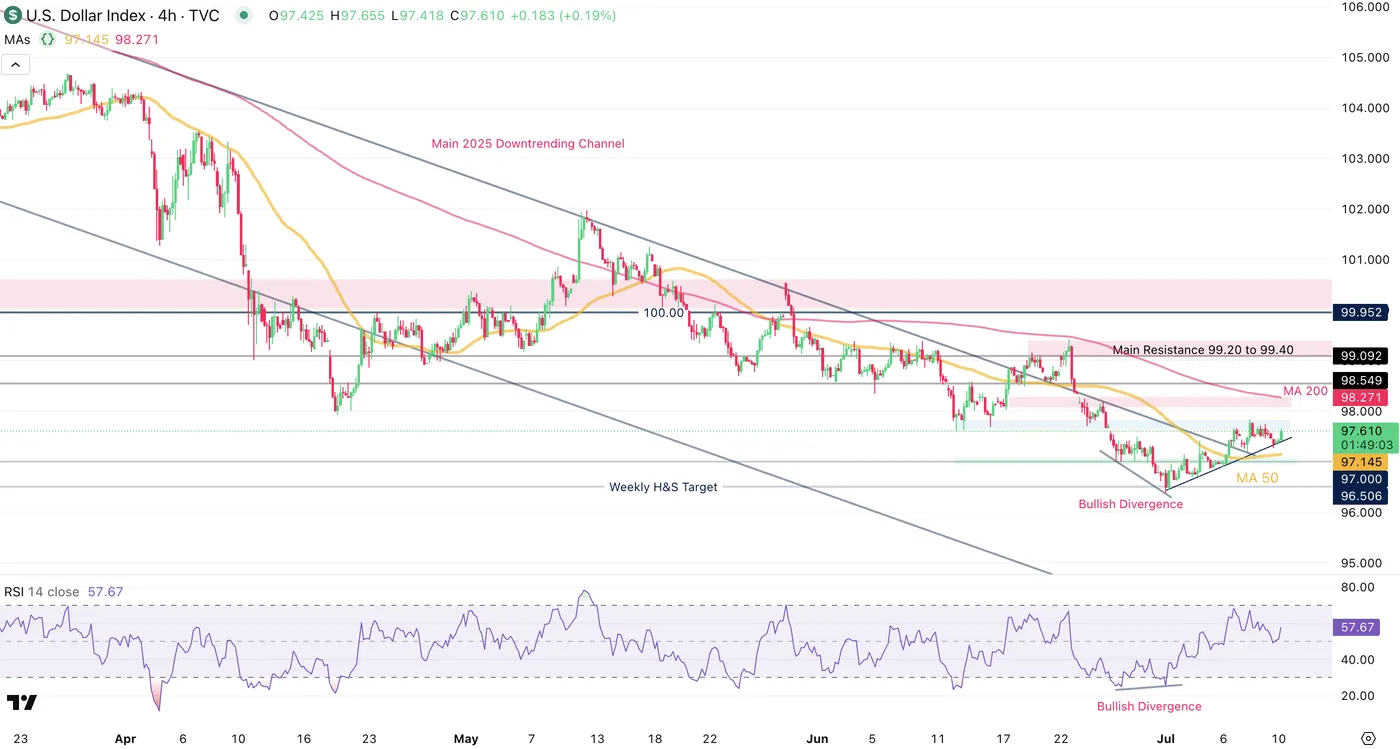
Dollar Index 4H Chart, July 10, 2025 – Source: TradingView
The US Dollar is currently breaking out from its 2025 Main descending channel after forming a bullish divergence with the last lows.
There had been a theme of imbalanced short positioning against the Greenback, which had started to be less interesting after the continuous drop down in the index throughout the first half – Particularly as US Data keeps surprising higher, postponing FED Cuts (and creating debate as to when they will actually be able to cut).
The breakout can be quite important for markets as flows markets may see some new trends in the second half that is just beginning.
There had been an upside breakout in June therefore markets may need a convincing breakout to estimate that the downtrend is completely unvalidated.
DXY 1H Chart
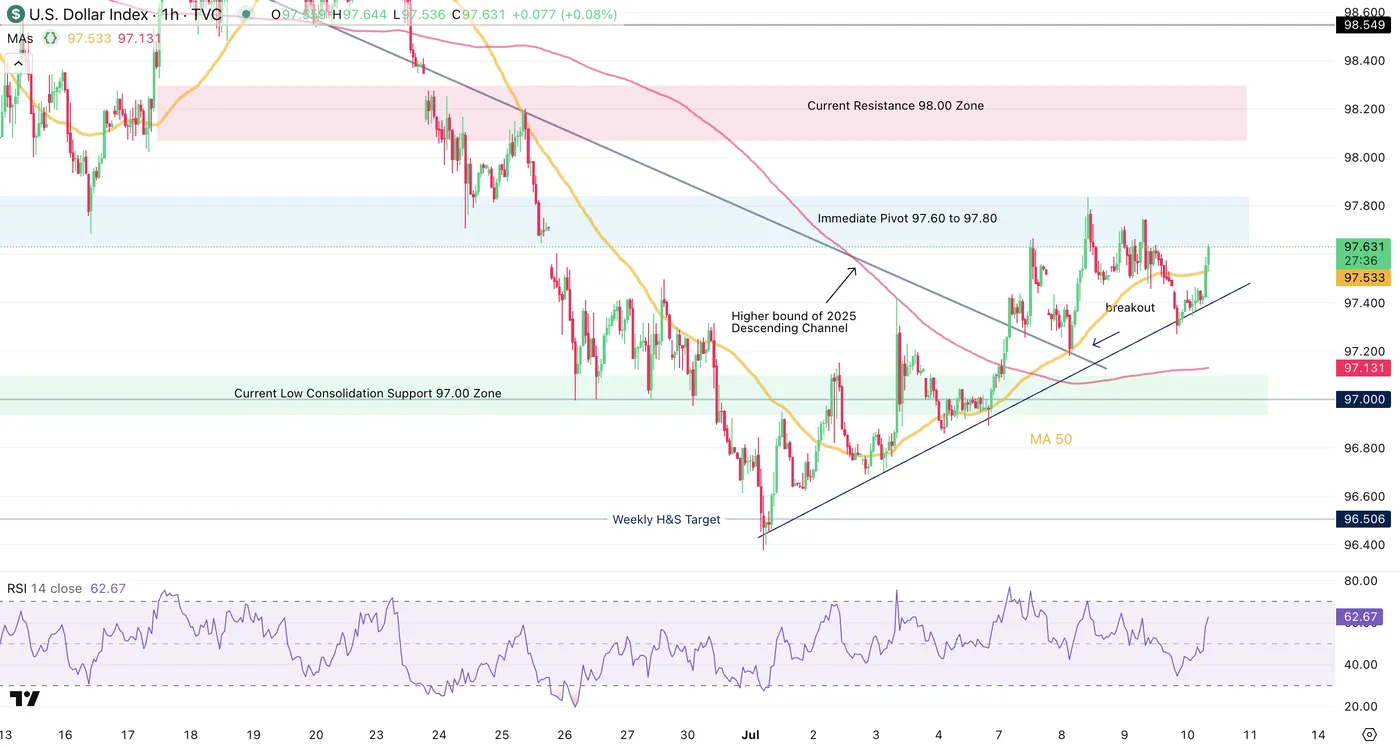
Dollar Index 1H Chart, July 10, 2025 – Source: TradingView
Looking closer at the Dollar Index breakout, Greenback buyers are using a bullish trendline from the lows to retest weekly highs (97.84).
Short-term momentum is strong, just having breached the 1H MA 50, however, any movement will have to break out either on the upside or the downside as the past few days of up and down movement may lead to a simple consolidation in a 45 pip range (97.25 to 97.70).
Levels of interest:
Support Zones
- Current Range Lows: 97.20
- Current Low Consolidation Support 97.00 Zone
- 2025 Lows 96.50
Resistance Zones
- Immediate Pivot 97.60 to 97.80
- Current Resistance 98.00 Zone
- 4H MA 200 98.20
- Main Resistance 99.20 to 99.40
Safe Trades!
EUR/USD Mid-Day Outlook
Daily Pivots: (S1) 1.1699; (P) 1.1714; (R1) 1.1739; More...
Intraday bias in EUR/USD remains neutral as consolidations continue below 1.1829. Downside of retreat should be contained by 1.1630 resistance turned support to bring rebound. On the upside, firm break of 1.1829 will resume the rise from 1.0176 and target 61.8% projection of 1.0176 to 1.1572 from 1.1064 at 1.1927.
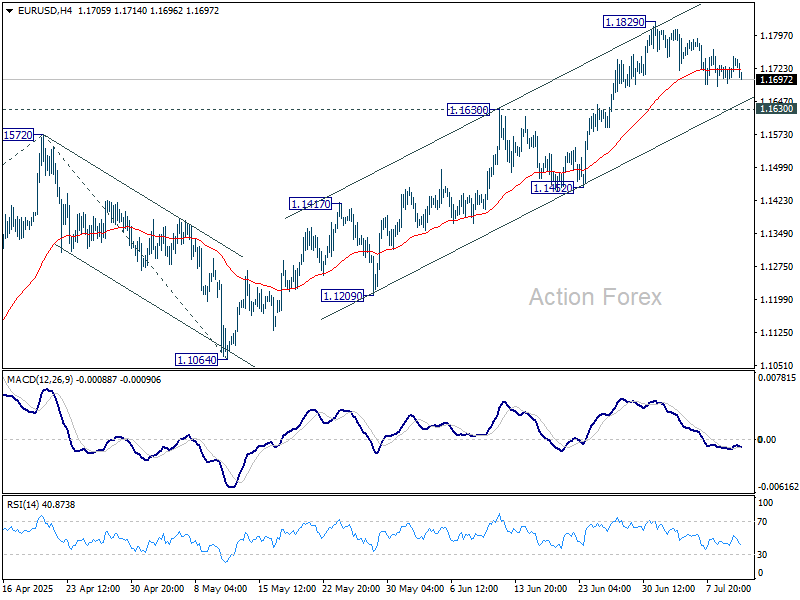
In the bigger picture, rise from 0.9534 long term bottom could be correcting the multi-decade downtrend or the start of a long term up trend. In either case, further rise should be seen to 100% projection of 0.9534 to 1.1274 from 1.0176 at 1.1916. This will now remain the favored case as long as 1.1604 support holds.

USD/CHF Mid-Day Outlook
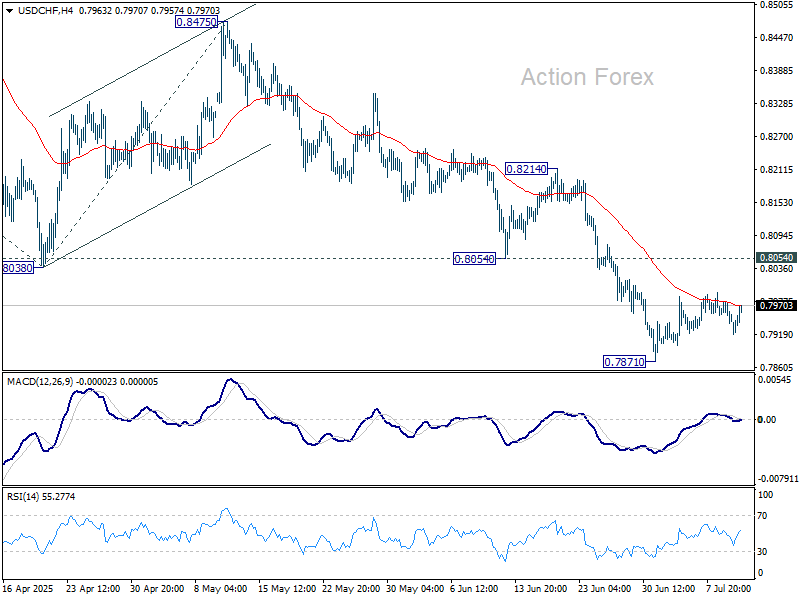
Daily Pivots: (S1) 0.7941; (P) 0.7954; (R1) 0.7968; More….
USD/CHF's consolidation from 0.7871 is still extending and intraday bias stays neutral. In case of stronger rebound, upside should be limited by 0.8054 support turned resistance to bring another fall. Below 0.7871 will extend the larger down trend to 61.8% projection of 0.9200 to 0.8038 from 0.8475 at 0.7757. Firm break there will pave the way to 100% projection at 0.7313 next.
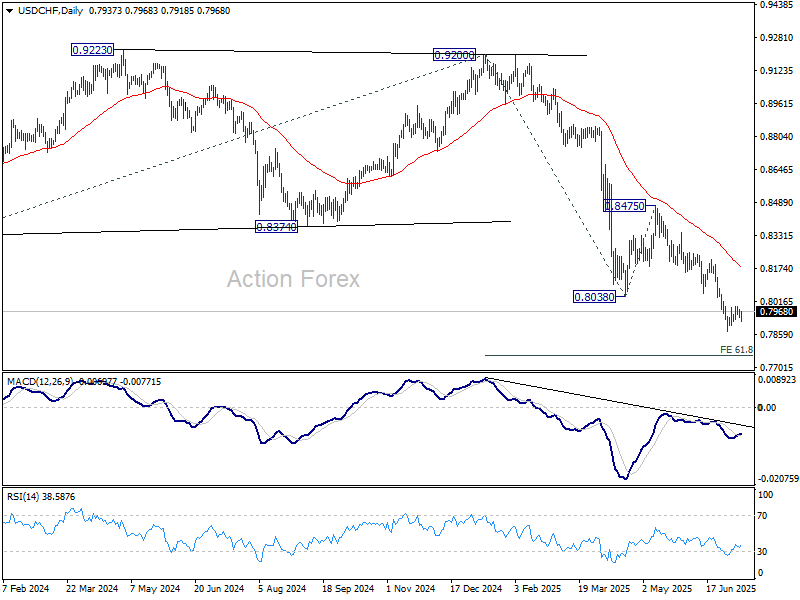
In the bigger picture, long term down trend from 1.0342 (2017 high) is still in progress. Next target is 100% projection of 1.0146 (2022 high) to 0.8332 from 0.9200 at 0.7382. In any case, outlook will stay bearish as long as 0.8475 resistance holds.
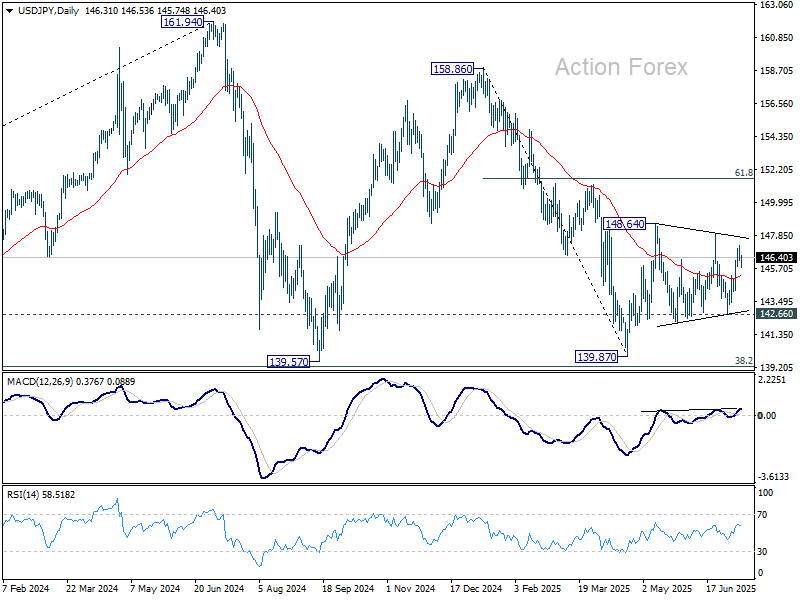
USD/JPY Mid-Day Outlook
Daily Pivots: (S1) 145.98; (P) 146.58; (R1) 146.91; More...
USD/JPY is still engaging in sideway trading and intraday bias remains neutral. On the upside, firm break of 148.01 resistance will resume the rise from 139.87 to 61.8% retracement of 158.86 to 139.87 at 151.22. However, break of 142.66 will bring deeper fall back to retest 139.87 low.
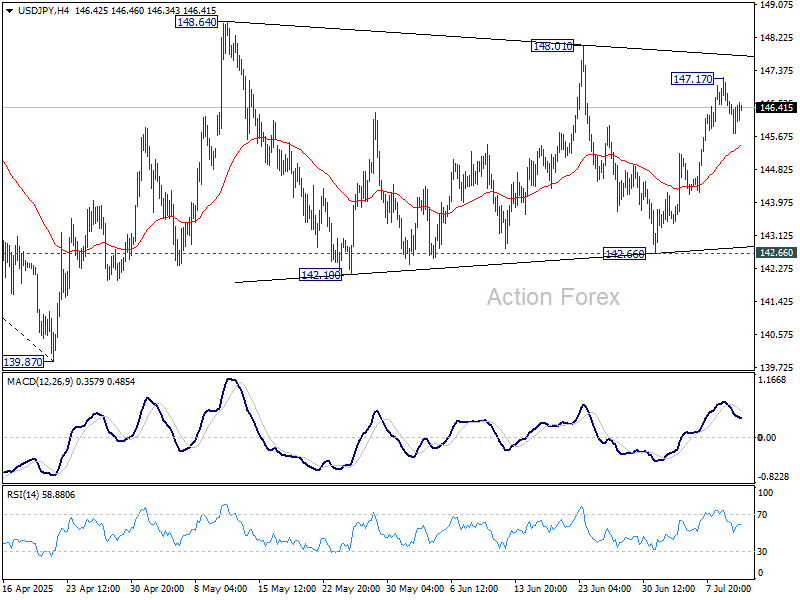
In the bigger picture, price actions from 161.94 (2024 high) are seen as a corrective pattern to rise from 102.58 (2021 low). There is no clear sign that the pattern has completed yet. But still, strong support is expected from 38.2% retracement of 102.58 to 161.94 at 139.26 to bring rebound.
GBP/USD Mid-Day Outlook
Daily Pivots: (S1) 1.3560; (P) 1.3590; (R1) 1.3616; More...
No change in GBP/USD's outlook as corrective pullback from 1.3787 is still extending. Intraday bias stays neutral first. Downside is expected to be contained by 1.3369 support to bring rebound. On the upside, above 1.3680 minor resistance will bring retest of 1.3787. Firm break of 1.3787 will resume larger up trend to 100% projection of 1.2099 to 1.3206 from 1.3138 at 1.3813.
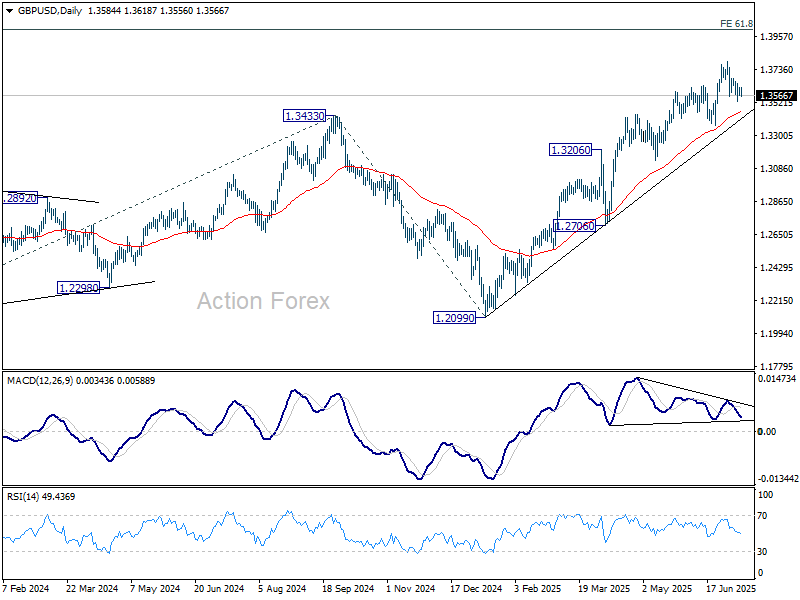
In the bigger picture, up trend from 1.3051 (2022 low) is in progress. Next medium term target is 61.8% projection of 1.0351 to 1.3433 from 1.2099 at 1.4004. Outlook will now stay bullish as long as 55 W EMA (now at 1.2985) holds, even in case of deep pullback.
Mining Rally Lifts FTSE; Markets Shrug Off Expanding US Tariffs
Risk appetite remains solid in Europe, with the FTSE 100 hitting a fresh record high as traders look through escalating US trade actions. US equity futures are holding steady too, and markets are showing little fear that the widening scope of tariffs will derail global growth. The upbeat mood comes despite US President Donald Trump’s latest tariff letters targeting 21 countries and a surprise 50% duty on Brazilian goods.
Mining stocks are leading the FTSE advance, bolstered by surging copper prices and rising US premiums amid Trump’s looming 50% copper tariff set to take effect August 1. The global copper market has entered a state of dislocation, and traders are scrambling to secure US-bound supply. That’s feeding optimism for producers, for the near term at least, and adding fuel to equity gains across Europe’s commodity-heavy indexes.
The rally also found support from upbeat signals out of China, where a reported rise in construction machinery sales is viewed as a positive sign for the country's industrial sector. The data suggests that domestic infrastructure activity remains resilient, offering a degree of insulation to global supply chains despite mounting trade headwinds.
Sentiment in the UK has also been buoyed by the early trade agreement secured with the US, allowing Britain to avoid the steepest tariffs imposed elsewhere. While uncertainty persists for other major economies—especially those among the 21 recipients of Trump’s tariff letters—London’s relative insulation is helping drive capital inflows and stock outperformance.
In currency markets, Dollar continues to dominate, picking up momentum again as trading enters US session. Aussie is the second strongest for the week so far, supported by risk-on flows, firm commodity prices, and RBA’s surprise decision to hold rates earlier. Swiss Franc is the third strongest, suggesting some investors are hedging against lingering volatility. On the flip side, Yen remains the weakest, followed by Kiwi and Euro. Sterling and Loonie are trading in the middle of the pack.
In Europe, at the time of writing, FTSE is up 0.92%. DAX is up 0.03%. CAC is up 0.32%. UK 10-year yield is down -0.011 at 4.595. Germany 10-year yield is up 0.008 at 2.684. Earlier in Asia, Nikkei fell -0.44%. Hong Kong HSI rose 0.57%. China Shanghai SSE rose 0.48%. Singapore Strait Times rose 0.44%. Japan 10-year JGB yield fell -0.01 to 1.497.
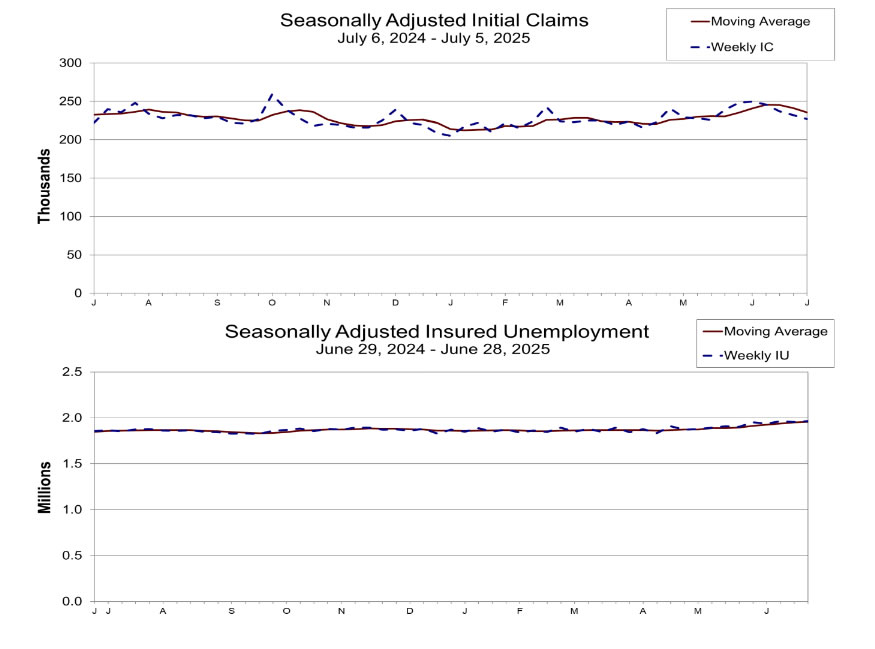
US initial jobless claims fall to 227k, below expectation 236k
US initial jobless claims fell -5k to 227k in the week ending July 5, below expectation of 236k. Four-week moving average of initial claims fell -6k to 236k.
Continuing claims rose 10k to 1965k in the week ending June 28, highest since November 13, 2021. Four-week moving average of continuing claims rose 3.5k to 1955k, highest since November 20, 2021.
BoJ regional report highlights business uncertainty amid tariff risks
BoJ's regional branch managers reported that while higher US tariffs have yet to significantly dent Japan’s exports or factory activity, companies are starting to hold back on capital expenditure.
Uncertainty over US trade policy, driven by President Trump’s rapid and unpredictable tariff announcements, has made it difficult for firms to fully assess the potential economic impact. While concrete damage has not yet materialized, the lack of clarity is beginning to influence strategic planning. "Many regions saw companies voice concern about slumping demand from rising US sales prices and a slowdown in the global economy," BoJ said.
Wage developments are another key theme in the survey. The outlook is split: some companies foresee the need to raise wages to attract and retain talent, while others are already hinting at bonus cuts should profit margins come under pressure.
Japan's PPI slows to 2.9% yoy in June, stronger Yen helps ease import costs
Japan's Producer Price Index rose 2.9% yoy in June, easing from May’s 3.3% yoy pace and in line with expectations. The slowdown reflects a moderation in upstream price pressures, as firms begin to benefit from a firmer Yen.
Yen-based import price index dropped -12.3% yoy from a year earlier, deepening from May’s -10.3% yoy fall and signaling that Japan’s currency rebound is dampening raw material costs. Food and beverage prices remained elevated with a 4.5% yoy increase, largely due to persistently high rice costs, though that was slightly softer than the prior month’s 4.7% yoy rise.
GBP/USD Mid-Day Outlook
Daily Pivots: (S1) 1.3560; (P) 1.3590; (R1) 1.3616; More...
No change in GBP/USD's outlook as corrective pullback from 1.3787 is still extending. Intraday bias stays neutral first. Downside is expected to be contained by 1.3369 support to bring rebound. On the upside, above 1.3680 minor resistance will bring retest of 1.3787. Firm break of 1.3787 will resume larger up trend to 100% projection of 1.2099 to 1.3206 from 1.3138 at 1.3813.
In the bigger picture, up trend from 1.3051 (2022 low) is in progress. Next medium term target is 61.8% projection of 1.0351 to 1.3433 from 1.2099 at 1.4004. Outlook will now stay bullish as long as 55 W EMA (now at 1.2985) holds, even in case of deep pullback.
US initial jobless claims fall to 227k, below expectation 236k
US initial jobless claims fell -5k to 227k in the week ending July 5, below expectation of 236k. Four-week moving average of initial claims fell -6k to 236k.
Continuing claims rose 10k to 1965k in the week ending June 28, highest since November 13, 2021. Four-week moving average of continuing claims rose 3.5k to 1955k, highest since November 20, 2021.