
Sample Category Title
EUR/CHF Daily Outlook
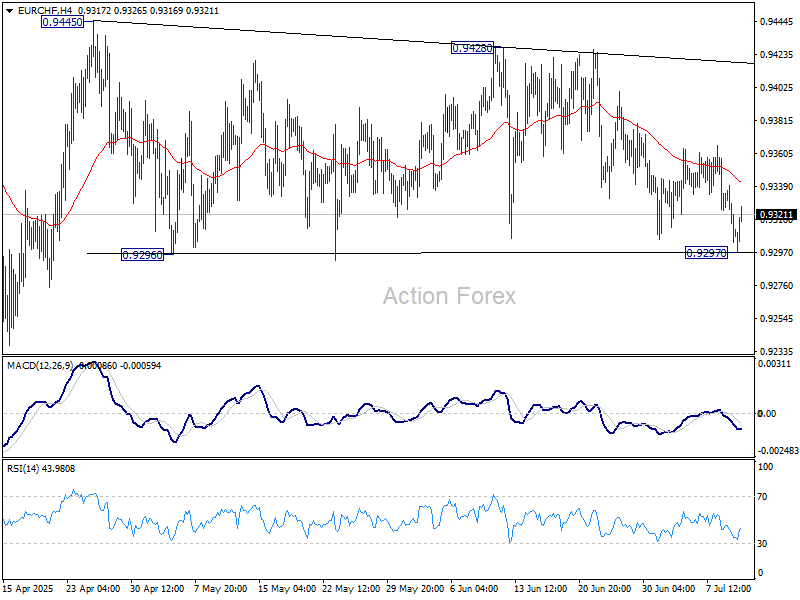
Daily Pivots: (S1) 0.9296; (P) 0.9319; (R1) 0.9335; More....
EUR/CHF dipped to 0.9297 but quickly recovered. Intraday bias stays neutral at this point. On the upside, break of 0.9428/45 resistance zone will resume the rebound from 0.9218. On the downside, break of 0.9297 will bring retest of 0.9218 low instead.
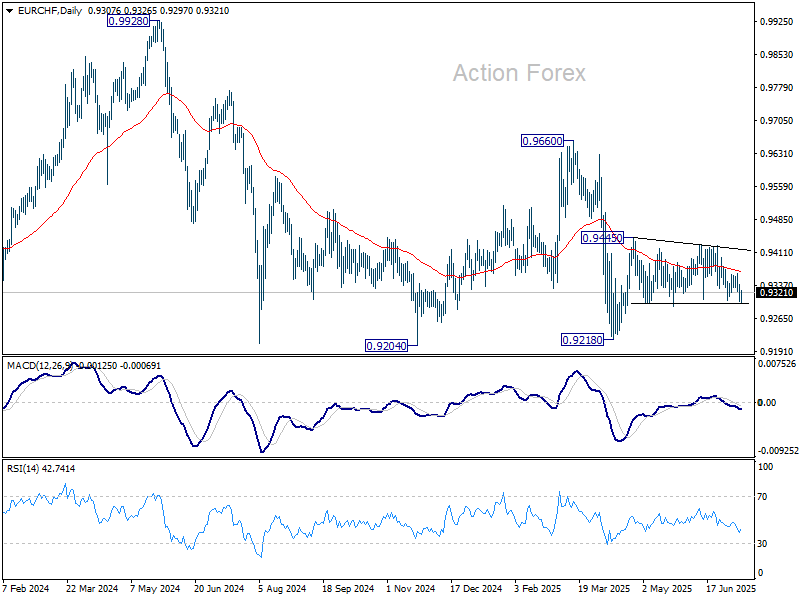
In the bigger picture, while downside momentum has been diminishing as seen in W MACD, there is no sign of bottoming yet. EUR/CHF is still staying below 55 W EMA (now at 0.9433) and well inside long term falling channel. Outlook will stay bearish as long as 0.9660 resistance holds. Break of 0.9204 (2024 low) will confirm resumption of down trend from 1.2004 (2018 high).
USD/CAD Daily Outlook
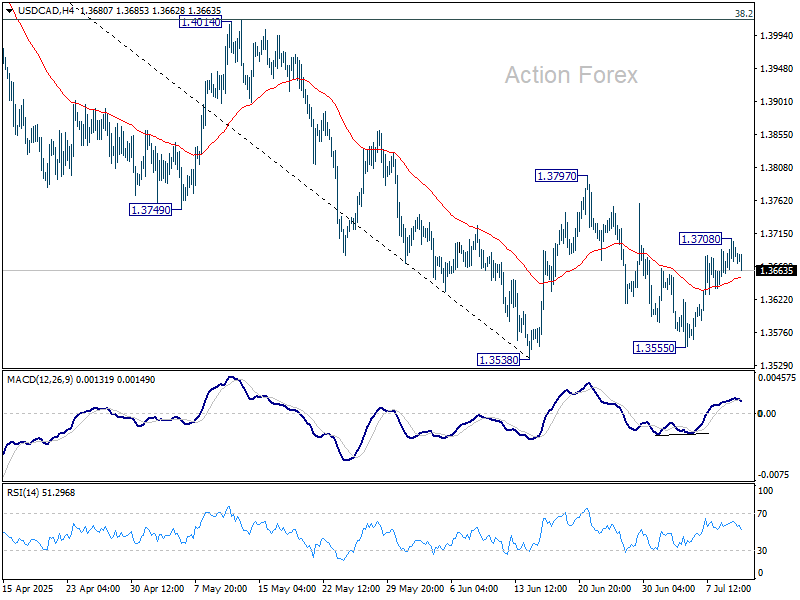
Daily Pivots: (S1) 1.3636; (P) 1.3666; (R1) 1.3692; More...
Intraday bias in USD/CAD is turned neutral with current retreat. Consolidative pattern from 1.3538 is in its third leg. Break of 1.3708 will target 1.3797 and possibly above. Nevertheless, on the downside, firm break of 1.3538/55 support zone will confirm resumption of whole decline from 1.4791.
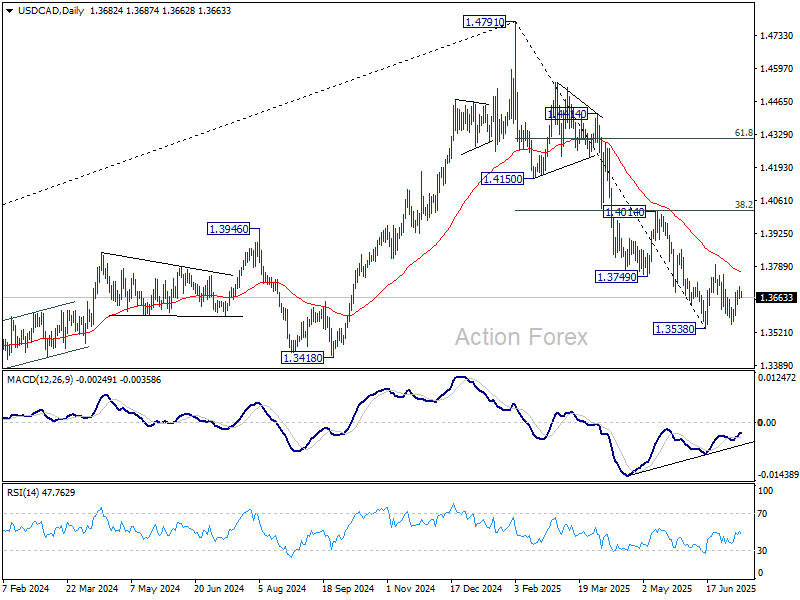
In the bigger picture, price actions from 1.4791 medium term top could either be a correction to rise from 1.2005 (2021 low), or trend reversal. In either case, further decline is expected as long as 1.4014 resistance holds. Next target is 61.8% retracement of 1.2005 (2021 low) to 1.4791 at 1.3069.
AUD/USD Daily Report
Daily Pivots: (S1) 0.6514; (P) 0.6531; (R1) 0.6552; More...
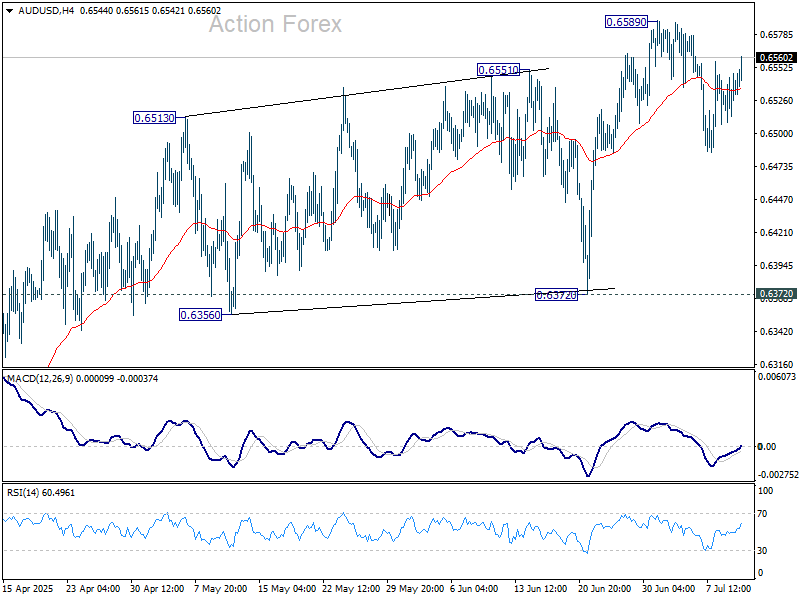
Intraday bias in AUD/USD remains neutral for the moment, and consolidations from 0.6589 could extend. But overall, further rally is expected as long as 0.6372 support holds. On the upside, firm break of 0.6589 will resume the rise from 0.5913 and target 0.6713 fibonacci level.
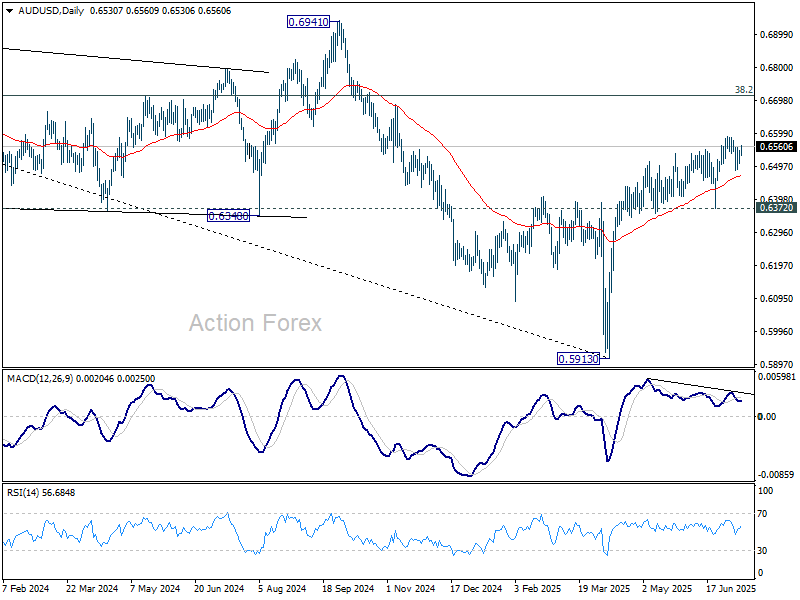
In the bigger picture, there is no clear sign that down trend from 0.8006 (2021 high) has completed. Rebound from 0.5913 is seen as a corrective move. While stronger rally cannot be ruled out, outlook will remain bearish as long as 38.2% retracement of 0.8006 to 0.5913 at 0.6713 holds. Nevertheless, considering bullish convergence condition in W MACD, even in case of another fall through 0.5913, downside should be contained above 0.5506 (2020 low).
EUR/USD Daily Outlook
Daily Pivots: (S1) 1.1699; (P) 1.1714; (R1) 1.1739; More...
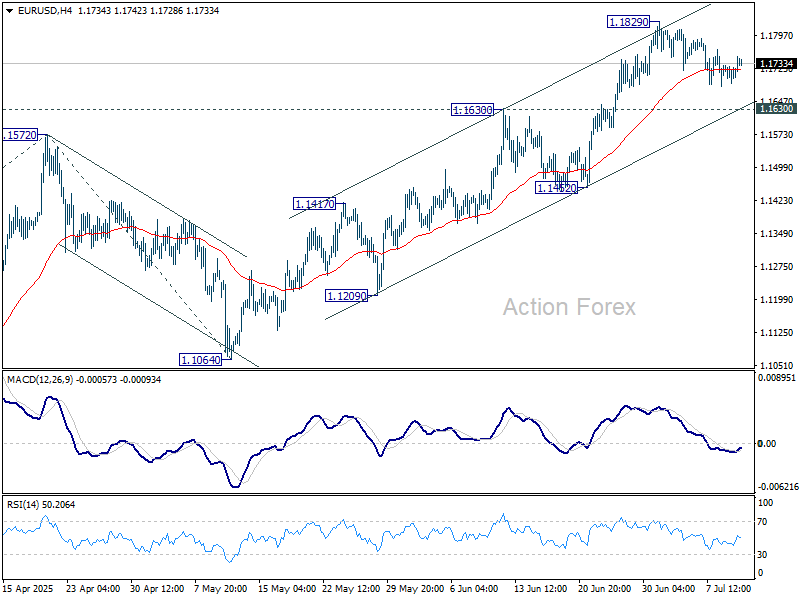
EUR/USD is still bounded in consolidations below 1.1829 and intraday bias remains neutral for the moment. Downside of retreat should be contained by 1.1630 resistance turned support to bring rebound. On the upside, firm break of 1.1829 will resume the rise from 1.0176 and target 61.8% projection of 1.0176 to 1.1572 from 1.1064 at 1.1927.
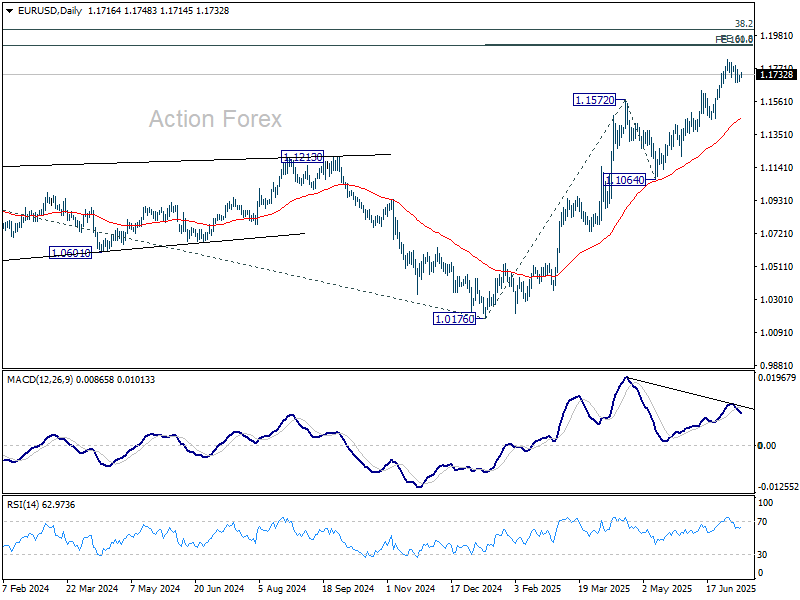
In the bigger picture, rise from 0.9534 long term bottom could be correcting the multi-decade downtrend or the start of a long term up trend. In either case, further rise should be seen to 100% projection of 0.9534 to 1.1274 from 1.0176 at 1.1916. This will now remain the favored case as long as 1.1604 support holds.
GBP/USD Daily Outlook
Daily Pivots: (S1) 1.3560; (P) 1.3590; (R1) 1.3616; More...
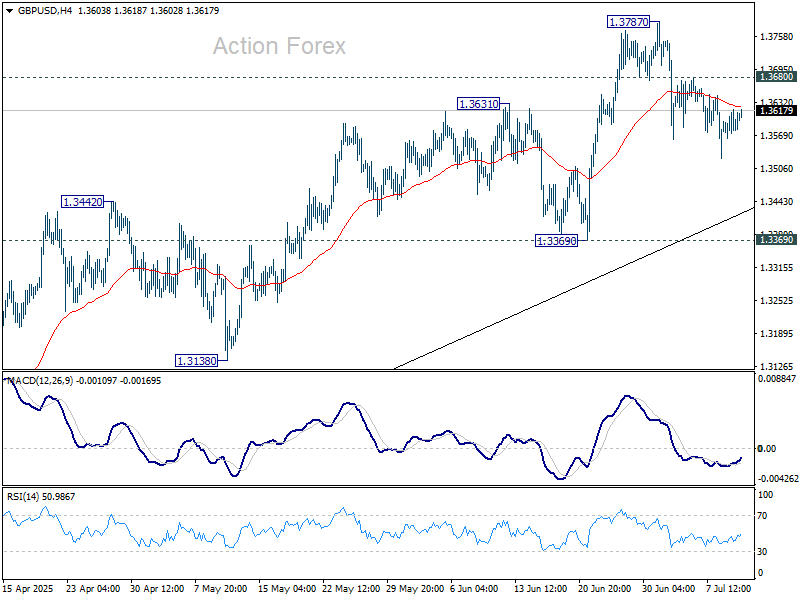
Intraday bias in GBP/USD remains neutral for the moment. While correction from 1.3787 could extend lower, downside downside should be contained by 1.3369 support to bring rebound. On the upside, above 1.3680 minor resistance will bring retest of 1.3787. Firm break of 1.3787 will resume larger up trend to 100% projection of 1.2099 to 1.3206 from 1.3138 at 1.3813.
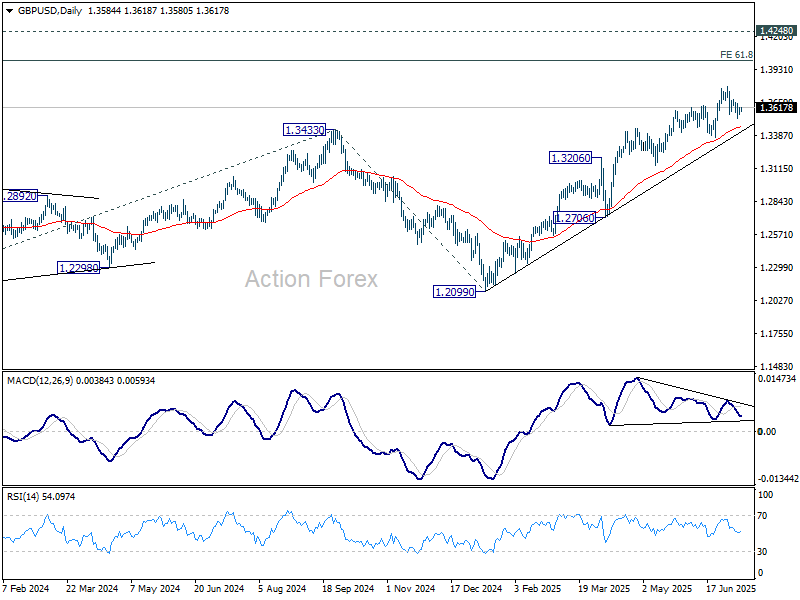
In the bigger picture, up trend from 1.3051 (2022 low) is in progress. Next medium term target is 61.8% projection of 1.0351 to 1.3433 from 1.2099 at 1.4004. Outlook will now stay bullish as long as 55 W EMA (now at 1.2985) holds, even in case of deep pullback.
USD/JPY Daily Outlook
Daily Pivots: (S1) 145.98; (P) 146.58; (R1) 146.91; More...
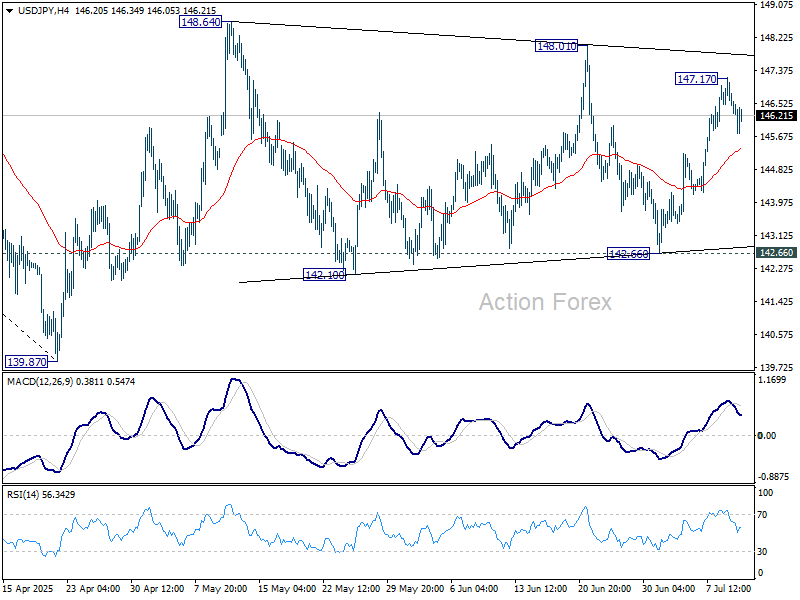
Range trading persists in USD/JPY and intraday bias stays neutral at this point. On the upside, firm break of 148.01 resistance will resume the rise from 139.87 to 61.8% retracement of 158.86 to 139.87 at 151.22. However, break of 142.66 will bring deeper fall back to retest 139.87 low.
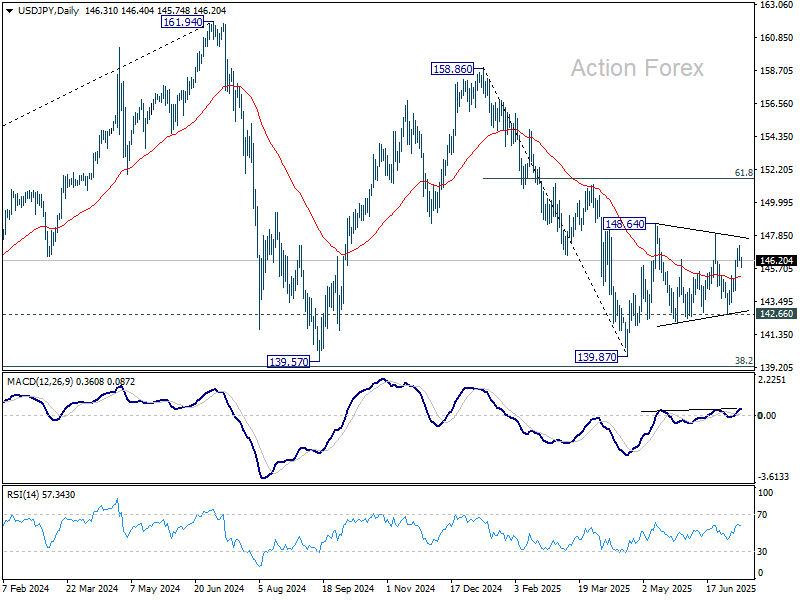
In the bigger picture, price actions from 161.94 (2024 high) are seen as a corrective pattern to rise from 102.58 (2021 low). There is no clear sign that the pattern has completed yet. But still, strong support is expected from 38.2% retracement of 102.58 to 161.94 at 139.26 to bring rebound.
Post-Close Tariff Announcements Have a Mild Impact
Markets
The steepening trend, fueled by investor worries on fiscal sustainability in multiple developed countries including the UK, Japan and the US gradually lost some momentum yesterday. After recent rise in LT risk premia at least some investors moved to a more neutral approach. Some high profile yields/resistance levels coming nearby was also in play. Later in US dealings, the move was validated by a solid $39 bln US Treasury 10-y note sale. US yields eased between 4.8 bps (2-y) and 6.7 bps (10-y). The Fed minutes of the June meeting showed ample uncertainty and a divide within the MPC on how tariffs will impact inflation going forward. This also translated into divergent views on the timing and the path of policy easing. However, that already appeared in the dot plot published at the time of the meeting. Some governors showed signs to be open for a July rate cut in case of soft data (Waller, Bowman), but this scenario in the meantime was ‘rejected’ by still decent US June payrolls published last week. German yields eased 1-2 bps across the curve. Equities remained well bid despite multiple trade noise. The Nasdaq (+ 0.94%) even closed at a record. Only limited moves in the major cross rates (DXY close at 97.55, EUR/USD 1.1725). Yen underperformance halted (USD/JPY close 146.33 from 146.58). After sending a new batch of tariff letters to countries earlier in the session, US president Trump after the close threatened to impose 50% levy on Brazil exports to the US, mainly inspired by a political rift with president Lula Da Silva. Later, he also confirmed the 50% tariff on copper to take effect on August 1. Brazilian assets are hit. USD/BRL jumped from the 5.50 area to close near 5.573.
The post-close tariff announcements this morning have a mild impact. Asian equity markets are trading mixed to modestly higher (South Korea and China a.o.). US equity futures are ceding modest ground (about -0.3%), as does the dollar (DXY 97.4, EUR/USD 1.174, USD/JPY 146.21). A 20-y Japan bond sale this morning was ok/neutral and might temper recent steepening trend, but uncertainty in the run-up to the July 20 Japan Upper House elections persists. Today’s eco calendar is again thin. US jobless claims in the current environment still might cause intraday volatility. Markets will look out whether a $22 bln 30-y US Note auction can copy yesterday’s benign 10-y performance. Trade(war) noise evidently will continue to swirl.
News & Views
The central bank of South Korea left its policy rate unchanged at 2.5%. The status quo was expected and comes as the Bank of Korea is striking a balance between having an accommodative policy to support an economy hit by trade uncertainty while watching potential imbalances fueled by booming house prices. South Korea was informed earlier this week of a 25% levy on its US exports. But the starting date, August 1, offers extra time for negotiations. Meanwhile the SK government is planning regulations to reign in (household) property borrowing. The BoK found the most prudent thing to do was to wait before making its next easing move. The decision was unanimous though four of the six members signaled openness to a cut in the next three months. The next BoK meeting takes place on August 28. The South Korean currency trades little changed in response to the policy outcome (USD/KRW 1373.4).
S&P Global Market Intelligence in its tri-annual report found that German companies are the most optimistic about the economy since early 2022. The survey of around 12000 manufacturers and service providers also showed willingness to invest: for the first time in two years companies are planning to increase capex and R&D spending outweigh those anticipating cuts. Businesses referred to the government’s spending boost as supporting an economic upturn while further gains are seen by expanding into new markets, the adoption of technologies such as AI and digitalization that can improve efficiency. However, S&P Global adds that growth forecasts and investments intentions are still running below pre-pandemic averages amid geopolitical concerns and increased US protectionism.
The $4-Trillion Nvidia
The tariff-reveal letters kept coming in yesterday — in alphabetical order — and they didn’t look enchanting, to say the least. Exports from Algeria, Libya, Iraq, and Sri Lanka will be subject to 30% levies. Brunei and Moldovan exporters will pay 25%, while Brazilian exports will be hit with a hefty 50% tariff. So far, tariff rates range between 25% and 50% — except for the UK, which managed to pull a relatively modest 10%, while the EU is still waiting for its verdict. The latest reports suggest that European tariffs could be higher than the UK’s 10%, but markets simply don’t care.
The Stoxx 600 rallied yesterday to 550, while US equities also enjoyed a bullish session. The S&P 500 gained 0.61%, and the Nasdaq 100 hit a fresh intraday high — fueled by a more than 2% jump in Nvidia at one point, making the AI kingpin the first company to reach a $4 trillion valuation.
Of course, we can’t say Nvidia didn’t deserve the title — and I believe there’s more to come. The company is navigating the trade and political jungle with remarkable agility. Its efforts to replace Chinese business with promising new partners — led by Europe and the Middle East — are already bearing fruit. There’s a chance tensions with China will ease. And CEO Jensen Huang is already looking beyond AI — to robotics — to stay ahead of the pack. Nvidia offers an entire ecosystem for companies willing to take the AI leap.
Frankly, we're just at the dawn of the AI era. The next milestone will be the fusion of AI with robotics — a synergy that gives AI hands, feet, and a body. That’s what could truly catapult us into a Jetsons-like future. It’s all very exciting. And the rally we’re seeing in Nvidia is not just about speculation — it’s not merely based on what the company has achieved, but on what it could achieve. And that potential is enormous.
Price-wise, Nvidia has more than doubled in value since the April dip. The stock is up over 1,000% since the launch of ChatGPT — the first moment AI was truly introduced to Mr. and Mrs. Everybody. A period of consolidation wouldn’t be surprising. Still, the outlook remains positive.
Valuation-wise, Nvidia is richly priced, with a P/E ratio near 52 — but that may ease once the next earnings are announced. The company is expected to report $45 billion in Q2 sales, which would pull the P/E back into the 40s. TSMC's Q2 sales came in above expectations despite appreciation of the Taiwanese dollar.
Of course, trade tensions and tariffs are a risk, as is competition. Greater AI adoption could shift part of the demand toward cheaper alternatives (AMD). But Trump’s ‘Bring Manufacturing Back to America’ policies will likely accelerate AI adoption — because automation is the only realistic way to re-shore production and keep costs under control.
Back to the present: newswires remain hectic. It’s all tariffs, tension, and chaos — but markets have an extraordinary capacity to adapt. Trade developments are quickly becoming the new normal; they no longer hammer sentiment the way they once did.
What could jolt markets is when all this starts showing up in the data — through slower growth or higher inflation. Until then, the music plays on.
Amazon, which had a weak start to ‘Prime Day’ week, is not doing too badly. Adobe estimates suggest first-day sales grew 10% year-over-year.
Meanwhile, the latest FOMC minutes released yesterday boosted optimism that the Federal Reserve (Fed) will cut rates later this year — come hell or high water. However, officials are split on the medium-to-long-term impact of tariff-driven inflation. Some believe it will be short-lived and contained, while others warn it could prove sticky and require a more forceful policy response. Time will tell.
In FX and commodities, the US dollar is losing its early-week momentum, pressured by unhelpful trade headlines and a dovish tilt in Fed expectations. The US 2-year yield fell to 3.85% yesterday — a level that implies two rate cuts this year, which appears unlikely, but views differ. Goldman Sachs’ chief economist still expects three cuts this year, while a strategist at the Bank of America warns that stagflation could limit easing and advise favouring value over growth, dividend-paying stocks, and well-capitalized tech firms.
In sovereigns, long-dated US Treasuries benefited from strong demand at this week’s auctions — a sign that markets are adjusting to Washington’s spend-heavy posture. In Japan, long-dated yields fell ahead of the 20-year bond auction. The fact that the 30-year JGB yield is now around — and above — 3% remains a risk to global risk assets and is worth watching closely.
In energy, WTI crude continues to test its 200-day moving average, helped by a softer dollar. In metals, the widening price gap between US copper and global benchmarks is notable. It supports appetite for US copper miners, but it’s bad for: foreign miners, US industries and US inflation.
USD/CHF Daily Outlook
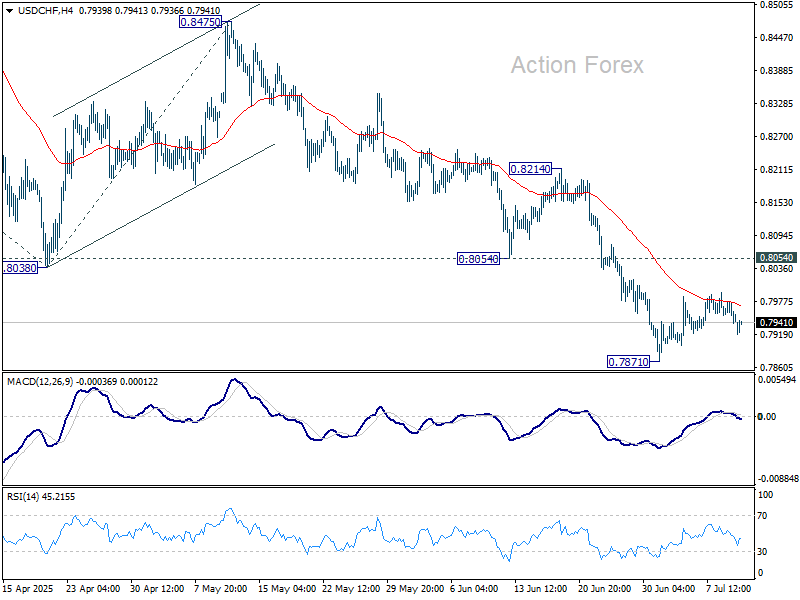
Daily Pivots: (S1) 0.7941; (P) 0.7954; (R1) 0.7968; More….
USD/CHF dipped after rejection by 55 4H EMA but stays above 0.7871 support. Intraday bias remains neutral for the moment. Consolidations could extend and another rise cannot be ruled out. But , upside should be limited by 0.8054 support turned resistance to bring another fall. Below 0.7871 will extend the larger down trend to 61.8% projection of 0.9200 to 0.8038 from 0.8475 at 0.7757. Firm break there will pave the way to 100% projection at 0.7313 next.
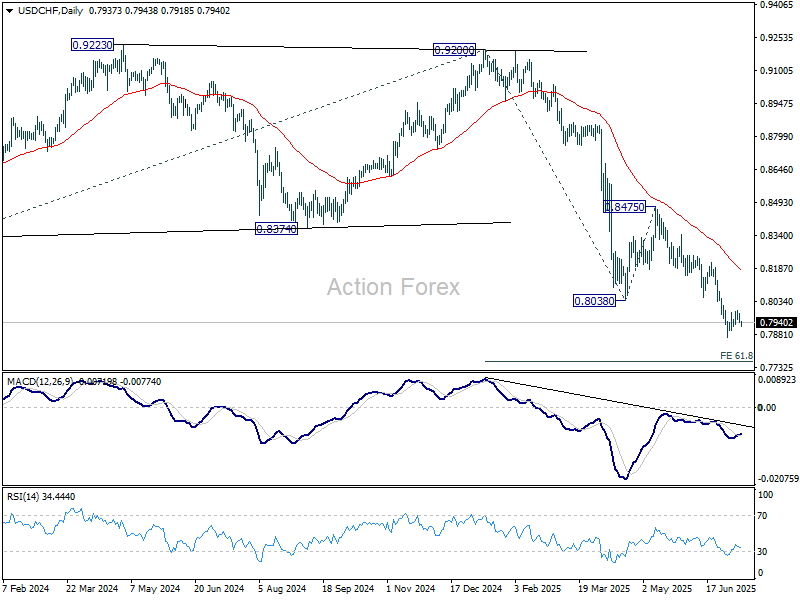
In the bigger picture, long term down trend from 1.0342 (2017 high) is still in progress. Next target is 100% projection of 1.0146 (2022 high) to 0.8332 from 0.9200 at 0.7382. In any case, outlook will stay bearish as long as 0.8475 resistance holds.
Trade War Spreads to Brazil, Dollar Reversing, Bitcoin Hits Record
Risk appetite has remained firm across global equities this week, with NASDAQ hitting a fresh record high overnight and S&P 500 and DOW also closing in the green. These gains followed similar moves in Europe, where Germany’s DAX notched another record. However, the mood in Asia has been less upbeat. Japan’s Nikkei slipped into negative territory, pressured by concerns over US tariffs. The 25% duty imposed on Japanese goods has clearly weighed on sentiment, contrasting with the broader global resilience.
In the currency markets, price action has been more muted. Dollar remains the strongest major currency for the week, but it's beginning to show signs of a near-term reversal. The latest FOMC minutes revealed a deeply divided committee, with some members focused on rising inflation risks while others remain concerned about a weakening labor market and activity — a classic reflection of stagflation worries. This policy split is understandable, given the uncertain economic impact of tariffs and how they could simultaneously push prices higher while dampening demand.
Outside Dollar, the Swiss Franc and Aussie are gaining ground, eyeing a takeover in relative strength rankings. Yen is the weakest, hurt by tariffs. Kiwi and Loonie are also underperforming, while Euro and pound are stuck in the middle.
On the trade front, tensions escalated further. US President Donald Trump informed Brazil that its “reciprocal” tariff would rise from 10% to 50% effective August 1, citing national security concerns and referencing Brazil’s handling of former President Bolsonaro’s prosecution. Brazilian President Luiz Inácio Lula da Silva pledged to respond in kind, invoking a new economic reciprocity law that permits countermeasures. Lula’s strongly worded response emphasized Brazil’s sovereignty and refusal to accept external pressure.
Trump also confirmed a new 50% tariff on all US copper imports starting August 1, citing a Section 232 national security review. The move sent copper prices sharply higher, though near-term technicals suggest the rally may be losing steam. Meanwhile, US–EU negotiations are ongoing, with reports of potential compromises on auto tariffs through quota limits, tariff reductions, or credit systems aimed at shielding European carmakers.
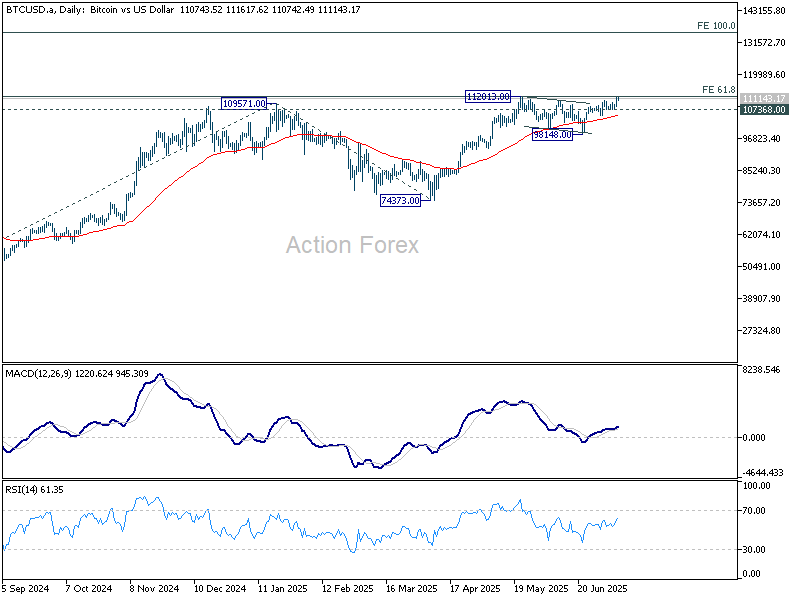
Technically, Bitcoin made a new record high by a hair today but struggles to extend rally. Nevertheless, near term outlook will stay bullish as long as 107368 support holds. Sustained trading above 61.8% projection of 49008 to 109571 from 74373 at 111800 will pave the way 100% projection at 134946. However, break of 107368 will delay the bullish case and bring more consolidations.
In Asia, at the time of writing, Nikkei is down -0.66%. Hong Kong HSI is up 0.36%. China Shanghai SSE is up 0.66%. Singapore Strait Times is up 0.44%. Japan 10-year JGB yield is down -0.015 at 1.492. Overnight, DOW rose 0.49%. S&P 500 rose 0.61%. NASDAQ rose 0.94%. 10-year yield fell -0.073 to 4.342.
Fed minutes reveal deep division on rate path
Minutes from the FOMC’s June 17–18 meeting highlighted a notable divergence among policymakers on whether rate cuts are needed this year. "Most participant" still see at least one cut as likely, citing temporary tariff effects, stable inflation expectations, and signs of cooling in the labor market. "A couple" went further, indicating they would be open to a rate cut at the upcoming July meeting if economic data confirms their outlook.
However, "some participants" pushed back against easing and suggested ""no reductions" this year, pointing to stubbornly high inflation and warning of upside risks. They argued that "upside risks to inflation remained meaningful", with businesses and consumers still expecting higher prices, and with economic activity holding up, rate cuts could be premature. Several added that "may not be far above its neutral level", diminishing the case for near-term action.
Participants generally agreed that risks of both elevated inflation and a weakening labor market have eased somewhat, but remain elevated. "Some" emphasized inflation risks as still "more prominent", while "a few" flagged labor market deterioration as the more pressing concern. The broad message from the minutes was one of uncertainty, with many policymakers seeing the need take a "careful approach" in adjusting monetary policy.
Japan's PPI slows to 2.9% yoy in June, stronger Yen helps ease import costs
Japan's Producer Price Index rose 2.9% yoy in June, easing from May’s 3.3% yoy pace and in line with expectations. The slowdown reflects a moderation in upstream price pressures, as firms begin to benefit from a firmer Yen.
Yen-based import price index dropped -12.3% yoy from a year earlier, deepening from May’s -10.3% yoy fall and signaling that Japan’s currency rebound is dampening raw material costs. Food and beverage prices remained elevated with a 4.5% yoy increase, largely due to persistently high rice costs, though that was slightly softer than the prior month’s 4.7% yoy rise.
USD/CHF Daily Outlook
Daily Pivots: (S1) 0.7941; (P) 0.7954; (R1) 0.7968; More….
USD/CHF dipped after rejection by 55 4H EMA but stays above 0.7871 support. Intraday bias remains neutral for the moment. Consolidations could extend and another rise cannot be ruled out. But , upside should be limited by 0.8054 support turned resistance to bring another fall. Below 0.7871 will extend the larger down trend to 61.8% projection of 0.9200 to 0.8038 from 0.8475 at 0.7757. Firm break there will pave the way to 100% projection at 0.7313 next.
In the bigger picture, long term down trend from 1.0342 (2017 high) is still in progress. Next target is 100% projection of 1.0146 (2022 high) to 0.8332 from 0.9200 at 0.7382. In any case, outlook will stay bearish as long as 0.8475 resistance holds.