Sample Category Title
NASDAQ (NQ_F) Elliott Wave: Forecasting the Rally From the Equal Legs Zone
Hello fellow traders. In this technical article we’re going to look at the Elliott Wave charts of NASDAQ (NQ_F) published in members area of the website. As our members know, $NQ_F is forming impulsive bullish sequences in the cycle from the 16441.7 low. Recently, we forecasted the end of the short-term pull back and called for a further rally. In the following text, we’ll explain the Elliott Wave analysis and present target areas.
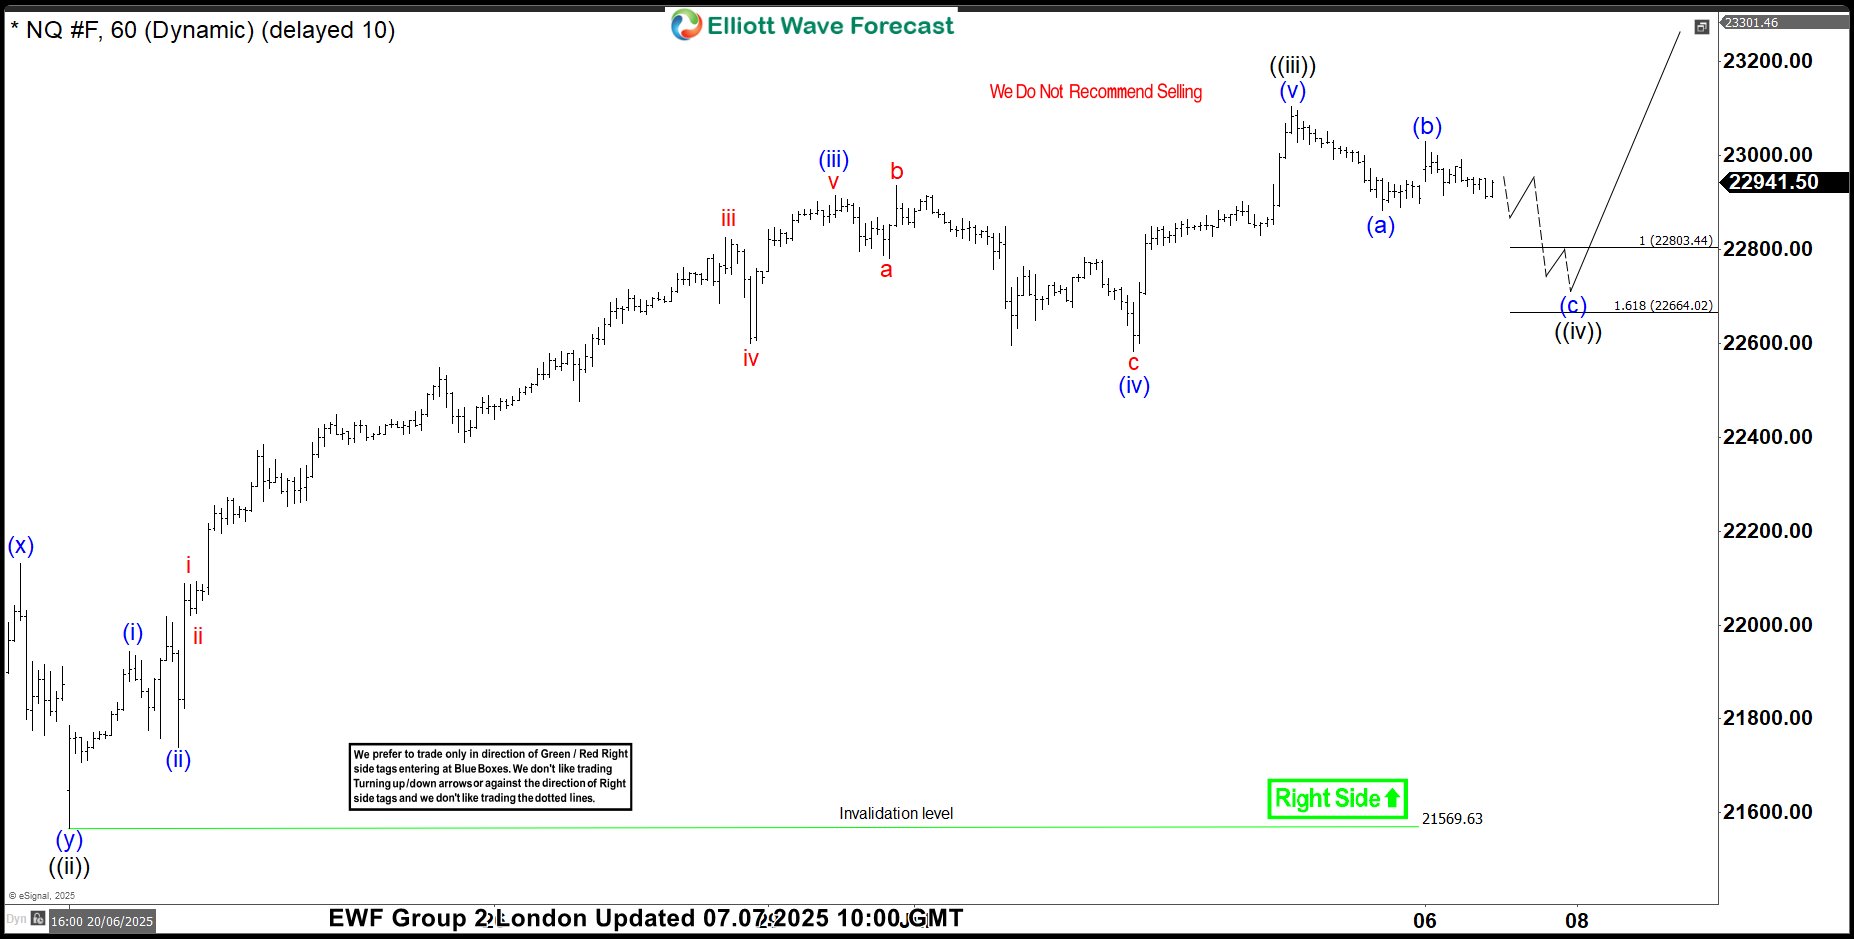
NQ_F Elliott Wave 1 Hour Chart 07.07.2025
NASDAQ is forming a three-wave pullback which still looks incomplete at the moment. Our members know that we can easily identify the reversal area by measuring the Equal Legs zone, (a) related (b), which comes in at the 22803.44-22664.02 area. We expect buyers to appear within the mentioned zone and to see a further rally in NASDAQ ($NQ_F) from there.
You can learn more about Elliott Wave Patterns at our Free Elliott Wave Educational Web Page
90% of traders fail because they don’t understand market patterns. Are you in the top 10%? Test yourself with this advanced Elliott Wave Test
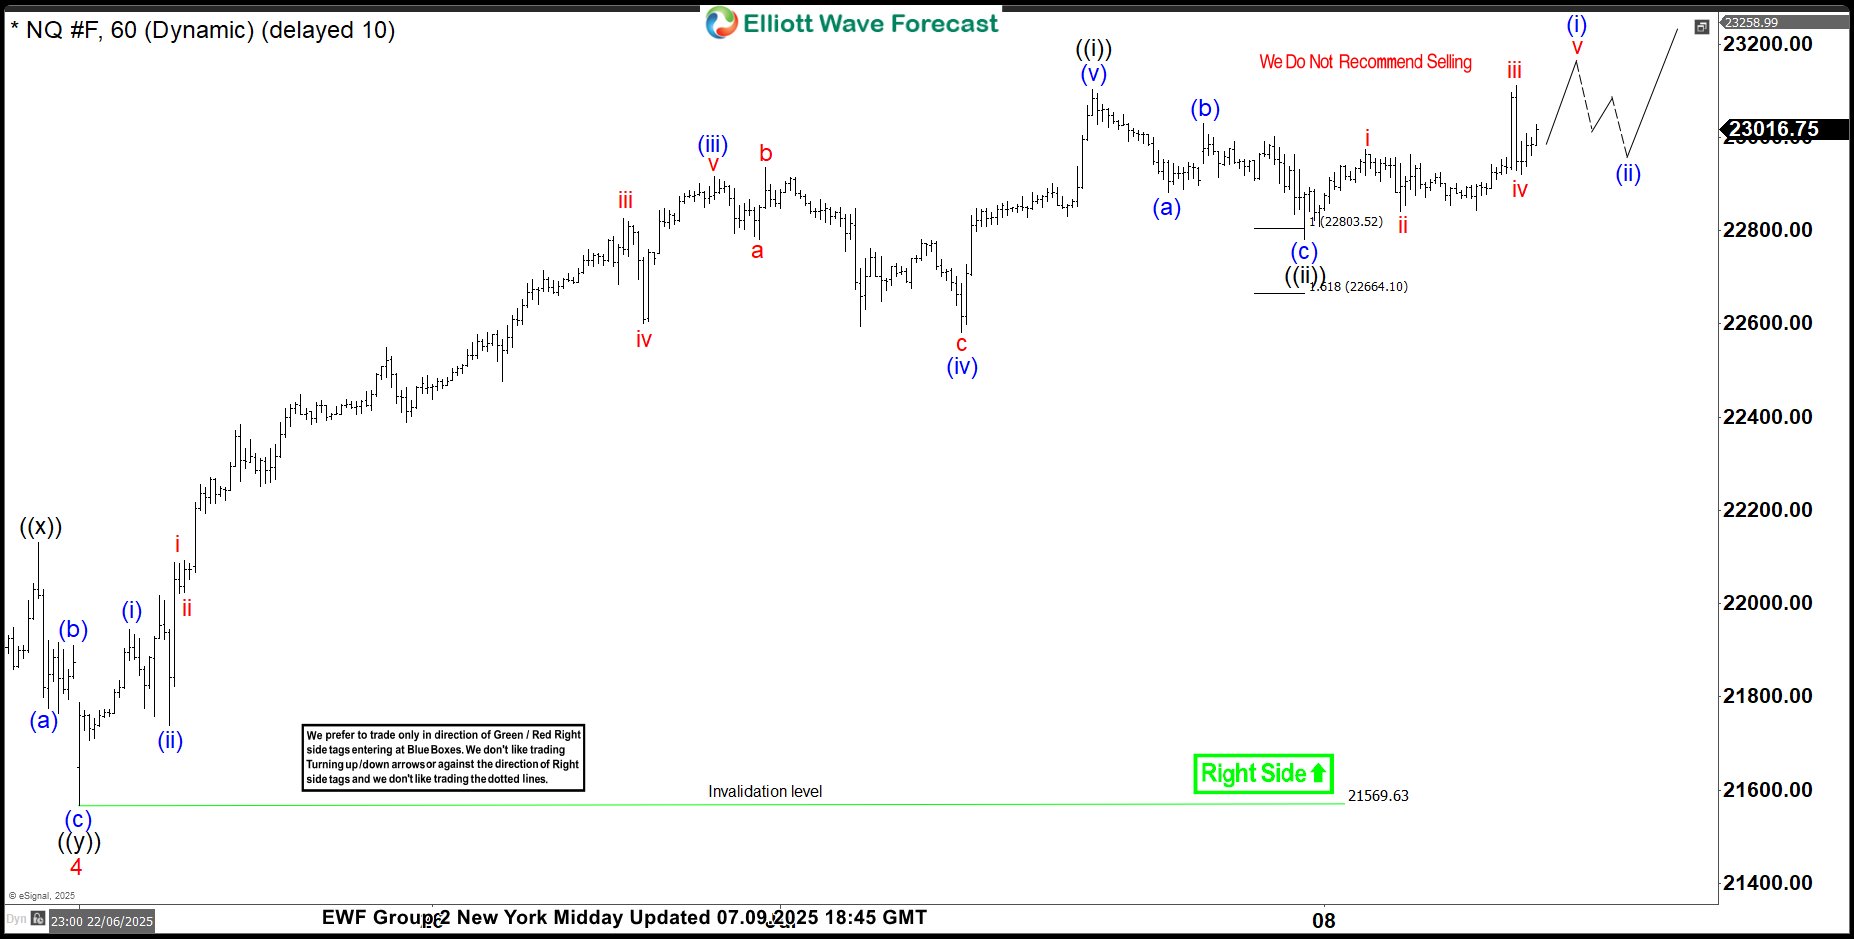
NQ_F Elliott Wave 1 Hour Chart 07.07.2025
NASDAQ found buyers as expected at the Equal Legs area and has delivered a decent rally so far. The price broke toward new highs, confirming the next leg is already in progress.
Ethereum’s Steady Performance Sets the Stage for Upside Breakout
The second largest cryptocurrency has been on a consistent grind in the past two weeks after seeing some heavy selling flows during the Israel-Iran War, taking its prices close to the $2,000 mark but since, has been posting a slow but strong rally, fuel for further continuation.
Crypto markets haven't taken a significant direction for a while, but it doesn't mean that no opportunities are availables – Ranges give the opportunity for markets to cool down and prepare for further moves, while consolidating Volume-at-Price.
Market theory implies that the more prices are at an equilibrium (rangebound), the more solid the anchor of value for all participants.
With cryptos consolidating at much higher levels than prior years, this shows a resilience for cryptocurrency markets and gives it more credibility for traditional investors to start inputting more flows.
For example, since mid-May 2025, Bitcoin has been consolidating between $100,000 to $110,000 – despite giving to many players the opportunity to take their profits, markets did not retrace. Ranges also provide opportunities for scalpers who may attempt to trade highs and lows.
Same for Ethereum which has been holding between $2,350 to $2,750 for close to two months now, and despite these prices being not too close from the Ether's ETH, it still consolidates at a relative high value, particularly after the 2025 Q1 Heavy Selling.
Where does Ethereum stand after close to 2 months of consolidation?
Ethereum Daily Chart
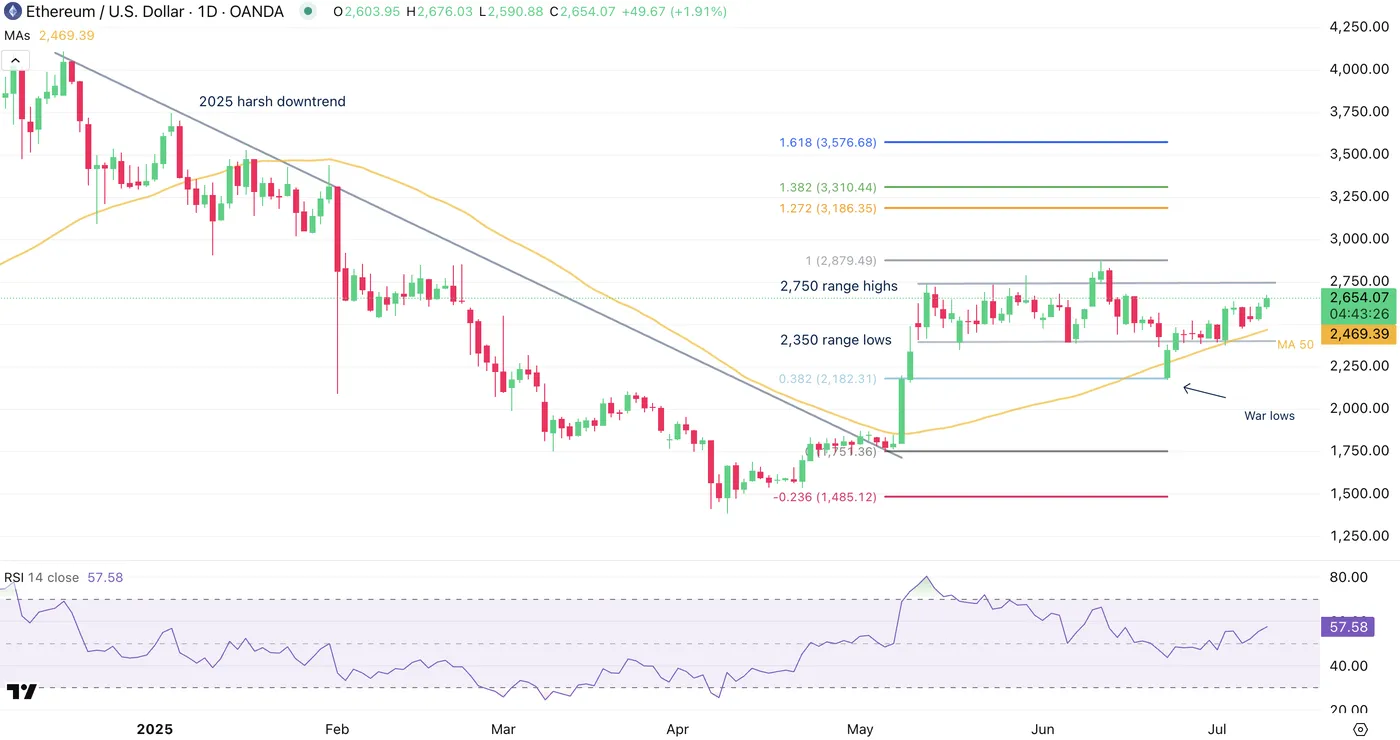
Ethereum Daily Chart, July 9, 2025 – Source: TradingView
The Daily chart shows decent consolidation with two fakeouts – it can happen that fakeouts lead to players being trapped beyond consolidation levels and create movements on the other side of the range.
An upside fakeout in mid-June led to a retracement down to the $2,174 lows only a few days after.
Since, however, buyers have stepped in consistently using the 50-Day Moving Average as support for continuous buying. with Momentum not moving too fast to the upside (due to the speed and consistency of the buying move), the conditions for an upward breakout are starting to assemble.
A strong buying candle above the 2,750 range highs would be necessary to confirm the hypothesis as a range is poised to hold as long as it holds before the inverse is proven true.
Keep an eye on sentiment in other cryptos, particularly altcoins to spot how crypto players are moving.
Ethereum 4H Chart
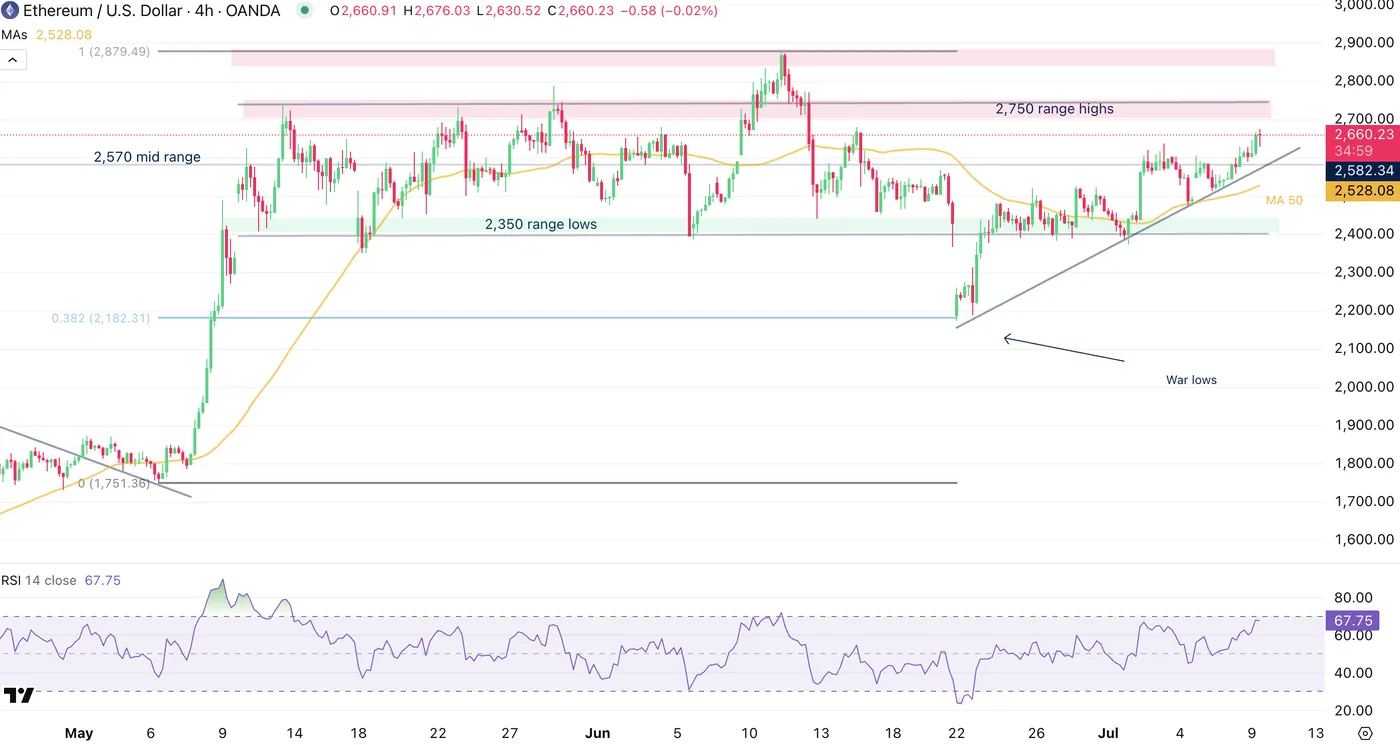
Ethereum 4H Chart, July 9, 2025 – Source: TradingView
The 4H Candles further give signs of the consistent grind, however it will be essential to spot how buyers react to the increasingly overbought conditions of the shorter timeframe.
The 4H MA 50 is also accompanying the trend with a not-to-steep and stable trendline forming since the war-lows.
Prices will have to hold above the $2,570 mid range level for a breakout to the upside above the $2,750 range highs – June fakeout highs are at $2,880
ETHBTC check-up
ETH outperforming Bitcoin is essential for other altcoins to keep growing, as was the case in past cycles, which would provide yet another sign of consistency for the Cryptocurrency markets.
After a downside fakeout, ETHBTC is getting back into its range but still has to overcome the 2.46% mid-range level before showing more bullish signs.
FOMC Minutes: ‘A Couple’ of Policymakers to Consider Rate Cuts in July and ‘Most’ Before Year-End
Minutes from the Fed’s June 17-18 policy meeting, released at 14:00 EDT, have done little to change the narrative surrounding future monetary policy decisions.
Markets predict the Federal Reserve will maintain rates on July 30th and make its first 2025 rate cut in its September 17th decision.
Fed Minutes June 17-18: Key takeaways
Unanimous in vote to maintain the federal fund rate between 4.25 and 4.50%, minutes reaffirmed the Fed’s concerns on tariff-borne inflation, although acknowledged that uncertainty on the general economic outlook has “diminished but remains elevated”
While predictions for a July rate cut remain essentially unchanged, the minutes shed light on the diverging views held by policymakers about how lax the Fed should be during the current easing cycle
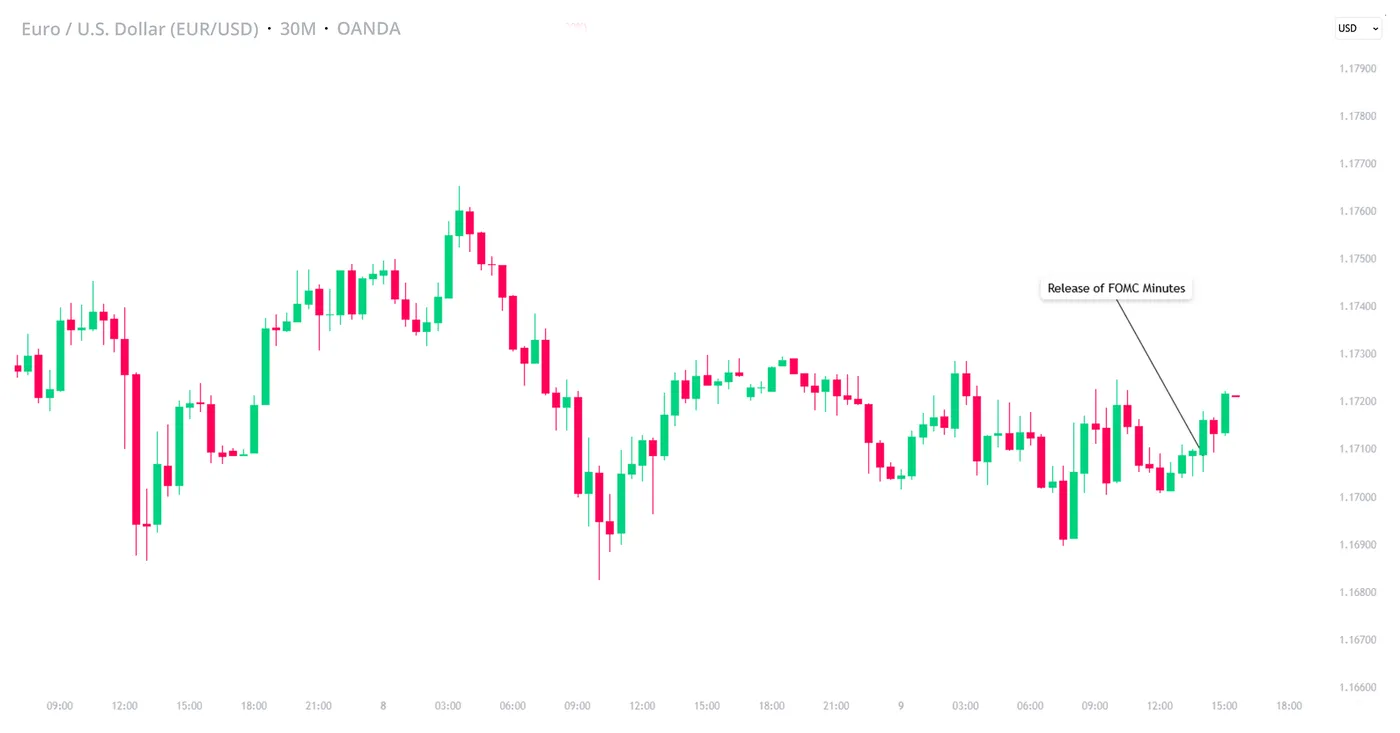
EUR/USD, OANDA, TradingView, 09/07/2025
"Most participants assessed that some reduction in the target range for the federal funds rate this year would likely be appropriate, noting that upward pressure on inflation from tariffs may be temporary or modest, that medium- and longer-term inflation expectations had remained well anchored, or that some weakening of economic activity and labor market conditions could occur."
Minutes of the Federal Open Market Committee, June 17–18, 2025
Fed Minutes June 17-18: Majority expect rate reduction this year
In a nutshell, three schools of thought currently exist amongst Fed policymakers, albeit to varying degrees of popularity:
- The majority of policymakers think that at least some reduction in the federal fund rate is both likely and appropriate before year-end, drawing reference to the temporary impact of tariffs on inflation, and longer-term inflation trends remaining “well-anchored”
- Some policymakers think that the most appropriate path would be to make no reductions in the federal fund rate before year-end, mentioning that inflation remains sticky, and importantly, above the 2% target
- A couple of policymakers are in support of reductions in the federal fund rate as soon as the next meeting, should “data evolve in line with expectations”
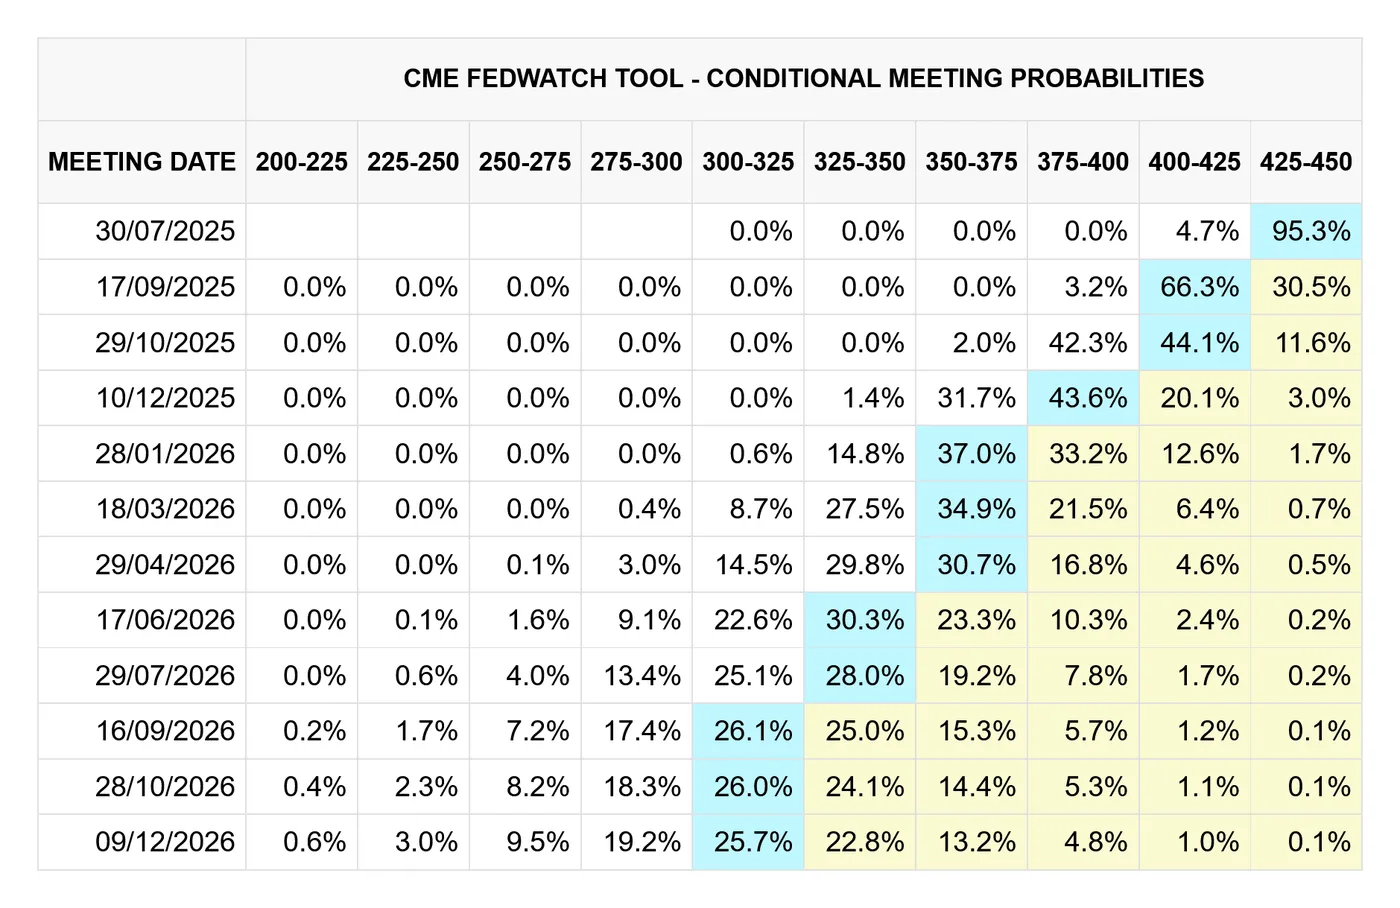
CME FedWatch, CME Group 24/06/2024
Fed Minutes June 17-18: “Swings” in export data spook Fed
With the latest on Trump tariffs hitting headlines again earlier this week, minutes released today from the Federal Reserve’s June meeting, renewing fears of tariff-borne inflation, could perhaps have come at a better time.
In the report, the Fed cited the potential for tariffs to disrupt supply chains and affect productivity. The Fed also questioned the consistency of recent export data, inferring that tariffs and their short-term effect on exports are muddying the waters that would otherwise allow the Federal Reserve a more straightforward path towards rate cuts.
Remaining staunch in their ‘wait-and-see’ policy for much of this year, while assuring that future decisions will be made on data alone, most will remain unsurprised that the Federal Reserve is erring on the side of caution.
When considering recent developments on US trade, extending tariff deadlines to August 1st, concerns made in FOMC minutes are now somewhat vindicated, and this offers the Fed further rationale to delay rate cuts, should they wish to.
Fed Minutes June 17-18: Inflation remains above the 2% target
Somewhat predictably, minutes would confirm that the Federal Reserve seems less concerned about the trend of falling inflation and more concerned that it remains above the target of 2%, mentioning recent PCE figures.
Cited as “somewhat elevated” both in the immediate policy statement and minutes, the phrasing around inflation highlights ongoing concern, especially compared to the more complimentary commentary of current US labor numbers.
The report’s description of the labor market as “solid” and unemployment as “low” would suggest that, in a vacuum, recent labor market numbers would support the notion of rate cuts.
Minutes Show the Fed Is Edging Closer to the Rate Cut
The Federal Open Market Committee (FOMC) held the policy rate steady in the target range of 4.25-4.5% at its June 17-18th meeting. The minutes from that meeting highlighted that trade and policy uncertainty and their impact on inflation remained a focal point of discussion. However, uncertainty was rated as having diminished since May (as Liberation Day tariffs have been postponed and trade war with China de-escalated) leading to a less pessimistic economic outlook relative to the previous minutes.
The staff projection in June – not to be confused with the Summary of Economic Projections – was generally upgraded. Real GDP growth in 2025 and 2026 was higher than what was presented at the May meeting, mainly due to the reduction in assumptions about the effective tariff rate. As a result, both the unemployment rate and inflation were now expected to increase by less, than in the previous forecast. Policy uncertainty remained high, and the economic risks continued to be "skewed to the downside", although risk of a recession has diminished.
FOMC participants viewed the current labour market as solid, acknowledging that both hirings and layoffs have remained steady in light of heightened uncertainty and reduction in labour supply due to immigration policy. That being said, most participants expected labour market conditions to gradually soften, noting that wage growth has continued to moderate suggestive of weakening labor demand.
Regarding inflation, participants acknowledged that inflation remained elevated and recent progress has been uneven, with services inflation moving down recently while goods inflation has picked up. They also noted limited progress in lowering core inflation. Participants appeared in consensus that tariffs will put upward pressure on inflation, but there remained considerably uncertainty on the timing, size and duration of these effects, namely, large inventories could help firms delay passing higher costs to consumers. While some participants noted that tariffs would lead to a one-time increase in prices and thus would not affect inflation expectations, most participants noted that tariffs could have more longer lasting effects on inflation increasing the risk of inflation expectations becoming unanchored.
The vote to hold rates steady was unanimous. Participants assessed that the Committee was well positioned to wait for more clarity on inflation and policy front given that the economy remained solid, and the monetary policy was only "moderately or modestly restrictive". However, most participants thought that some reduction in the fed funds rate this year "would likely be appropriate", but couple of participants noted that if the data continued to evolve in-line with their expectation "they would be open to considering a reduction in the target rate for the policy rate as soon as at the next meeting".
Key Implications
The FOMC participants acknowledged that the economy continues to perform well, uncertainty has diminished somewhat, and the labor market remains solid. That said, there appears to be less consensus among participants regarding the impact of tariffs on inflation, with some suggesting a short-term impact, while others are concerned about longer lasting effects.
Still, the minutes suggest that momentum for a rate cut is building within the FOMC. We are also of this view. Despite the economy’s resilience so far, this strength is likely to fade in the second half of the year (forecast), with both the unemployment rate and inflation expected to trend higher. Trade policy remains a key source of uncertainty, with tensions escalating recently, but the deadline to reach deals to avoid Liberation Day tariffs was pushed to August 1st. We expect that the FOMC's July 30th meeting is likely too early for enough certainty to have emerged for the Fed to cut rates, but the minutes suggest we could see a dissent or two on a stand pat decision. Markets currently favor a September rate cut, and we are inclined to agree.
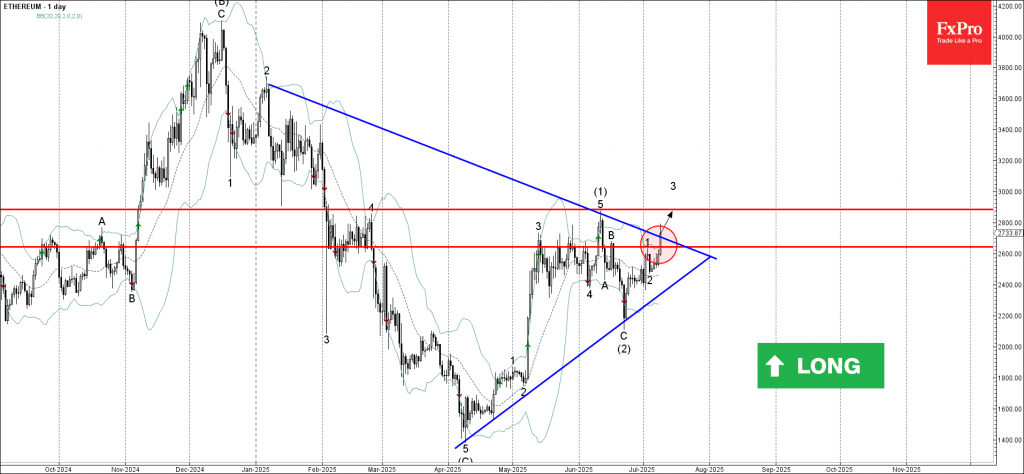
Ethereum Wave Analysis
Ethereum: ⬆️ Buy
- Ethereum broke the resistance area
- Likely to rise to resistance level 2885.00
Ethereum cryptocurrency recently broke the resistance area located between the resistance level 2645.00 (which stopped wave 1 at the start of July) and the resistance trendline of the weekly Triangle from January.
The breakout of this resistance area accelerated the active short-term impulse wave 3 of the intermediate impulse wave (3) from June.
Given the strongly bullish sentiment seen across the crypto markets today, Ethereum cryptocurrency can be expected to rise to the next resistance level 2885.00 (top of wave (1) from June).
CADJPY Wave Analysis
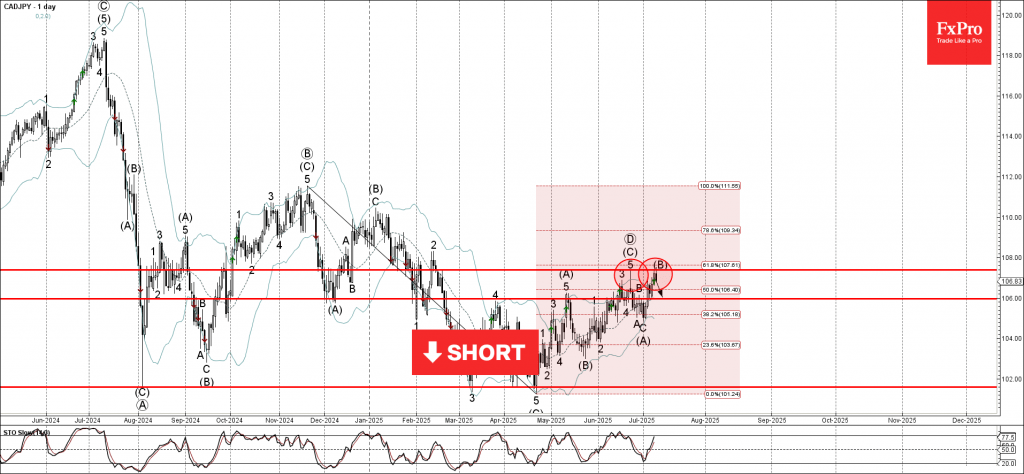
CADJPY: ⬇️ Sell
- CADJPY reversed from resistance area
- Likely to fall to support level 106.00
CADJPY currency pair recently reversed from the resistance area located between the resistance level 107.40 (former monthly high from June), upper daily Bollinger Band and the 61.8% Fibonacci correction of the downward impulse from November.
The downward reversal from this resistance area stopped the previous intermediate corrective wave (B).
Given the strength of the resistance level 107.40 and moderately bullish yen sentiment seen today, CADJPY currency pair can be expected to fall to the next support level 106.00.
GBPJPY Wave Analysis
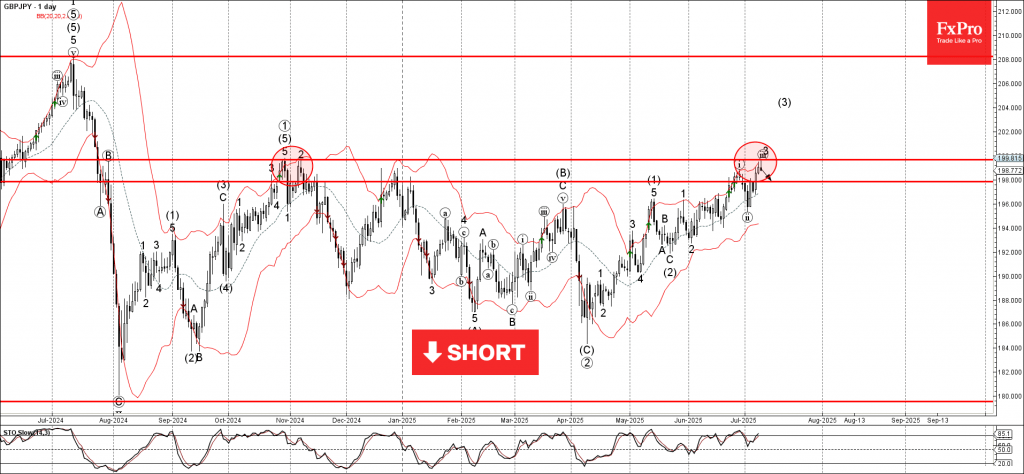
GBPJPY: ⬇️ Sell
- GBPJPY reversed from long-term resistance level 199.65
- Likely to fall to support level 198.00
GBPJPY currency pair recently reversed from the strong long-term resistance level 199.65 (former strong resistance from October, November and July) standing near the upper daily Bollinger Band.
The downward reversal from the resistance level 199.65 is likely to form the daily Shooting Star reversal pattern.
Given the bearish divergence on the daily Stochastic indicator and the strength of the resistance level 199.65, GBPJPY currency pair can be expected to fall to the next support level 198.00.
Sunset Market Commentary
Markets
Hardly any data on the agenda to inspire core markets’ trading today. There were also no new headlines from the likes of the UK or Japan highlighting debt sustainability concerns, allow the a momentum slowdown/pauze in the sell-off of ultra-long bonds. Time maybe for some technicals/nearby barriers to do their job. At 3.06%, the Japan 30-y yield has the all-time top (3.20%) in sight. For the UK 30-y yield (currently 4.46%), 4.50% is the final hurdle ahead of the April multi-decade top (5.66%). In this respect, BOE governor Bailey, in comments on the financial stability report, said that the Bank will reflect on curve steepening in the QT decision for the next 12 period starting in October. Similar pattern/nearby resistance for the 30-y German yield (currently at 3.16%, with the March top/2023 top at 3.25%). US yields over the previous week also joined the steepening move. However as markets are still pondering the chances of a resumption of the Fed easing cycle later this year, US (LT & ST) yields are developing in a more neutral/sideways trading pattern. The US 2-y (3.90%) and 10-y (4.40%) yield are a point in case of more sideways oriented ranges (respectively 3.70%/4.10% and 4.10%/6.65%) (cfr graphs infra). Even for the US 30-y yield, while nearing the 5% barrier, the technical resistance levels are somewhat further away (5.2% area). For (US) bond markets, the minutes of the June Fed meeting (this evening), a 10-y (also today) and especially a 30-y US Treasury auction (tomorrow) might provide some additional insight on the short-term market momentum regarding curve steepening. US yields are easing less than 2 bps. German yields ease by a similar ‘amount’. Consolidation, nothing more than that.
As was already was the case of late, the heavy flurry of trade(war) messages from president Trump again had hardly any lasting negative impact on global (FX, yields and equity) markets. Only specific markets (e.g. copper) showed a spike in volatility. Even so, we keep an eye at financial measures of US inflation expectations. E.g, the USD 10-y inflation swap this month rose about 10 bps (2.57%). Nothing really specular, but worth keeping an eye on. European equity markets in the meantime apparently still draw comfort (EuroStoxx +1.4%) from comments (Bloomberg, amongst others) that EU is close to a trade deal with rumored tailor-made exceptions for some sectors of even companies (Airbus, German carmakers with a US production). US equities open marginally higher (S&P 500 + 0.4%) with record levels within reach. On FX markets, USD moves are limited. The greenback maintains recent gains but fails to extend them (DXY 975, EUR/USD 1.171). Yen underperformance is tempering (USD/JPY 146.5).
News & Views
The Czech unemployment rate remained at 4.2% in June. Compared with a year ago, the jobless rate is now 0.6 ppts higher. When adjusting for seasonal effects, the jobless rate rose slightly to 4.5%. That’s the highest since 2017, signalling a gradual cooling of the labor market. This is primarily attributable to the downturn in manufacturing, which has been reducing employment for the third year in a row. In this respect KBC Economics views the latest industrial production data, which signal a stabilisation, with slight optimism. And considering new orders and improved business sentiment (eg. June PMI), it is also a key variable for further developments on the labour market and one of the important arguments why the domestic labour market should stabilise over time. In a broader perspective, KBC Economics’ sticks to the overall story of a continued recovery of the Czech economy with a 0.3% Q/Q growth expected in Q3.
China’s State Council unveiled new measures today to stabilize employment. These include expanded social insurance subsidies, special loans, and targeted support for young people looking for jobs. The support comes as the country’s domestic economy is struggling while the trade war with the US is weighing on the export sector. Latest unemployment figures showed China’s unemployment rate at a relatively low 5% in May after having hit a 2-year high at 5.4% in February. Youth unemployment, however, is far higher with the jobless rate for 16- to 24-year-olds (ex. students) coming in at 14.9% while that for 25- to 29-year-olds (ex. students) stands at 7%.
USD/JPY Mid-Day Outlook
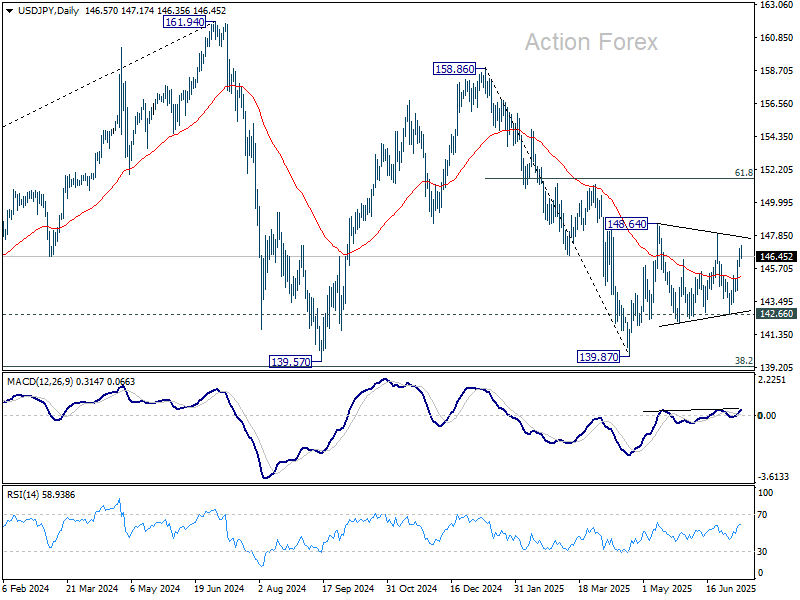
Daily Pivots: (S1) 145.94; (P) 146.46; (R1) 147.09; More...
No change in USD/JPY's outlook as it's still bounded in range of 142.66/148.01 and intraday bias remains neutral. On the upside, firm break of 148.01 resistance will resume the rise from 139.87 to 61.8% retracement of 158.86 to 139.87 at 151.22. However, break of 142.66 will bring deeper fall back to retest 139.87 low.
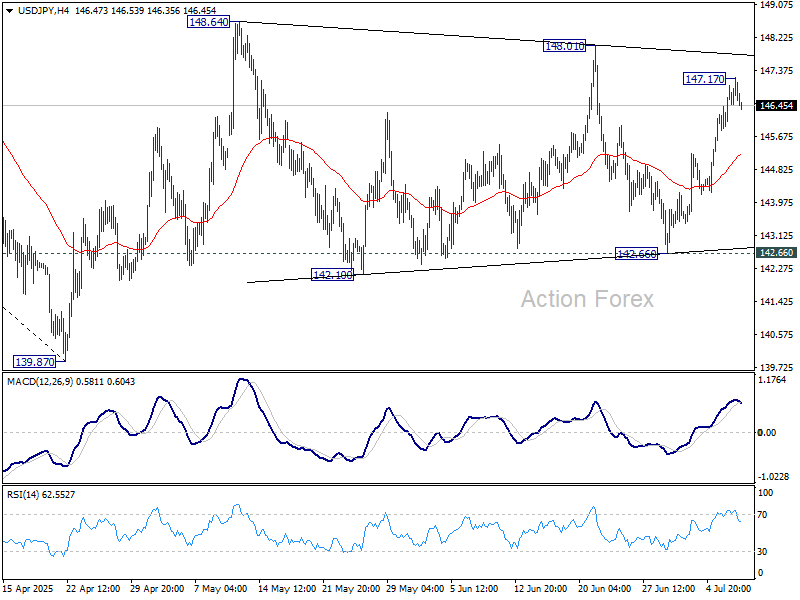
In the bigger picture, price actions from 161.94 (2024 high) are seen as a corrective pattern to rise from 102.58 (2021 low). There is no clear sign that the pattern has completed yet. But still, strong support is expected from 38.2% retracement of 102.58 to 161.94 at 139.26 to bring rebound.