Sample Category Title
BoJ regional report highlights business uncertainty amid tariff risks
BoJ's regional branch managers reported that while higher US tariffs have yet to significantly dent Japan’s exports or factory activity, companies are starting to hold back on capital expenditure.
Uncertainty over US trade policy, driven by President Trump’s rapid and unpredictable tariff announcements, has made it difficult for firms to fully assess the potential economic impact. While concrete damage has not yet materialized, the lack of clarity is beginning to influence strategic planning. "Many regions saw companies voice concern about slumping demand from rising US sales prices and a slowdown in the global economy," BoJ said.
Wage developments are another key theme in the survey. The outlook is split: some companies foresee the need to raise wages to attract and retain talent, while others are already hinting at bonus cuts should profit margins come under pressure.
EUR/USD: Bulls Hold Grip for Further Gains After Consolidation,1.2000 Target Comes in Focus
EURUSD is holding under new high (1.1830, the highest since Sep 2021), as larger bulls took a breather for consolidation.
The single currency remains supported by the broader weakness of US dollar, which showed the worst performance in the first six months of this year, since 1973.
Dips from new peak were so far shallow and found solid support at broken Fibo level at 1.1685 (76.4% retracement of 1.2349/0.9535 downtrend), suggesting that broader bullish structure remains intact.
The pair is on track for the third weekly close above 1.1685 support that adds to strong bullish stance and keeps in play prospects for further advance.
Bulls eye initial target at 1.1909 (3 Sep 2021 high) the last obstacle en-route to psychological 1.2000 barrier.
Only break below daily Kijun-sen (1.1600) would dent bulls and risk deeper pullback.
Res: 1.1756; 1.1800; 1.1830; 1.1909.
Sup: 1.1685; 1.1631; 1.1600; 1.1538.
Copper Saga Heats Up, More Tariffs and DAX Holds Firm Near All-Time Highs
U.S. stock futures and the dollar slipped after President Donald Trump escalated trade tensions by announcing a 50% tariff on copper and sending new letters to raise tariffs on other countries.
Asian Market Wrap
S&P 500 futures dropped 0.3%, and the dollar slipped 0.1% on Thursday. Treasuries and Asian stocks stayed steady, while Bitcoin held near its record high from Wednesday around the $112k mark.
Brazilian markets tumbled after Trump announced new tariffs, including a 50% tax on goods from Brazil. Copper prices rose after Trump confirmed a 50% tariff on copper imports starting August 1, impacting producers. Copper futures on the London Metal Exchange climbed 0.4% to $9,664.50 a ton, while U.S. Comex contracts jumped nearly 3%.
Global copper producers are rushing to ship supplies faster, redirecting deliveries to Hawaii and Puerto Rico to save time.
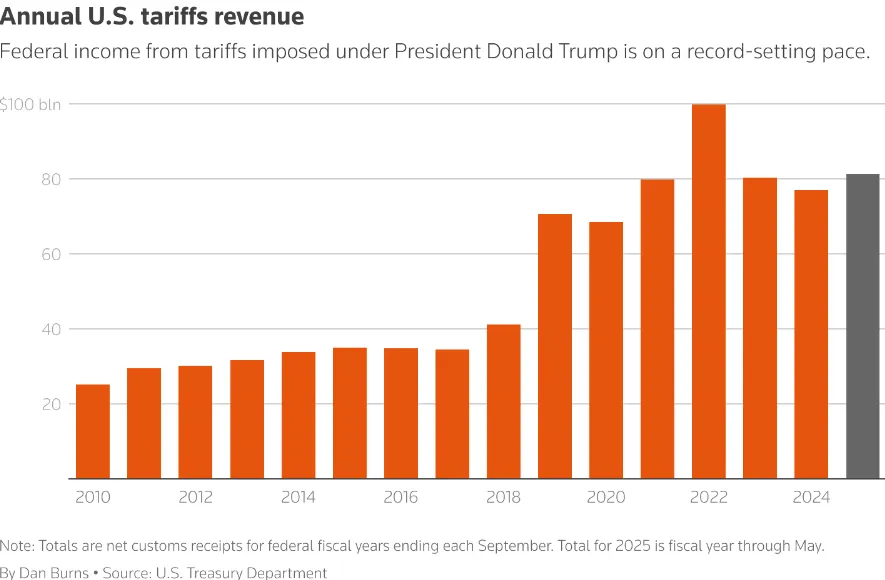
Highest Tariff Level Since 1934
After Trump announced higher tariffs on imports from 14 countries, Yale Budget Lab estimated the U.S. tariff rate has risen to 17.6%, the highest in 90 years, up from 15.8%.
The Trump administration claims these tariffs are a major source of revenue. Treasury Secretary Scott Bessent said the U.S. has collected $100 billion so far and could reach $300 billion by year-end, compared to the usual $80 billion annually.
Source: LSEG
European Open as Earnings Season Approaches
European stocks rose on Thursday, led by mining shares, as hopes grew for a U.S.-EU trade deal. The STOXX 600 index gained 0.5% to 552.45 points, while most regional markets were up, except Spain's IBEX, which dipped 0.1%.
EU trade chief Maros Sefcovic said progress has been made on a deal with the U.S., which could be finalized in days. Talks include measures to protect the EU auto industry, according to officials.
European mining stocks jumped 2.8%, and healthcare stocks rose 1.1%.
Meanwhile, Barry Callebaut shares dropped 7.2% after the Swiss chocolate maker lowered its sales forecast for the third time this year.
European investors are preparing for the key second-quarter earnings season, which will reveal how companies are handling trade volatility and how stable their stock prices are.
Analysts have been lowering 2025 earnings forecasts for 55 weeks straight, though the rate of cuts has slowed since May. Europe’s full-year earnings growth is now predicted at 3%, down from 8% earlier this year.
On the FX front, the U.S. dollar steadied on Thursday after pulling back from a two-week high. The dollar index, which tracks it against six major currencies, stayed flat at 97.416 after slipping 0.2% on Wednesday. It had hit a high of 97.837 earlier that day before losing steam.
The dollar fell after U.S. Treasury yields dropped sharply on Wednesday, following strong demand at a 10-year note auction. This eased concerns about the earlier "Sell America" trend, where Treasuries, the dollar, and stocks were sold off.
The euro rose 0.1% to 1.1733, and the British pound edged up 0.1% to 1.3609. The dollar remained stable at 146.32 yen and 0.79420 Swiss francs.
Currency Power Balance
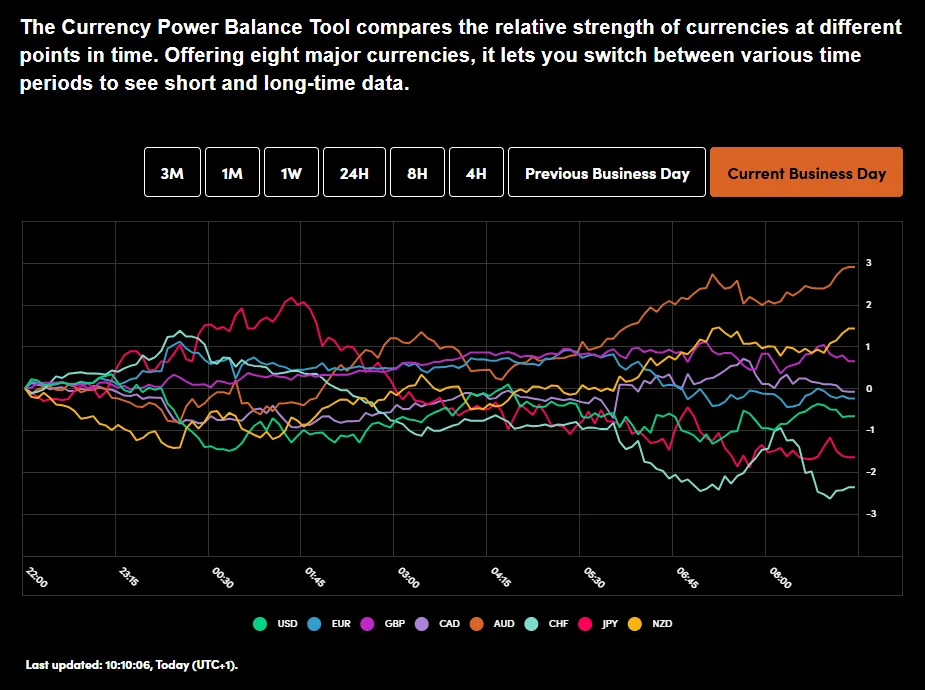
Source: OANDA Labs
Looking at commodities and Oil prices continue to hold the high ground. WTI however has failed to break above the 200-day MA and could be set for a short-term correction and may be worth monitoring.
Gold has recovered its shine and has risen to trade comfortably above the $3300/oz handle. Technicals do hint at further upside as Gold has bounced from the fibonacci golden pocket area overnight.
Economic Data Releases and Final Thoughts
Looking at the economic calendar, another quiet day today with US initial jobless claims is the only release which may have some impact on markets. We do also have a host of central bank policymakers speaking today from both the Fed and Bank of England.
Beyond that further developments on the trade deal front will likely drive market moves and sentiment for the rest of the day.
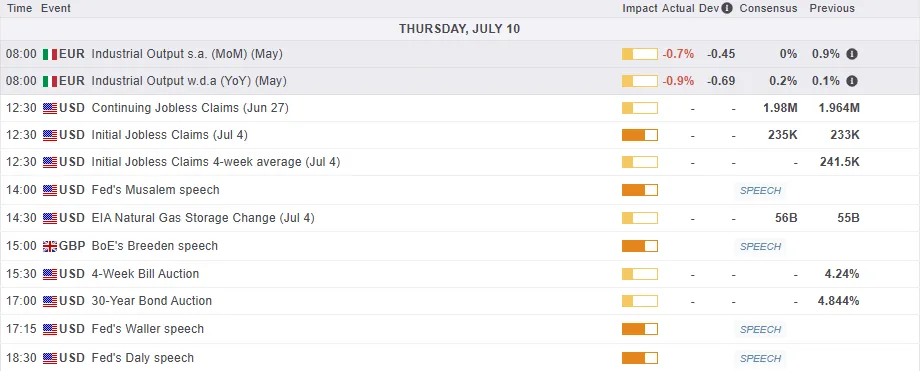
For all market-moving economic releases and events, see the MarketPulse Economic Calendar. (click to enlarge)
Chart of the Day - DAX Index
From a technical standpoint, the DAX has recorded a bullish close yesterday breaking out of a six-week range.
The close above the 24330 may be a precursor for further gains, however a lot of this will depend on how the trade deal talks play out.
There remains a probability of a retest of the 24330 handle before the next leg to the upside especially if the trade deal talks drag on.

Source: TradingView.com (click to enlarge)
Support
- 24330
- 24000
- 23727
Resistance
- 24750
- 25000
- 25250
GBP/USD Hits Two-Week Low as Pressure Mounts
The GBP/USD pair dropped to 1.3602 on Thursday, marking a two-week low amid a strengthening US dollar and growing concerns over the UK’s public finances.
The sell-off intensified after US President Donald Trump confirmed the imposition of 25% tariffs on goods from 14 countries, including Japan and South Korea, effective 1 August. So far, only the UK and Vietnam have secured exemptions from these new tariffs, which are in addition to existing duties on cars, steel, and aluminium.
London is now scrambling to negotiate a US deal to exclude British steel from the tariffs. Failure to do so could see the rate rise to 50%, posing a severe threat to the UK’s already struggling steel industry.
Further pressure on the pound came from a bleak forecast by the Office for Budget Responsibility (OBR), warning that public debt could exceed 270% of GDP by the early 2070s. Key drivers include an ageing population, rising healthcare and pension costs, and heightened geopolitical tensions, which may necessitate increased defence spending – adding further uncertainty to the UK’s long-term fiscal stability.
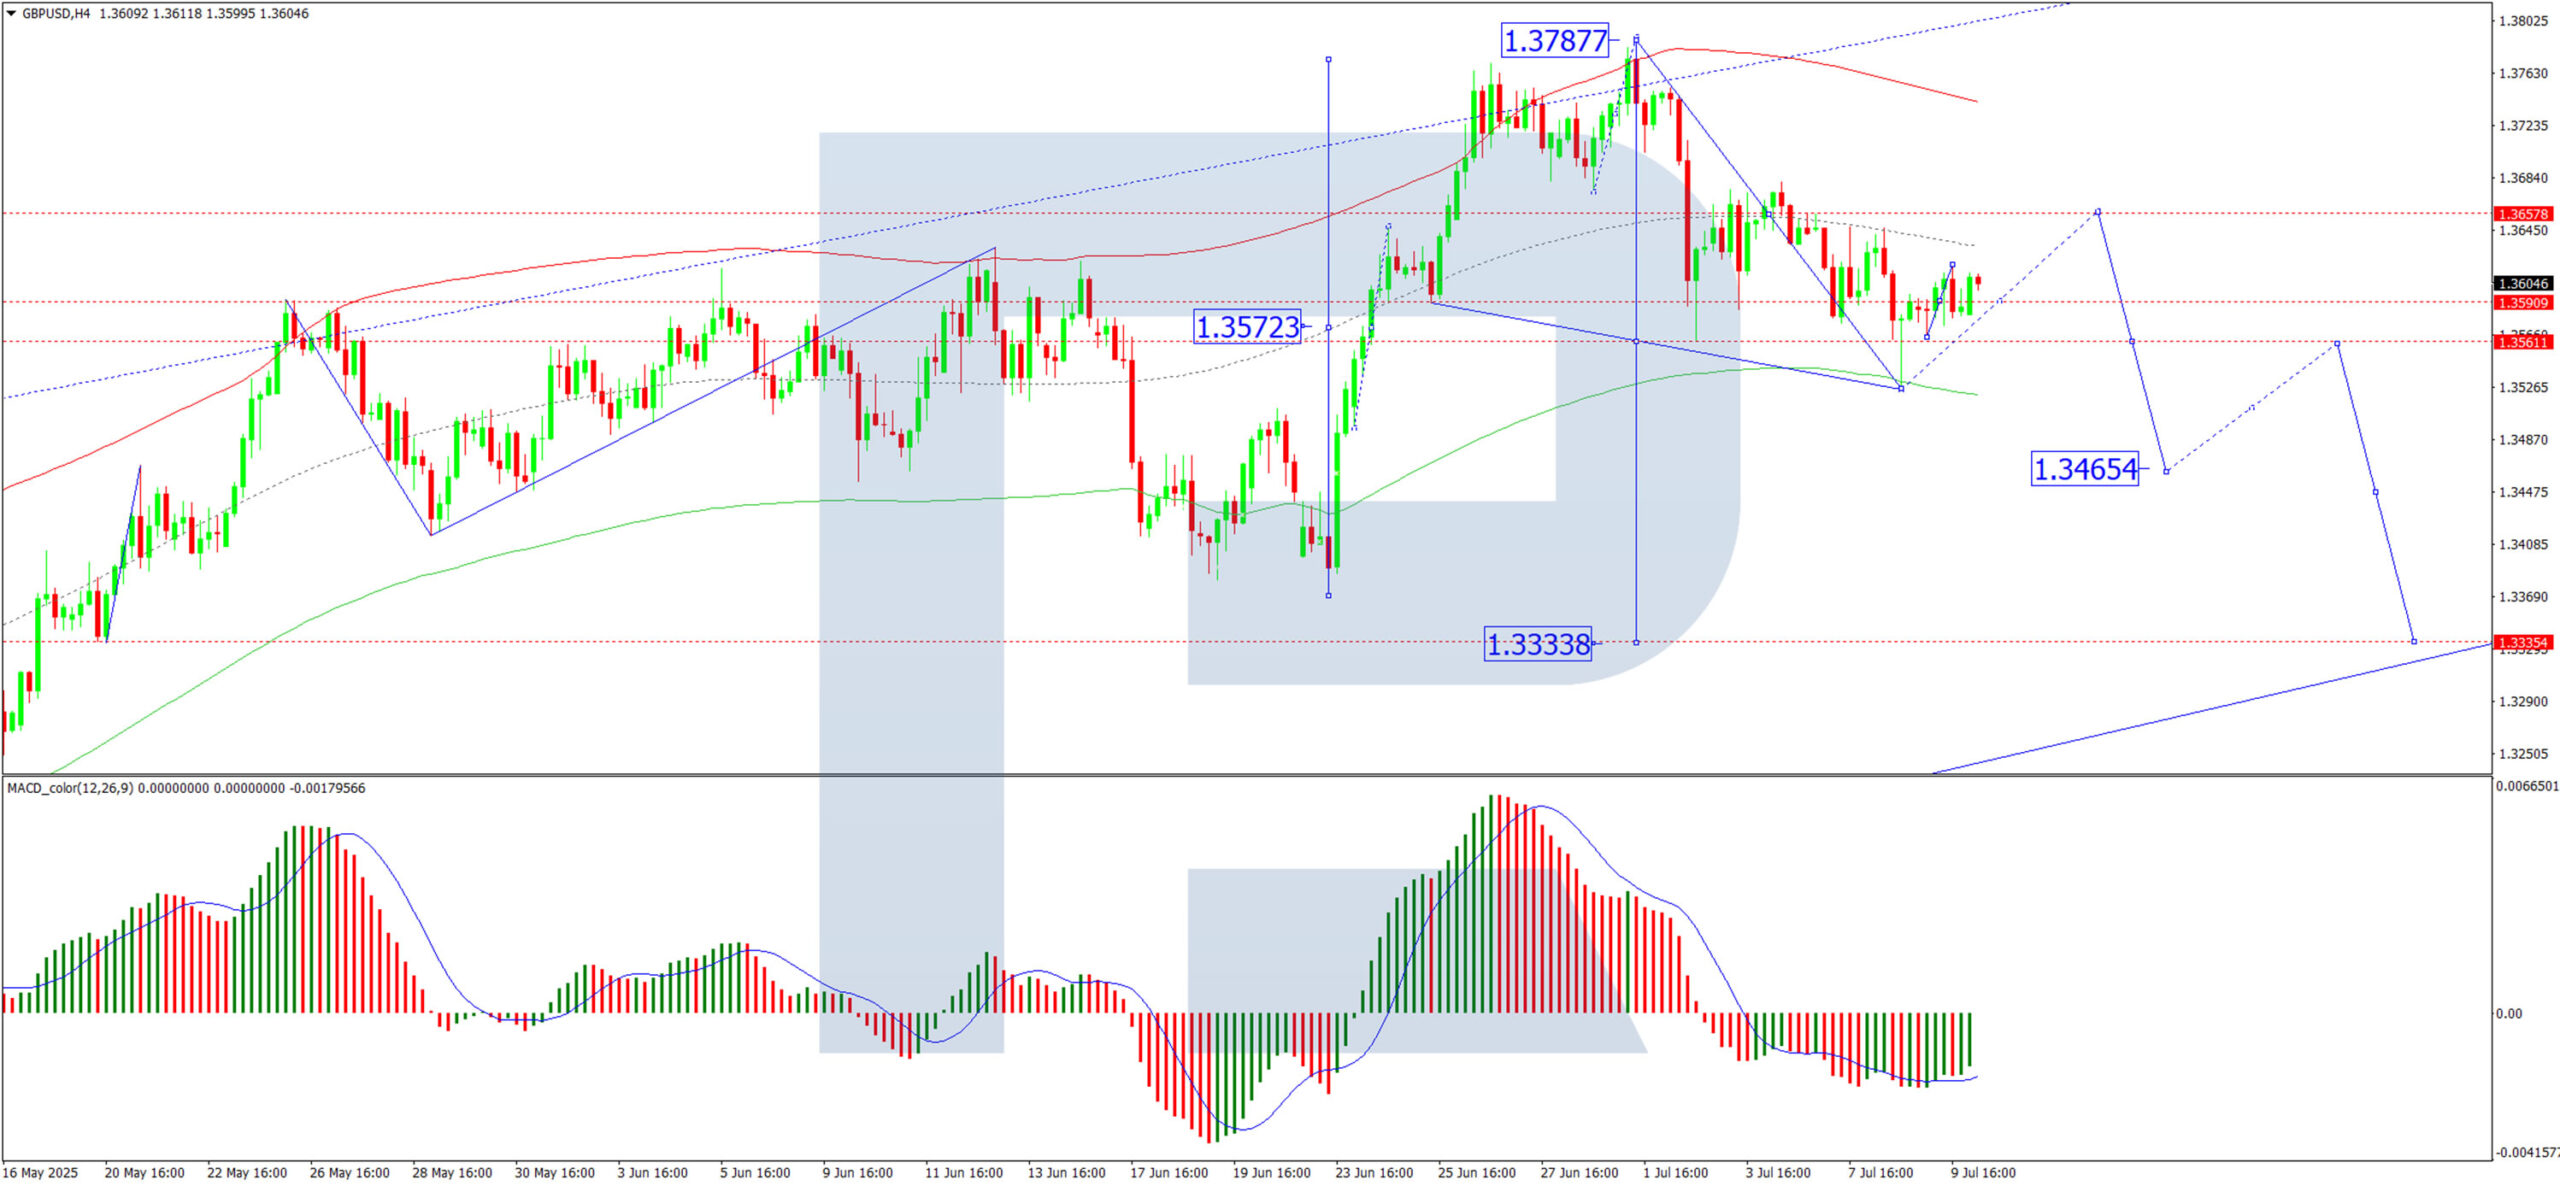
Technical Analysis: GBP/USD
H4 Chart:
- The pair completed a downward wave to 1.3525, followed by a recovery to 1.3590
- Today, we anticipate a narrow consolidation range near this level
- A breakout upwards could extend the correction to 1.3657, after which a fresh decline towards 1.3520 is expected, with a longer-term target at 1.3465
- MACD confirmation: The signal line remains below zero, indicating a firm downward trend
H1 Chart:
- The market has finished a correction to 1.3590, with consolidation now forming
- An upward breakout may push the pair towards 1.3656, but a subsequent drop to at least 1.3520 is likely
- Stochastic confirmation: the signal line is below 80, trending downward towards 20.
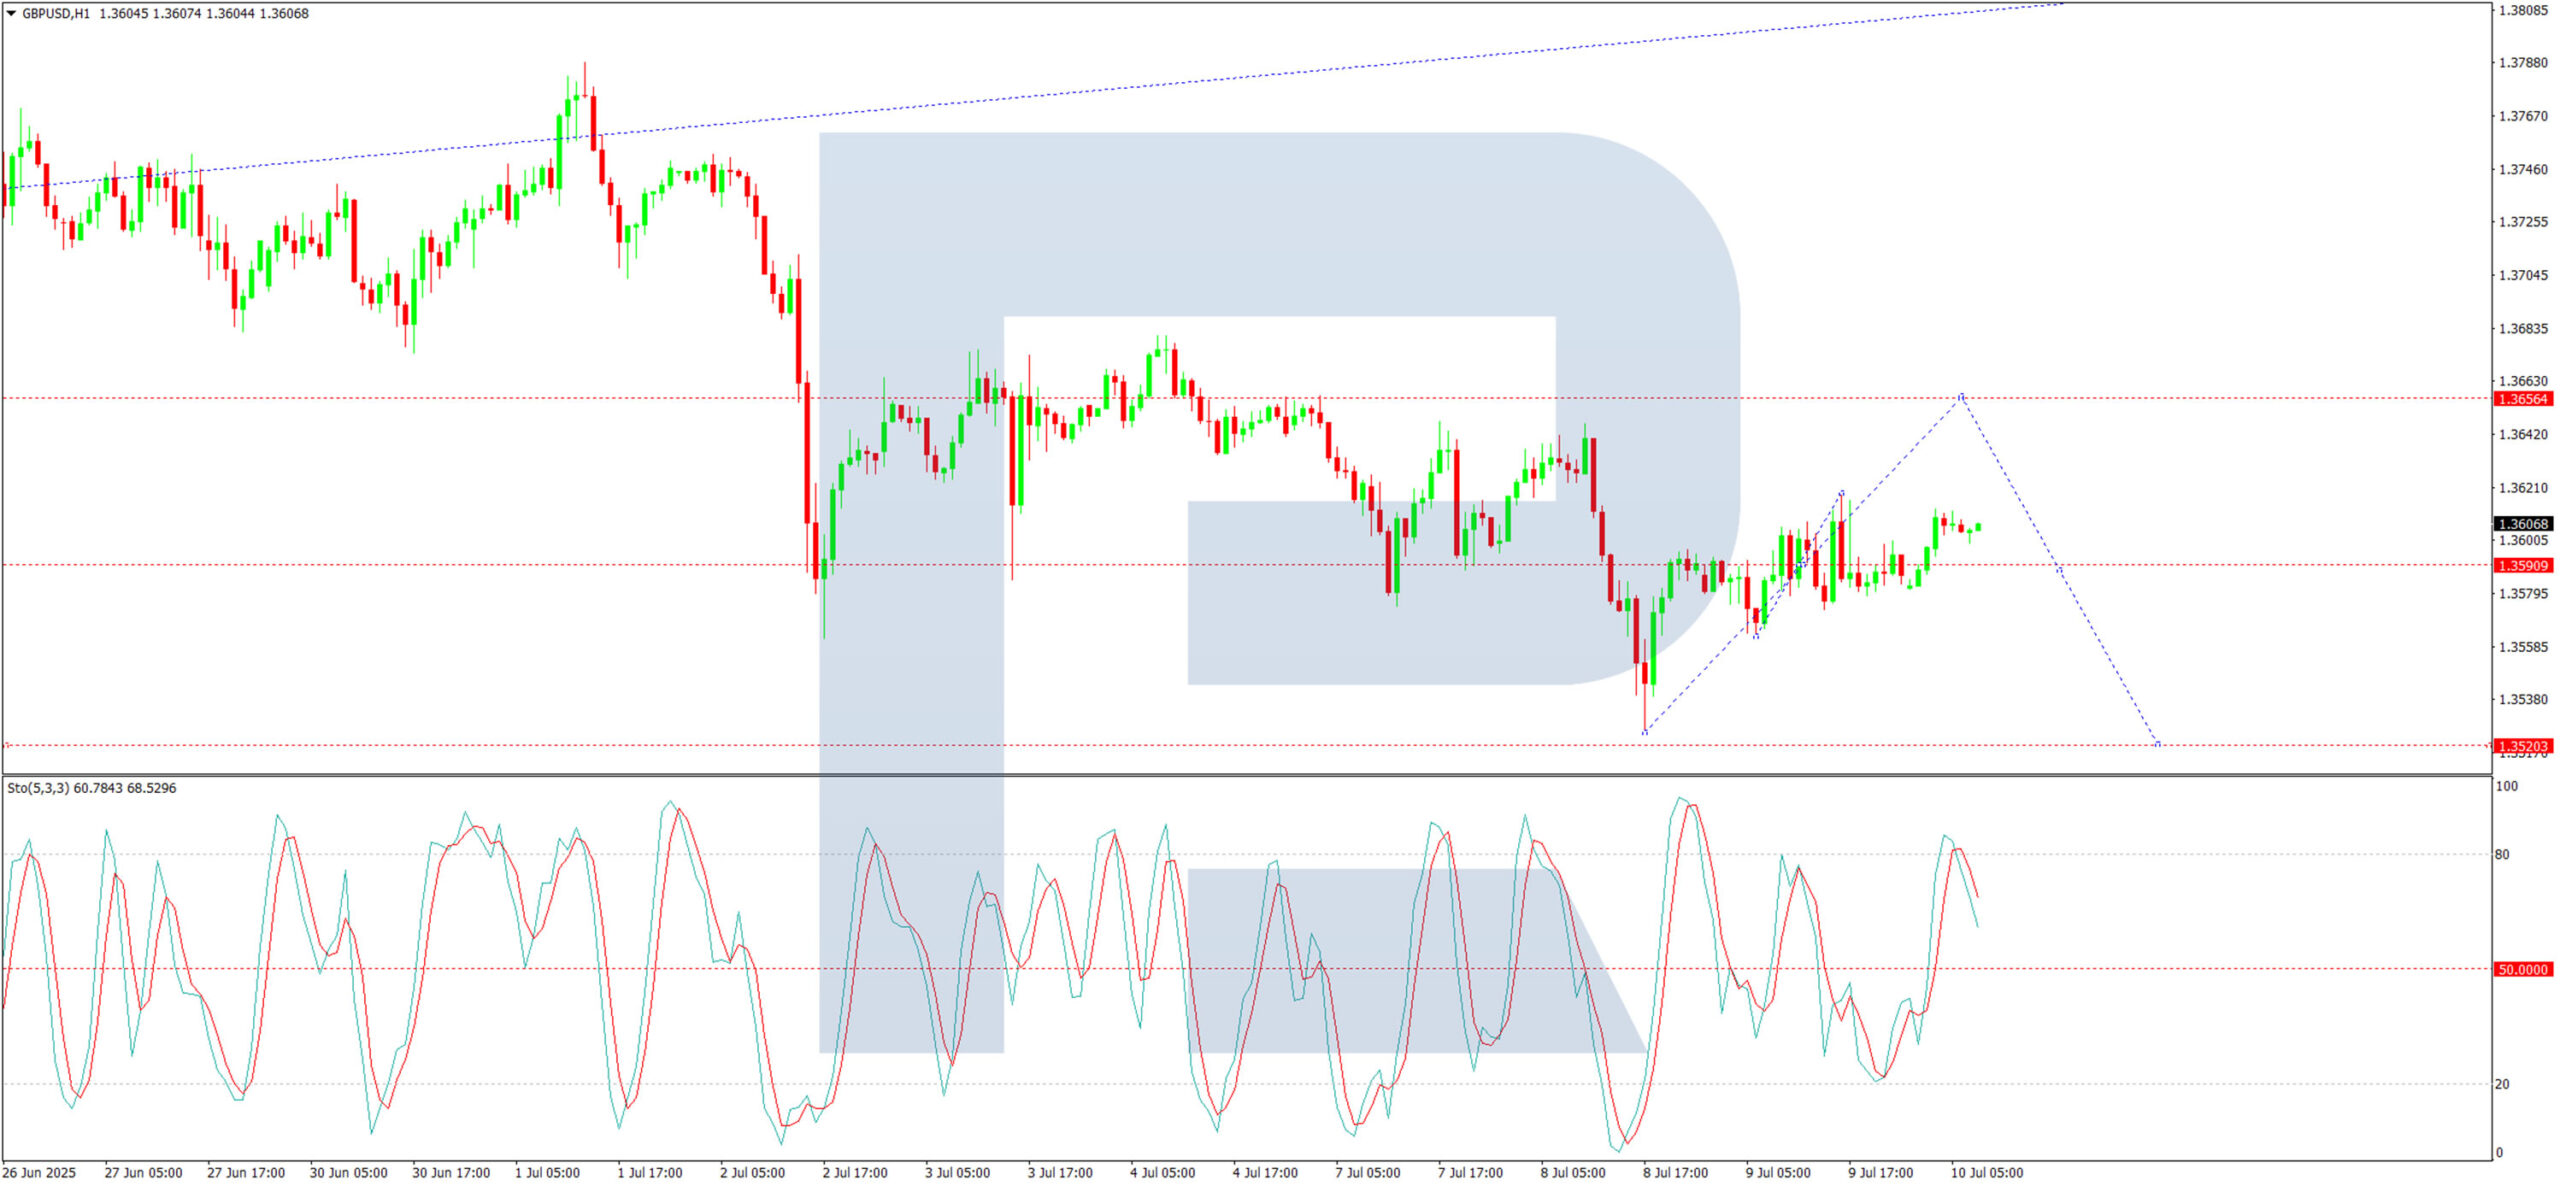
Conclusion
The GBP/USD remains under downward pressure, with fundamental and technical factors aligning for further weakness. A short-term correction is possible, but the broader trend suggests additional declines ahead.
Euro in Focus – Markets on Alert
The euro is holding firm after a notable rally in recent weeks. Both the EUR/USD and EUR/JPY currency pairs are showing signs of consolidation, as markets cautiously assess the outlook against the backdrop of a packed economic calendar. Traders remain in wait-and-see mode — a stance that could serve as a platform for either a renewed upward impulse or a potential correction, should upcoming data disappoint expectations.
Investors are closely monitoring a series of key macroeconomic indicators set for release in the coming hours, including Germany’s consumer price index, Italy’s industrial production figures, and the PCSI consumer sentiment index across major eurozone economies. These reports will help gauge whether the euro's current strength is justified, and how consumers and businesses are responding to a strong currency.
Meanwhile, European Central Bank (ECB) policy remains in the spotlight. In June, the ECB cut interest rates amid a strengthening euro and easing inflationary pressures. The market will now scrutinise the rhetoric of ECB officials to assess their concerns about further euro appreciation and its implications for exports and inflation targets. Remarks from Luis de Guindos, who recently warned against “excessive appreciation”, underscore how sensitive monetary policy has become to current exchange rate levels.
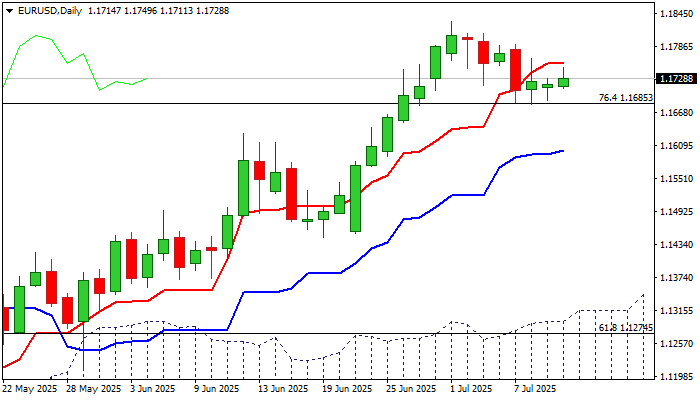
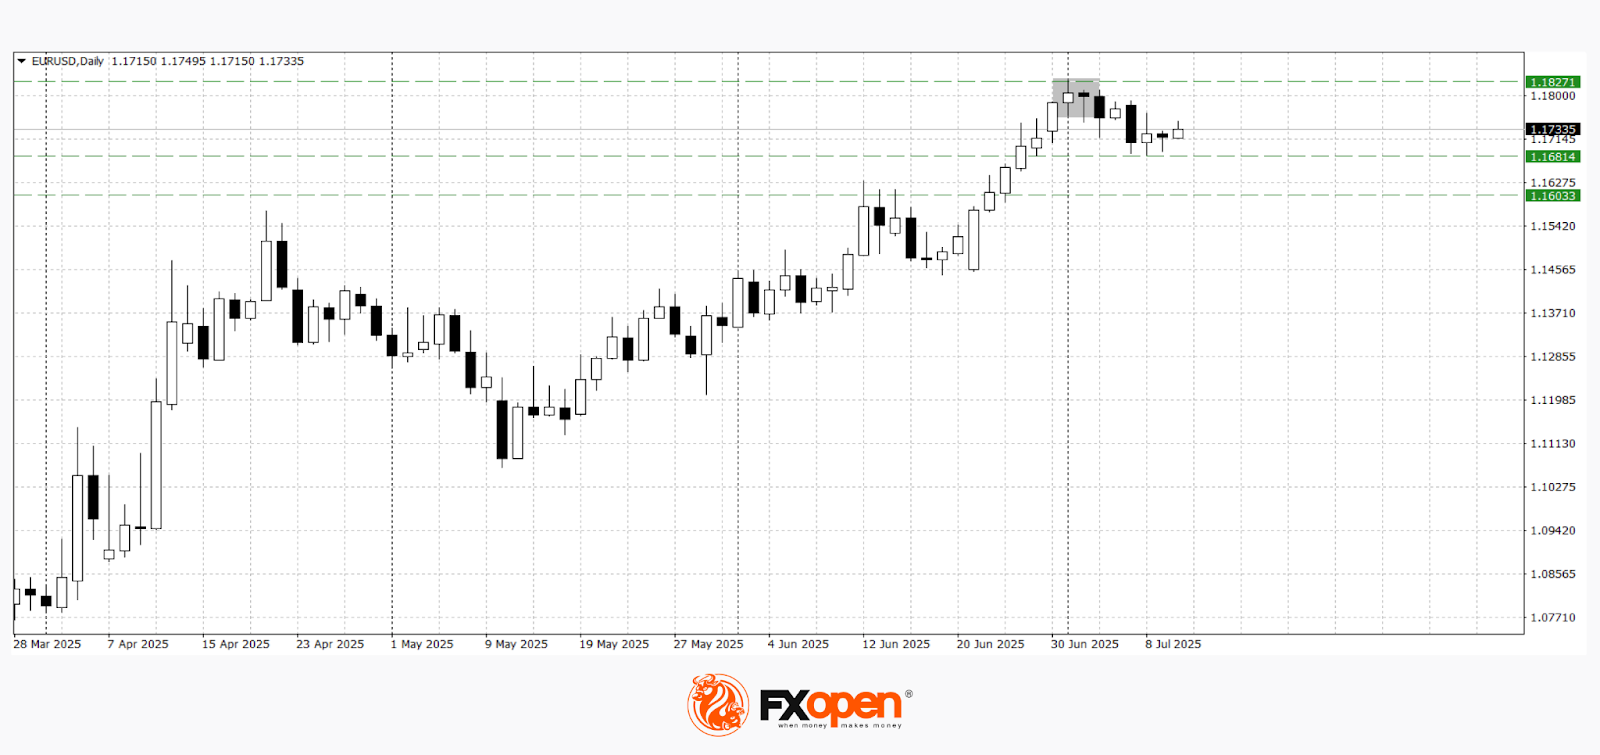
EUR/USD
The EUR/USD pair has been consolidating in the 1.1680–1.1800 range for a second consecutive week. Technical analysis of EUR/USD suggests the potential for a deeper correction, as a bearish harami pattern has emerged on the daily timeframe. However, if buyers manage to hold the price above 1.1700, the pair could resume its upward trend toward the 1.1900–1.2000 zone.
Key data releases that may influence EUR/USD movements include:
- 09:00 (GMT+3): Germany CPI
- 13:00 (GMT+3): Germany PCSI Consumer Sentiment Index (Thomson Reuters/Ipsos)
- 15:30 (GMT+3): US Initial Jobless Claims
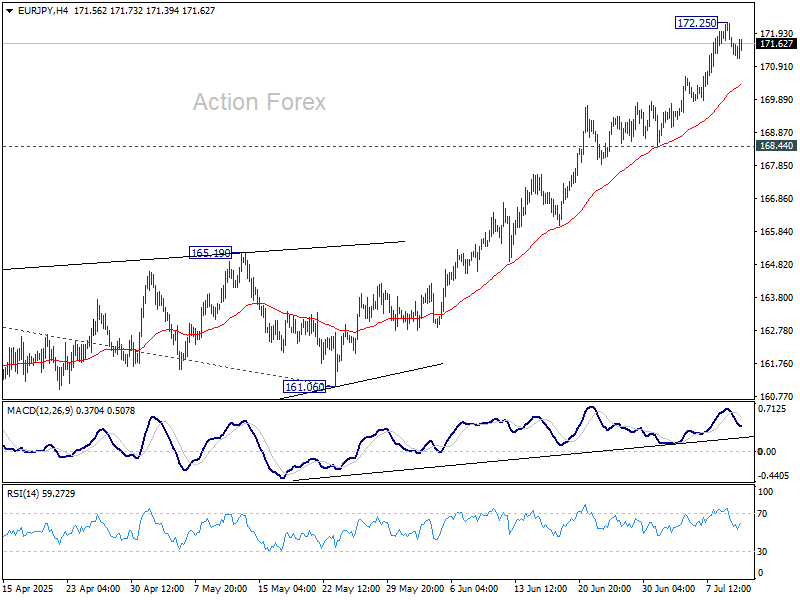
EUR/JPY
The recent sharp rally in EUR/JPY culminated in a test of major resistance near 172.30, accompanied by the formation of a dark cloud cover pattern on the daily chart. This signals the possibility of a pullback, with support likely to be tested around 170.30–170.60. Still, in the event of positive eurozone data, the pair could attempt to retest recent highs at 172.00–172.30.
Upcoming events that could impact EUR/JPY pricing:
- Today, 20:15 (GMT+3): Speech by Fed Governor Christopher Waller
- Tomorrow, 09:00 (GMT+3): Germany Wholesale Price Index
- Tomorrow, 15:00 (GMT+3): Germany’s Current Account Balance (seasonally adjusted)
Trade over 50 forex markets 24 hours a day with FXOpen. Take advantage of low commissions, deep liquidity, and spreads from 0.0 pips. Open your FXOpen account now or learn more about trading forex with FXOpen.
This article represents the opinion of the Companies operating under the FXOpen brand only. It is not to be construed as an offer, solicitation, or recommendation with respect to products and services provided by the Companies operating under the FXOpen brand, nor is it to be considered financial advice.
HK & SG Equities Lead; US Rally Stalls at Resistance, Dow Jones (Chart of the Day)
The US stock market appeared unfazed by renewed tariff headlines on Wednesday, 9 July. Major indices broke out from a two-day consolidation, led by a 2.8% surge in artificial intelligence giant Nvidia. The company made history as the first to reach a US$4 trillion market valuation. The Nasdaq 100 rose 0.7%, the S&P 500 gained 0.6%, and the Dow Jones Industrial Average trailed with a 0.5% advance.
Despite the gains, all three indices stalled at key short-term resistance levels: S&P 500 at 6,290, Nasdaq 100 at 22,920, and Dow Jones Industrial Average at 44,560.
New tariff letters target Brazil
US President Trump issued another batch of tariff letters, this time imposing a steep 50% levy on Brazil, marking the highest tariff rate announced thus far. Brazil is notably the first country outside the original list of targeted trade partners since April’s “reciprocal tariff” plan. The move appears to signal a broader warning to BRICS nations, with India also receiving a warning of a potential 10% tariff.
Asia stock markets mixed; Singapore equities lead
Asia Pacific markets showed mixed performance. Japan’s Nikkei 225 slipped 0.6% amid uncertainty over trade talks with the US. Meanwhile, Hong Kong’s Hang Seng Index advanced 0.5%, holding above its 50-day moving average at 23,690. Singapore’s Straits Times Index extended its bullish streak, rising 0.4% to hit a new record high of 4,074.
US dollar weakens; Aussie and Gold gain
The recent rebound in the US dollar has started to lose steam. The US Dollar Index posted bearish reactions for two consecutive sessions near the 20-day moving average resistance at 97.70.
In Asia trading today, the Australian dollar outperformed with a 0.24% gain against the greenback, followed by the British pound (+0.17%) and the euro (+0.14%).
Gold (XAU/USD) also benefited from the softer dollar, recovering from a -0.6% drop on Wednesday to gain 0.3% intraday. It traded at US$3,325, well above the previous session's low of US$3,282.
Economic data releases
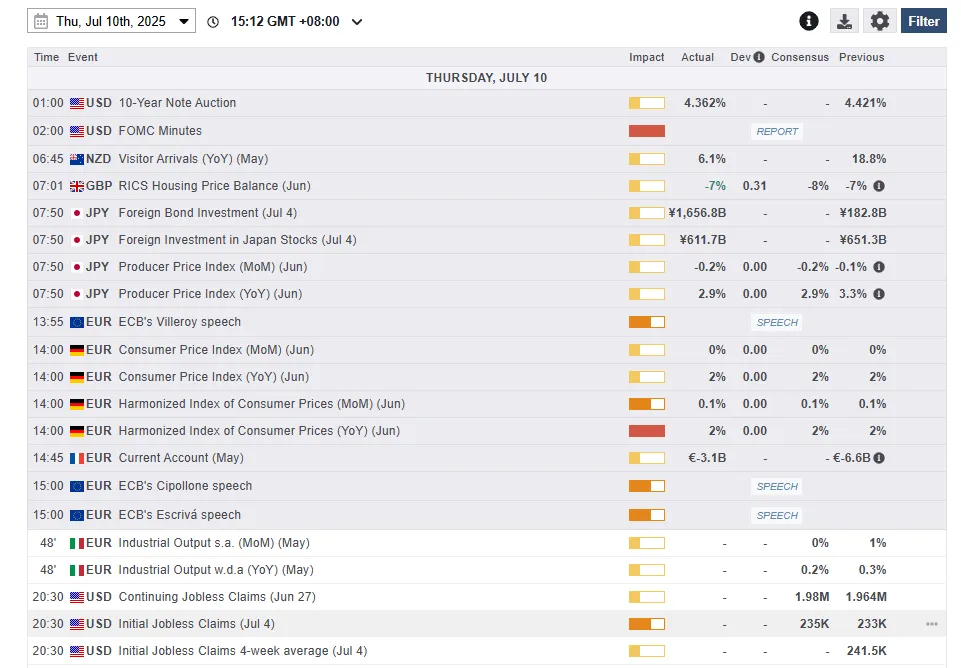
Fig 1: Key data for today’s Asia mid-session (Source: MarketPulse)
Chart of the day – Dow Jones Industrial Average at risk of a minor corrective decline
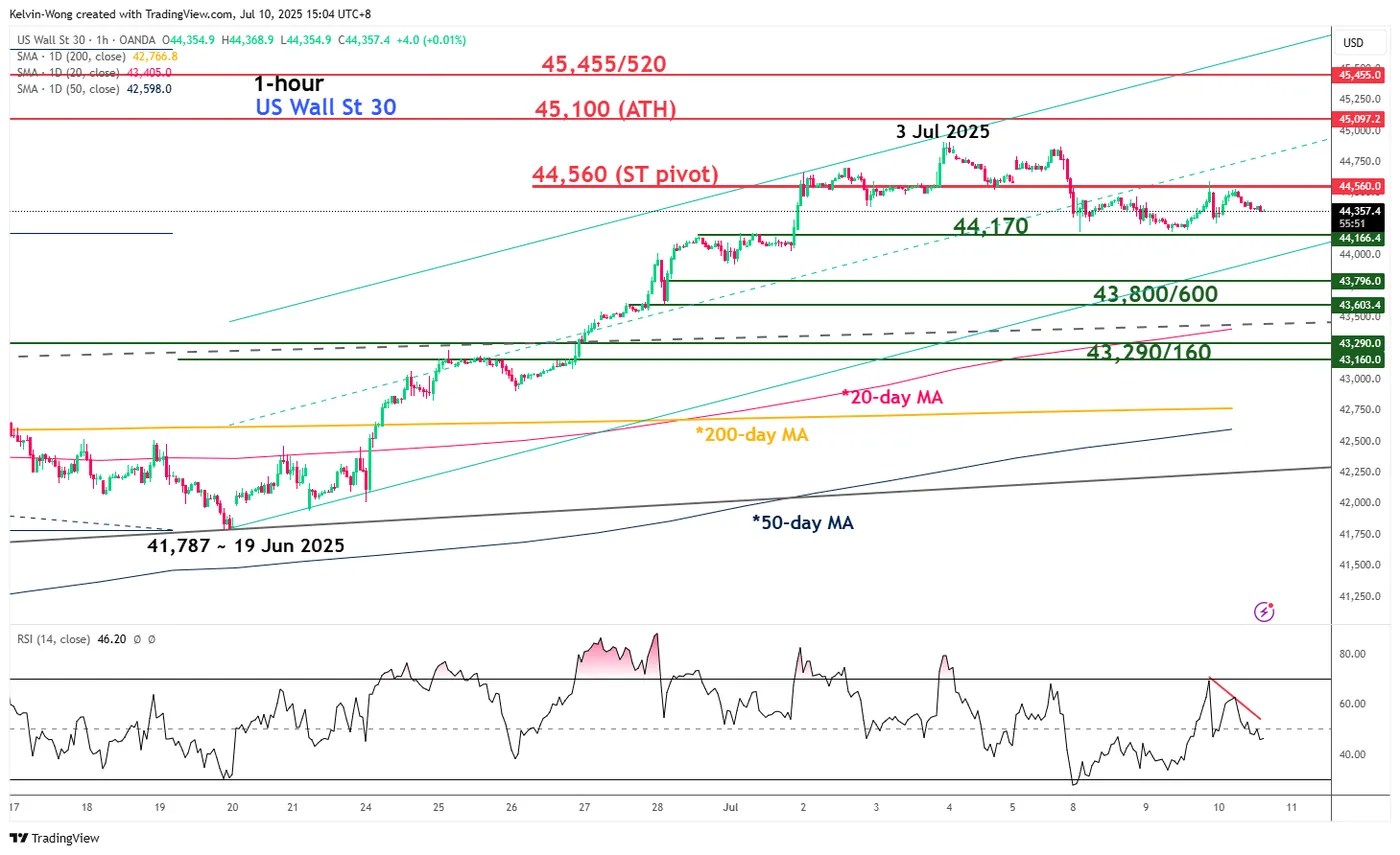
Fig 2: US Wall Street 30 CFD Index minor trend as of 8 July 2025 (Source: TradingView)
Since hitting its recent 3 July intraday high of 44,914, the price actions of the US Wall Street 30 CFD Index (a proxy of the Dow Jones Industrial Average futures) have traded sideways, and several short-term technical elements are suggesting an imminent potential minor corrective decline sequence within its medium-term uptrend phase.
Firstly, the US Wall Street 30 CFD Index has continued to trade below the median line of a minor ascending channel in place since the 19 June low of 41,787. Secondly, the hourly RSI momentum indicator has just flashed out a bearish divergence condition near its overbought region, which indicates upside momentum has started to ease (see Fig 2).
Watch the 44,560 short-term pivotal resistance, and a break below 44,170 is likely to trigger a minor corrective decline sequence to expose the next intermediate support at 43,800/43,600 (also close to the 20-day moving average) in the first step.
On the flip side, a clearance above 44,560 invalidates the bearish scenario to resume the impulsive bullish up move sequence to retest the current all-time high of 45,100 printed in December 2024 before the next intermediate resistance comes in at 45,450/45,520 (Fibonacci extension cluster levels).
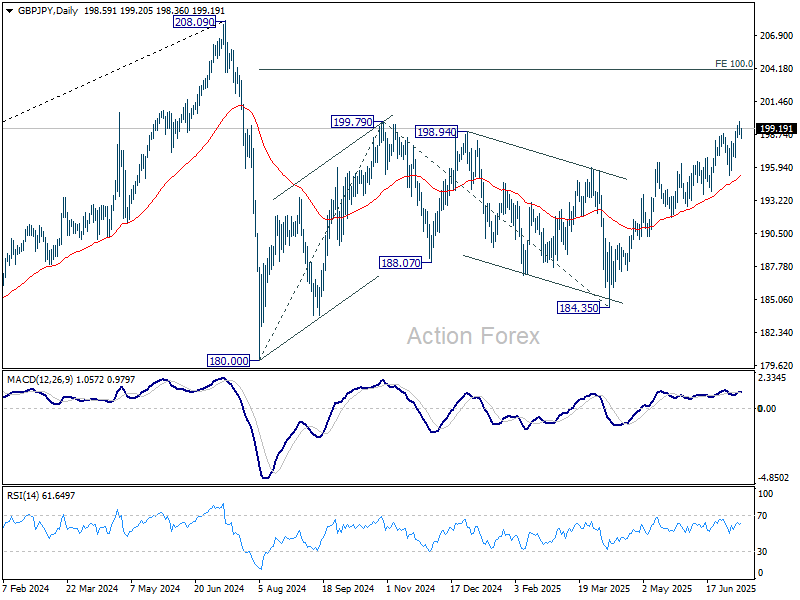
GBP/JPY Daily Outlook
Daily Pivots: (S1) 198.42; (P) 199.12; (R1) 199.50; More...
Intraday bias in GBP/JPY is turned neutral with current retreat, and some consolidations would be seen below 199.80 temporary top. Further rise is expected as long as 195.33 support holds. Break of 199.80 will resume the rise from 184.35 to 100% projection of 180.00 to 199.79 from 184.35 at 204.14 next.
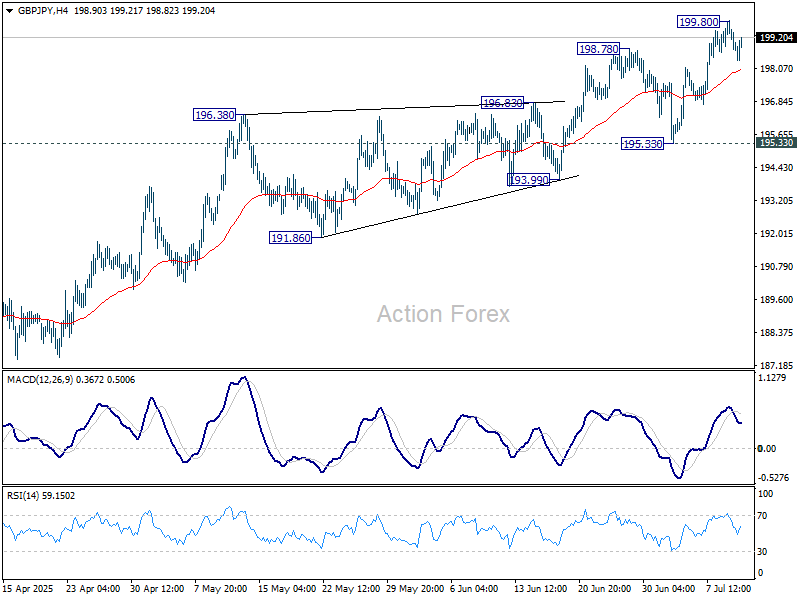
In the bigger picture, price actions from 208.09 (2024 high) are seen as a correction to rally from 123.94 (2020 low). The pattern might still extend with another falling leg. But in that case, strong support should be seen from 38.2% retracement of 123.94 to 208.09 at 175.94 to contain downside. Meanwhile, decisive break of 208.09 will confirm long term up trend resumption.
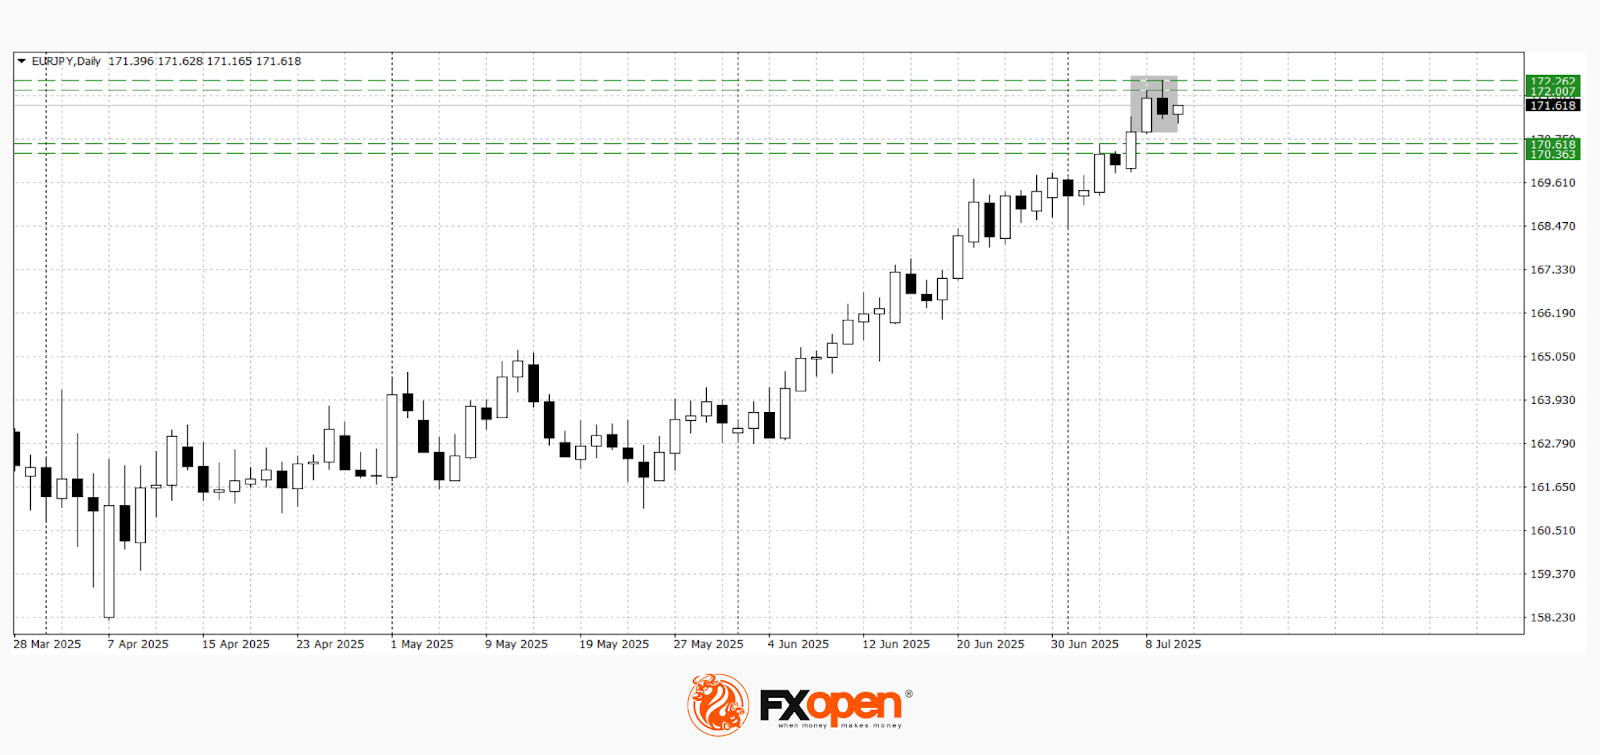
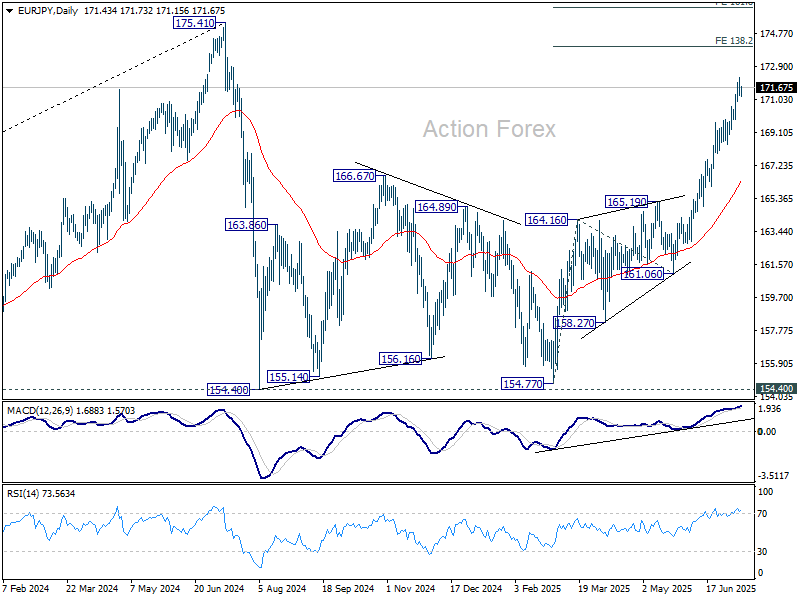
EUR/JPY Daily Outlook
Daily Pivots: (S1) 171.10; (P) 171.69; (R1) 172.11; More...
Intraday bias in EUR/JPY is turned neutral with current retreat, and some consolidations could be seen below 172.25 temporary top. Downside should be contained above 168.44 support to bring another rally. On the upside, break of 172.25 will extend the rise from 154.77 to 138.2% projection of 154.77 to 164.16 from 161.06 at 174.03.
In the bigger picture, price actions from 175.41 (2024 high) are seen as correction to up trend from 114.42 (2020 low). The pattern might still extend with another falling leg. But in that case, strong support should be seen from 38.2% retracement of 114.42 to 175.41 at 152.11 to contain downside. Meanwhile, decisive break of 175.41 will confirm long term up trend resumption.
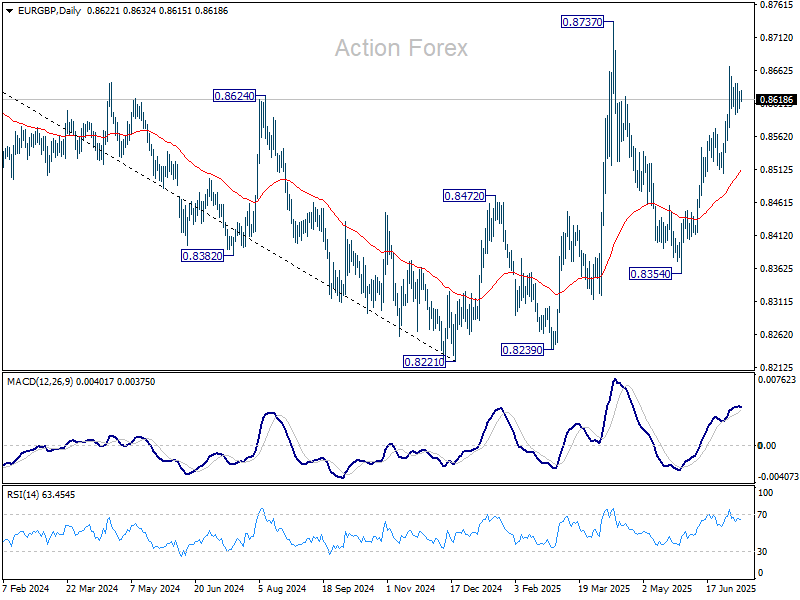
EUR/GBP Daily Outlook
Daily Pivots: (S1) 0.8612; (P) 0.8622; (R1) 0.8638; More...
Intraday bias in EUR/GBP remains neutral as consolidations continue below 0.8668. Further rise is expected as long as 0.8506 support holds. Above 0.8668 will target a retest on 0.8737 high. Decisive break there will resume the whole rise from 0.8221 low.
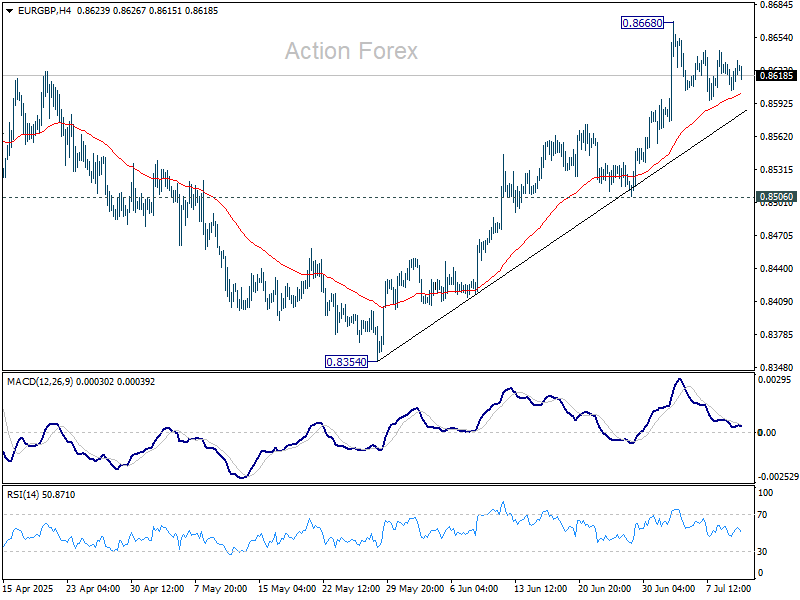
In the bigger picture, the structure from 0.8221 medium term bottom are not impulsive enough to suggest that it's reversing the downside from 0.9267 (2022 high). But even if it's a correction, firm break of 0.8737 will still pave the way to 61.8% retracement of 0.9267 to 0.8221 at 0.8867.
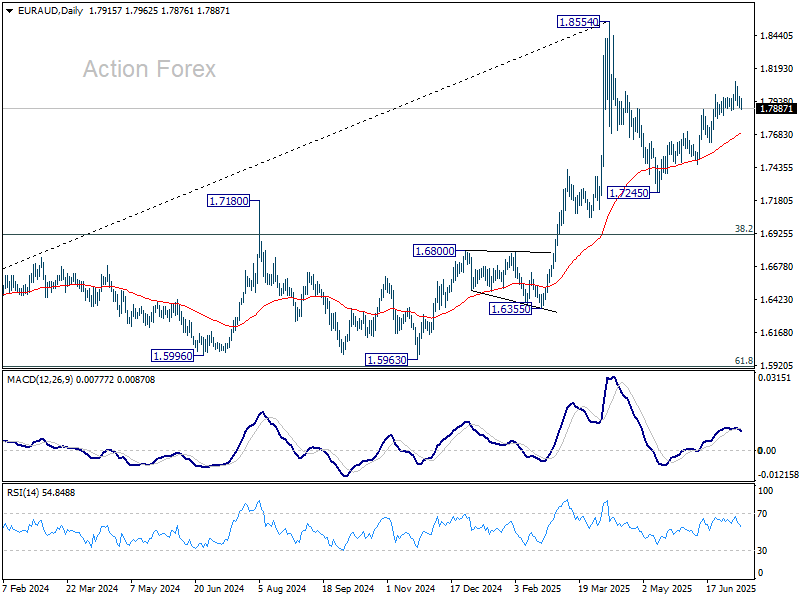
EUR/AUD Daily Outlook
Daily Pivots: (S1) 1.7896; (P) 1.7938; (R1) 1.7979; More...
Intraday bias in EUR/AUD remains neutral and further rise is mildly in favor as long as 1.7872 support holds. Above 1.8094 will resume the rebound from 1.7245. However, firm break of 1.7872 will argue that this rebound has completed with three waves up t to 1.8094. Intraday bias will then be back on the downside for 1.7459/7705 support zone instead.
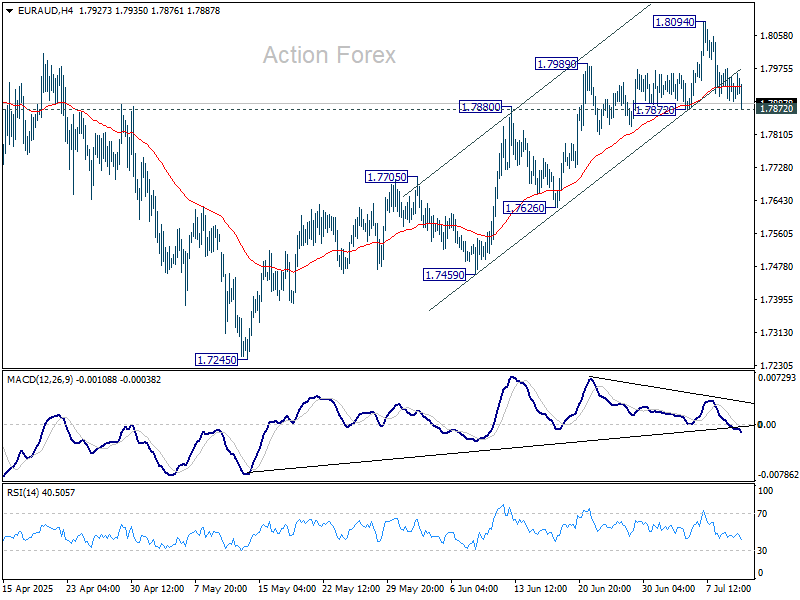
In the bigger picture, price actions from 1.8554 medium term are seen as a corrective pattern. While deeper pullback might be seen, downside should be contained by 38.2% retracement of 1.4281 (2022 low) to 1.8554 at 1.6922 to bring rebound. Up trend from 1.4281 is expected to resume at a later stage.