Sample Category Title
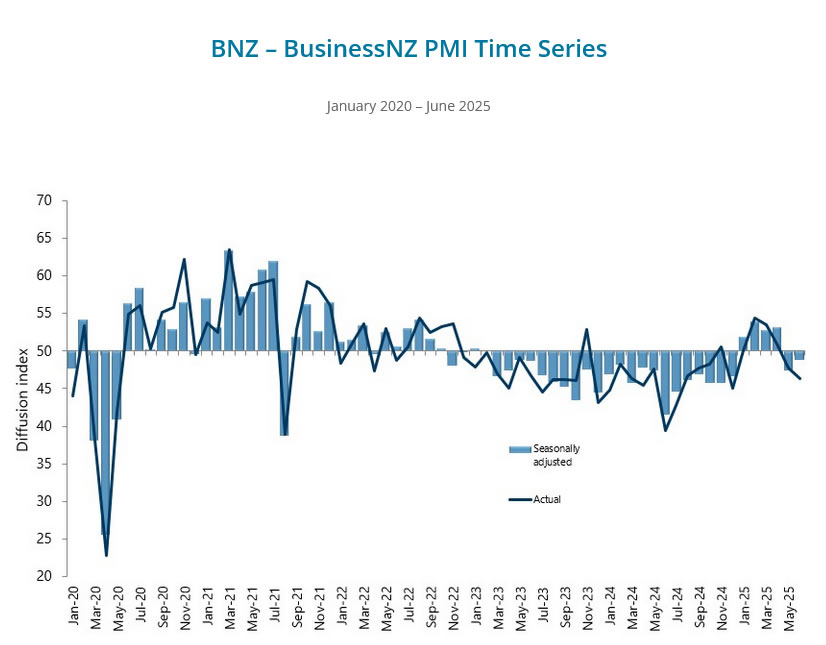
New Zealand BNZ manufacturing rises to 48.8, conditions still very tough
New Zealand’s manufacturing sector showed modest signs of stabilization in June, with the BusinessNZ Performance of Manufacturing Index rising from 47.4 to 48.8. While still signaling contraction, the gain was underpinned by an encouraging rebound in new orders, which jumped from 45.4 to 51.2—breaking back into expansion. Employment (47.9) and production (48.6) also improved slightly, though both remained under the 50 threshold. The headline PMI remains well below the historical average of 52.5.
The proportion of negative comments from respondents held steady at 65.5% (May 64.5), with widespread concerns over weak consumer demand, high living costs, and a murky economic outlook. Input cost pressures and a drop in construction activity also continue to weigh on manufacturing sentiment.
BNZ Senior Economist Doug Steel said that despite hopes of recovery, "conditions are still very tough." All key sub-indices remain below their long-run averages, highlighting that while some green shoots are emerging, the overall manufacturing environment is still struggling to gain traction.
Fed’s Daly sees two cuts in 2025, says tariff-driven inflation may not materialize
San Francisco Fed President Mary Daly said overnight that the time has come to seriously consider lowering interest rates, citing the need to preserve the current strength of the US economy. “I really am of the view that it’s time,” she said, adding that two rate cuts this year now look like a “likely outcome.” Nevertheless, Daly noted that her preferred timing points to a potential move in the fall, aligning her with the broader consensus on the FOMC, even if some colleagues are advocating for action as early as July.
Daly downplayed concerns that the latest wave of tariffs would necessarily spark inflation, arguing that companies are increasingly absorbing costs or adapting rather than fully passing them on. “It’s possible it just doesn’t materialize,” she said, referring to fears of lasting inflation driven by trade policy.
Cautioning against excessive delay, Daly warned that waiting for persistent inflation before acting could result in a policy mistake. “It’s useful now to sort of recognize that waiting for inflation to rise or become persistent could leave us behind,” she said, emphasizing her desire to stay ahead of the curve.
Fed’s Waller backs July cut, rejects political motive in push for easing
Fed Governor Christopher Waller made a rare call for immediate easing, stating that inflation has fallen far enough to support a rate cut as early as this month. Speaking in Dallas overnight, Waller said the policy rate is "too tight" given current inflation dynamics and that July presents a viable window for action. “I just made the argument… we could consider cutting,” he said, while acknowledging he’s "kind of in the minority on this".
Waller dismissed concerns that recent tariffs should delay easing, noting that their impact has so far been narrow and contained. He emphasized that the Fed’s job is to respond to broad inflation trends, not isolated price spikes. “If inflation is coming down, you don’t need to be as restrictive anymore,” he said.
He also emphasized "it's not political", saying his position was grounded in economics. With inflation easing, a steady labor market, and the Fed’s rate still well above its long-run neutral level, Waller said a July move would be justified based on data alone.
Cliff Notes: Time to Assess
Key insights from the week that was.
In Australia, the RBA’s decision to leave the cash rate unchanged at 3.85% came as a surprise to most market participants and economists who were anticipating a 25bp cut. Notably, the first-ever release of unattributed votes showed it was a split decision, with 6 members in favour of holding and 3 against. While the Board recognised continued progress with inflation – now within the target range and close to the midpoint on more timely measures – part of its justification to delay further policy relief rested on recent monthly data being “at the margin, slightly stronger than expected”. Moreover, the Board continued to emphasise uncertainty on many fronts, including: the impact of US tariffs on global trade and growth; the shape of the recovery in Australian domestic demand; and tightness in the labour market. All of these factors have the potential to materially impact Australian inflation over time.
As summarised by Chief Economist Luci Ellis in a video update midweek, in opting to delay rate relief, the Board is looking to confirm inflation is continuing to track towards the midpoint of the target range via the detailed quarterly inflation data due 30 July. We expect this condition to be met and the Board to deliver a 25bp rate cut at its August meeting, to be followed by another three 25bp rate cuts on a quarterly timetable to a broadly neutral cash rate of 2.85% by mid-2026.
Before moving offshore, it is worth quickly noting that the latest NAB business survey provided a more positive read on both conditions and confidence this week, up 8pts and 3pts respectively. That said, these gains follow an extended run of weak readings. Until a more robust recovery in consumer demand takes hold, business conditions are likely to remain fragile.
Offshore, the focus was on the timing and scale of US tariffs as the post Liberation Day 90-day negotiation period ended.
Through the week, US President Donald Trump and the White House began to outline the tariff rates that will be imposed on US imports from individual countries beginning 1 August. The proposed rates are broadly aligned with the original "reciprocal" tariffs announced on Liberation Day, although there are exceptions. Brazil is the best example; their exports to the US will face a 50% tariff from 1 August compared to the 10% tariff proposed at the beginning of April, and were justified by President Trump on both trade and political grounds. This followed a broader threat from President Trump to impose an additional 10% tariff on countries who “align” themselves with the BRICs nations (now a group of 11 nations, led by Brazil, Russia, India and China) having perceived some of their policies as “Anti-American”. Copper imports to the US were also targeted this week, a 50% tariff to be added on top of existing country-specific tariffs from 1 August. And President Trump also confirmed plans to implement a 200% tariff on pharmaceutical imports to the US at a later date.
Based on the announcements to date, US allies in Asia such as Japan and South Korea will not receive preferential treatment, the 25% tariff rate applied to imports from Japan and South Korea only marginally below China’s 30% rate and above Vietnam’s 20% (for its domestic production). Just as we go to press, President Trump has also announced a 35% tariff for Canada and is eyeing a 15-20% rate for most other nations.
For Asia, it should be recognised that existing tariffs and exemptions mean the effective rate for Japan and South Korea is closer to Vietnam’s 20%, and that for China it is circa 40%. Still, the latter rate is manageable for China, and the terms the US is agreeing with other Asian nations such as Vietnam do not stop China from continuing to diversify its production base and political connections across the region. Counter to the US’ intent, a likely consequence of the US taking a hard line on the BRICs is a strengthening of China’s economic and financial ties with the rest of the group, opening up new opportunities for both commodity supply and export growth.
Coming back to Washington, the minutes of the FOMC's June meeting showed Committee members were positive on the outlook for the economy at the time of the meeting, believing "the risks of higher inflation and weaker labor market conditions had diminished... citing a lower expected path of tariffs". Nonetheless, risks "remained elevated" and, from their discussion, the Committee seems to feel they will remain a challenge to assess for some time. More Committee members currently believe risks to inflation are of greater concern than those for the labour market. And, while the consensus view remains that the impact of tariffs on inflation is likely to be temporary, it could still take a number of months to show clearly in the data. There is also a risk above-target inflation proves persistent.
In terms of the immediate outlook for US monetary policy, only a "couple" of members were open to considering a rate cut "as soon as the next meeting". "Some" instead "saw the most likely appropriate path of monetary policy as involving no reductions in the target range for the federal funds rate this year". Remaining on hold while the myriad of immediate risks are assessed and thereafter taking a very cautious approach to easing looks to be the majority view of the Committee.
Bitcoin Reaches Fresh All-Time High in market-wide breakout — what’s next?
A thesis of failed opportunities by sellers to send the crypto market to correct lower had been a sign of a potential move to new all-time highs, which just happened today.
Cryptocurrencies are in a frenzy, and this happens after months of muted performance and range-bound markets despite the cryptos’ tendency to generate lots of market movement.
A general trend of entries from financial institutions into Cryptocurrencies, allowed by progressively lenient regulations, is bringing non-negligible flows and adding an even more solid backstop demand to digital assets.
Traditional investors are progressively entering the most recent primary market through ETFs, with the latest ETF launch opening the door for Solana.
This comes amid market participants trying to diversify from the US Dollar.
Trump’s frantic policy is creating significant uncertainty, particularly for the Federal Reserve, which is seeing chances to lose some of its political independence. The US President is doing the most to influence the FED board members, regularly insulting Jerome Powell on his Truth Social.
The latest move to all-time highs liquidated many participants who were betting on no-more new highs for Bitcoin – You can take a look at these flows right here.
A $600M liquidation won’t be enough to take markets to continuous all-time highs; however, with a real appetite for risk and Technology investments (as seen with the Nasdaq making daily ATH), the move might just continue.
Bitcoin Daily and Intra-Day analysis
Bitcoin Daily Chart
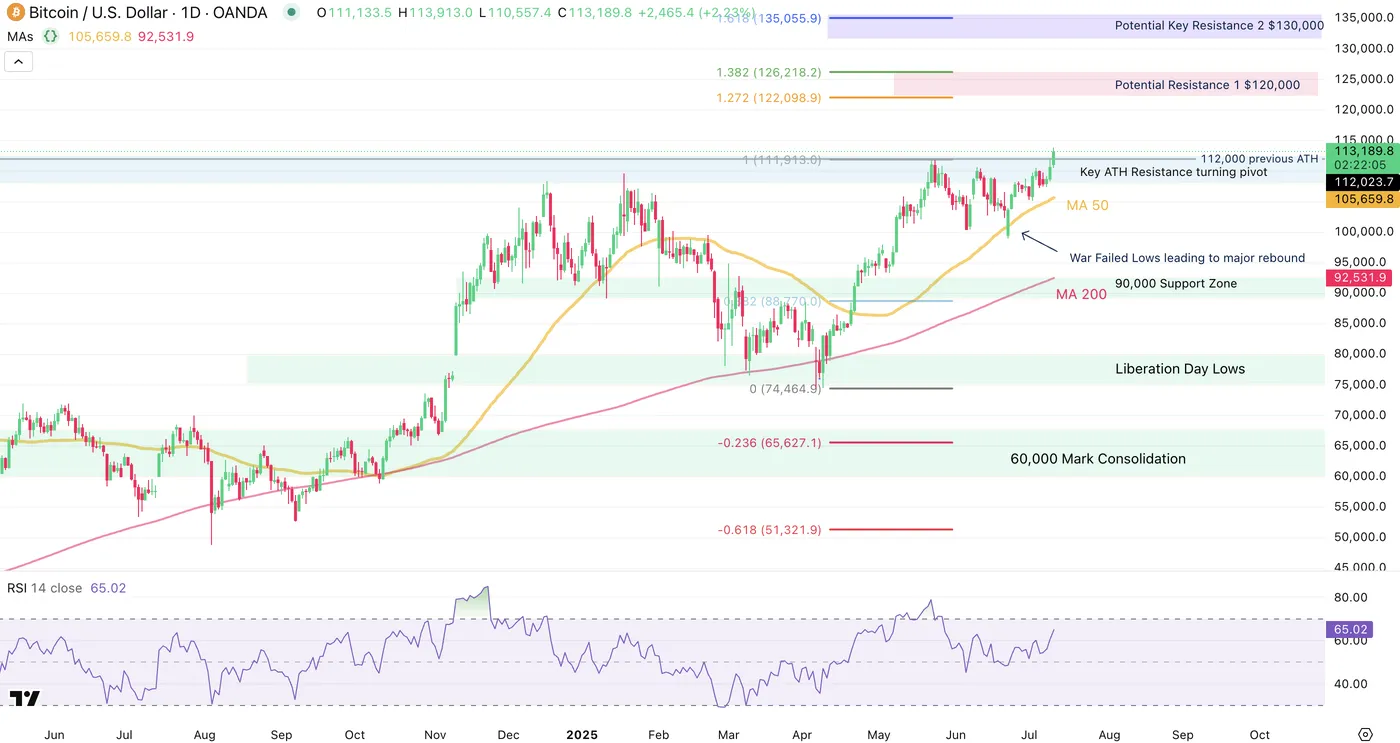
Bitcoin Daily Chart, July 10, 2025 – Source: TradingView
Daily Bitcoin Charts are showing decent strength in the most recent moves up – particularly after War fears failed to create a strong reversal in prices. The latest gap down just breaching the $100,000 mark quickly got bought by dip buyers.
Failed patterns in technical analysis tend to be major signs of reversals, as it is currently the case in Crypto Markets.
After breaching the $113,000 level, Fibonacci extensions (127% to 138%) point to Potential Resistance at $120,000, and a further breakout to Potential Key Resistance at $135,000 (161.8%).
You can check this guideline on how to spot potential resistances and new zones of interest in price discovery with fibonacci extensions with this article.
Bitcoin 2H Charts
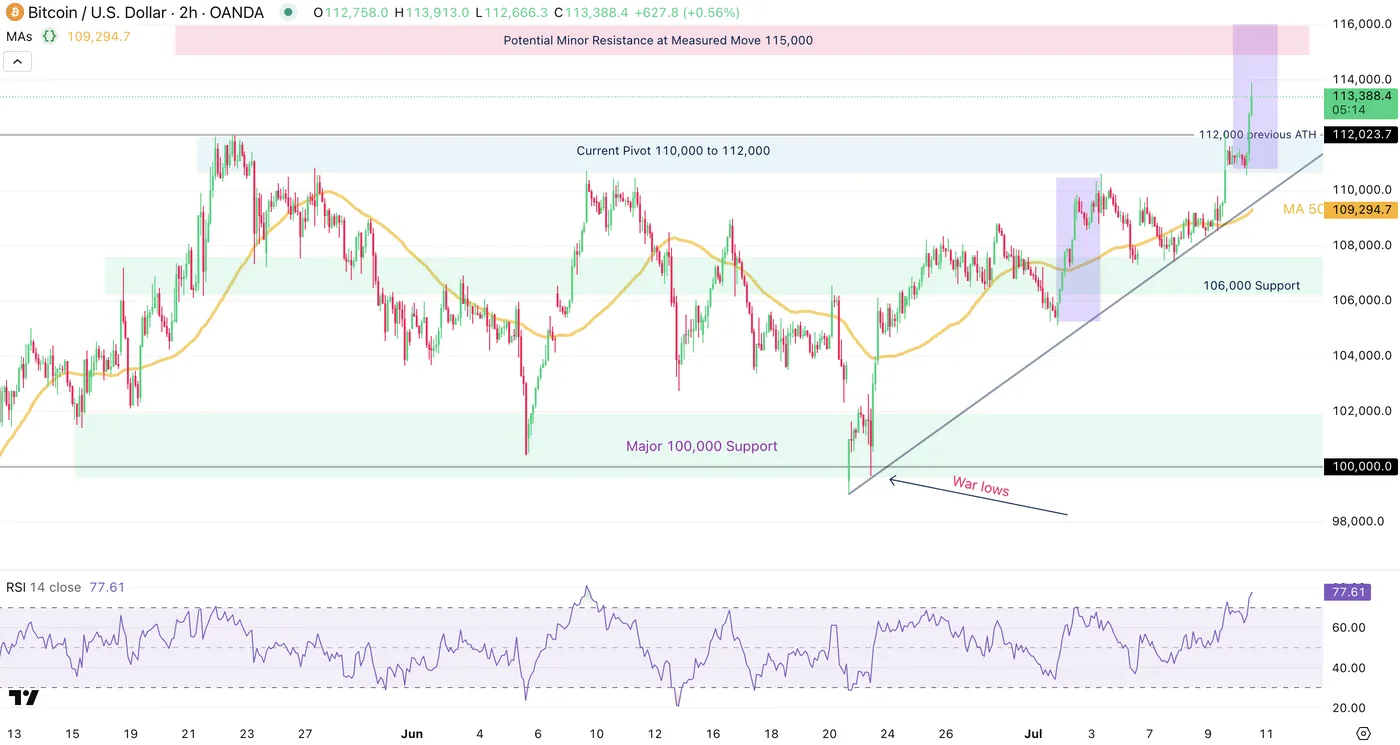
Bitcoin 2H Chart, July 10, 2025 – Source: TradingView
Rangebound conditions in the world's leading cryptocurrency had built-up Volume-At-Price at its all-time highs, good conditions to launch the crypto to discover new levels.
A fail to retest again the lower end of the 100,000 to 110,000 range led to buyers stepping in before, leading to current's impulsive move.
A measured move using the previous impulse points to a 115,000 minor potential resistance. The RSI is largely overbought which may calm the buying flows, however only temporarily.
It will be interesting to look at the reaction to a potential retest of the 110,000 pivot to spot if more buyers step in – in the meantime, the direction has higher probabilities of more upside than downside, that is if nothing crazy happens in macro.
Crypto Market Cap
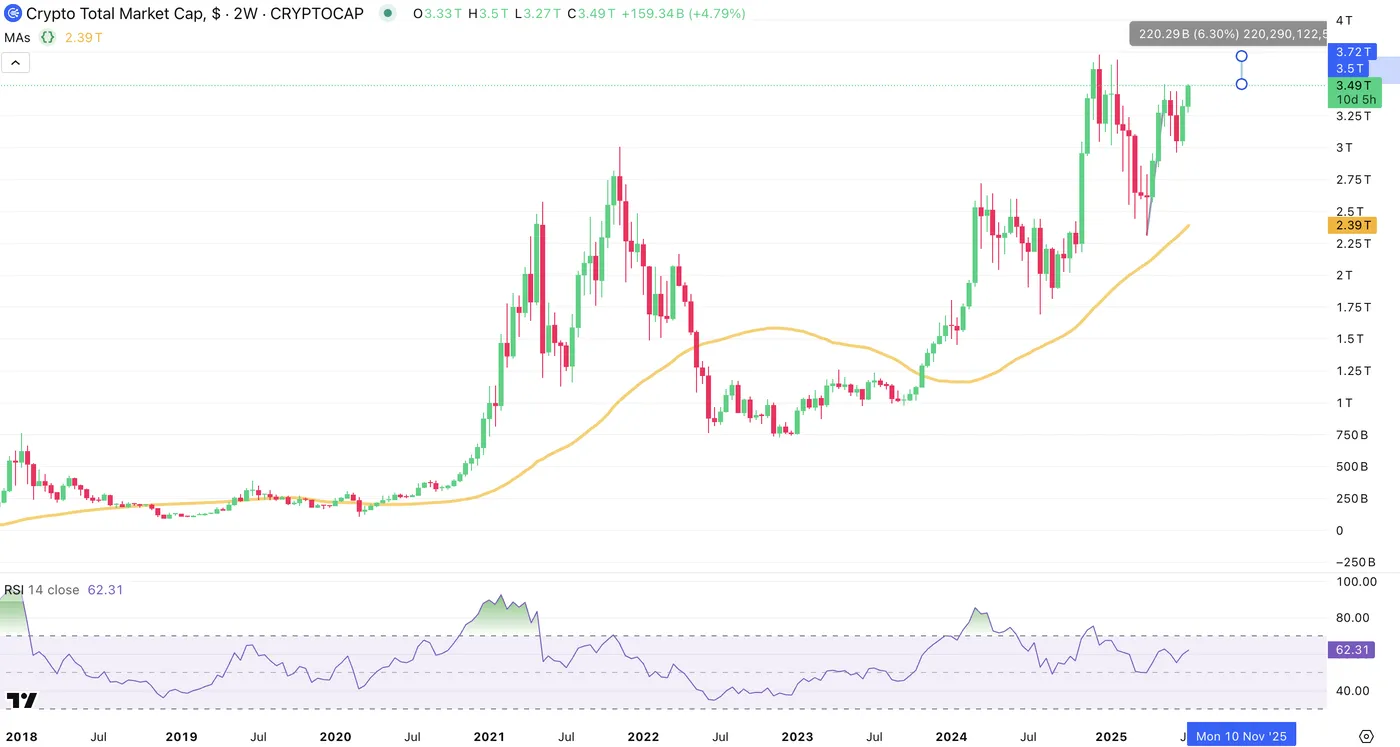
Crypto Total Market Cap, July 10, 2025 – Source: TradingView
The overall market cap still hasn't caught up to the December 2024 $3.86T highs, and the way this impulsive move is going, it seems that excepted any surprising negative surprise or geopolitical turmoil, we should be at least going back to the previous highs.
Markets are currently standing about 6% to the Market Cap highs.
With Bitcoin making all-time highs, it might drag up other altcoins with it – Some names like ADA, SUI, XRP and others are getting lifted by the newfound bullish sentiment.
Safe Trades!
USD/CAD Eyes Gains as WTI Oil Slips. 1.3750 Incoming?
USD/CAD has been on a grind off late having finally broken out of a brief period of consolidation thanks in part to a moderate US Dollar recovery and stalling Oil prices. USD/CAD has however, failed to find acceptance above the 1.3700 handle thus far and this may be something to note for bulls moving forward.
Is the US Dollar set to benefit from Tariffs?
The US Dollar and its struggles have been well documented of late with market participants seemingly losing faith in the greenback as a safehaven. However, as the tariff deadline approaches and trade deals are announced the US dollar has shown signs of a recovery.
According to ING THINK, the average tariff rate, currently at 14%, could rise to 20%, but how it happens is crucial for the dollar. Gradual, sector-specific tariffs would likely hurt the dollar less than sudden, drastic measures. Gradual changes might also cause some inflation, keeping the Fed cautious for longer, which could support the dollar. This is something which i see as a possibility as well and is worth paying attention to as tariffs continue to be finalized
Minutes from the Fed's June meeting show most members remain cautious or hawkish, with only Waller and Bowman leaning towards a more dovish stance.
That leaves the question, have we seen the bottom for the US Dollar in 2025? From a technical standpoint the DXY has bounced off a multi-year trendline which should it hold will likely lead to further upside for the index.
Oil Prices Slips 2.2% and Could Harm Canadian Dollar
WTI Oil has failed to break above the 200-day MA and has fallen around 2.2% today as it threatens a break of the ascending trendline. The bearishness in Oil prices works in favor of further USD/CAD upside given the relationship between the loonie and Oil.
WTI Oil Daily Chart, July 10, 2025
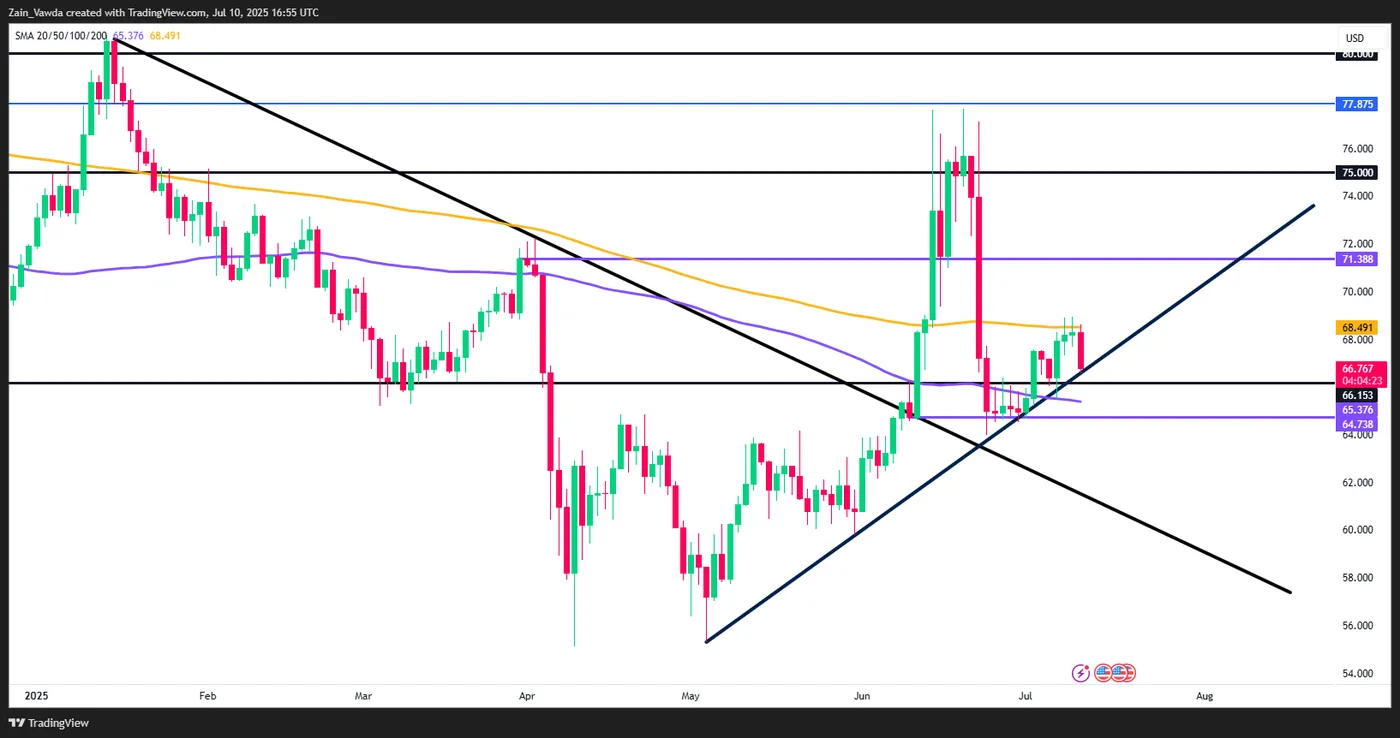
Source: TradingView.com (click to enlarge)
A trendline break faces a key confluence area of support resting between 65.37-64.73 which could prove a tough nut to crack.
Below that a retest of 62.00 could materialize before the psychological 60.00 mark.
A bounce off the trendline could have the opposite impact and cap USD/CADs rise as well.
Technical Analysis - USD/CAD
From a technical standpoint, USD/CAD has failed to gain acceptance above the 1.3700 handle.
A break of the recent trading range may have looked like a potential opportunity but the pair has failed to kick on.
The drop in Oil prices which should have led to a further rise in USD/CAD may be struggling due to the US dollar's indecisive price action which has seen one step forward followed by a step back.
Right now a retest of the 100-day MA at 1.3638 seems more likely than a rise toward the 1.3750 psychological level.
USD/CAD H2 Chart, July 10, 2025
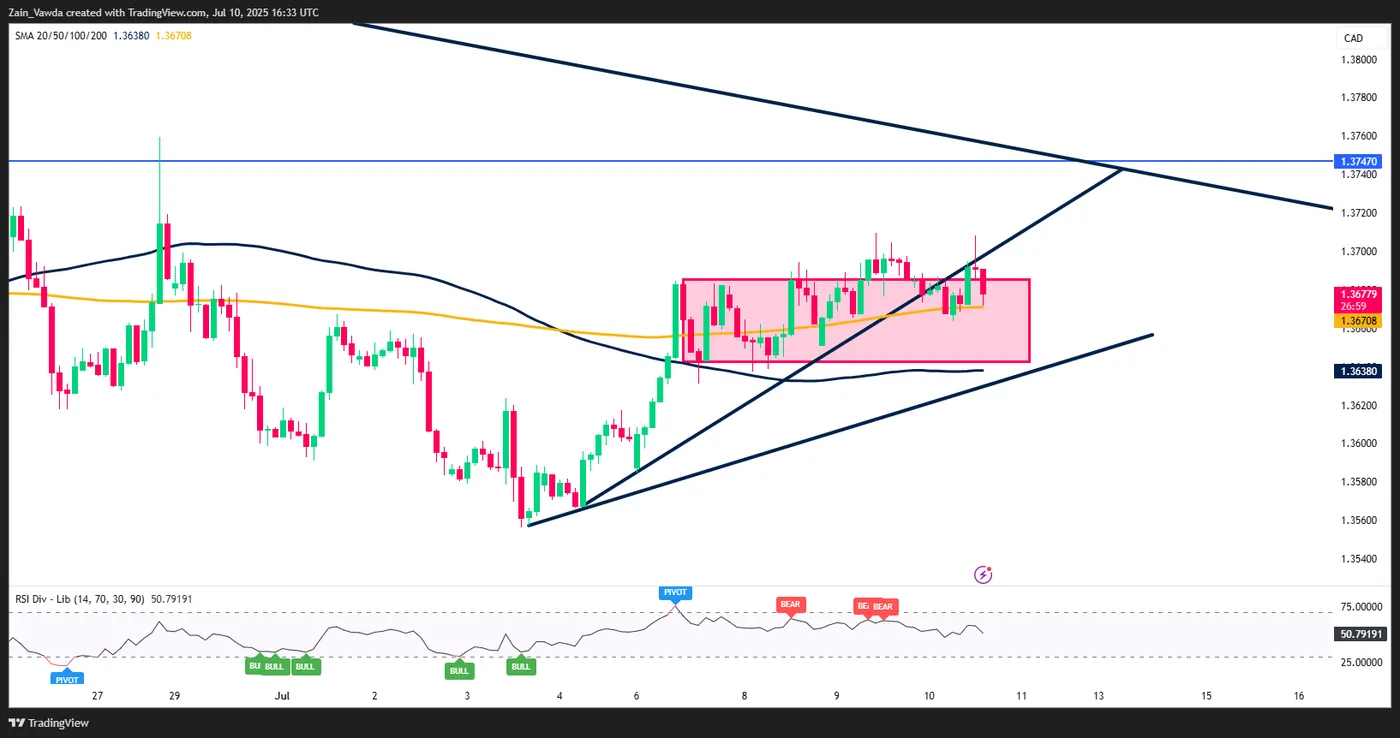
Source: TradingView.com (click to enlarge)
Client Sentiment Data - USD/CAD
Looking at OANDA client sentiment data and market participants are short on USDCAD with 57% of traders net-short. I prefer to take a contrarian view toward crowd sentiment and thus the fact that so many traders are short means USD/CAD prices could rise in the near-term.
However a 57%-43% is not really a major difference and may be seen as a sign of the indecisiveness from both bulls and bears who seem unsure about USD/CADs next direction.
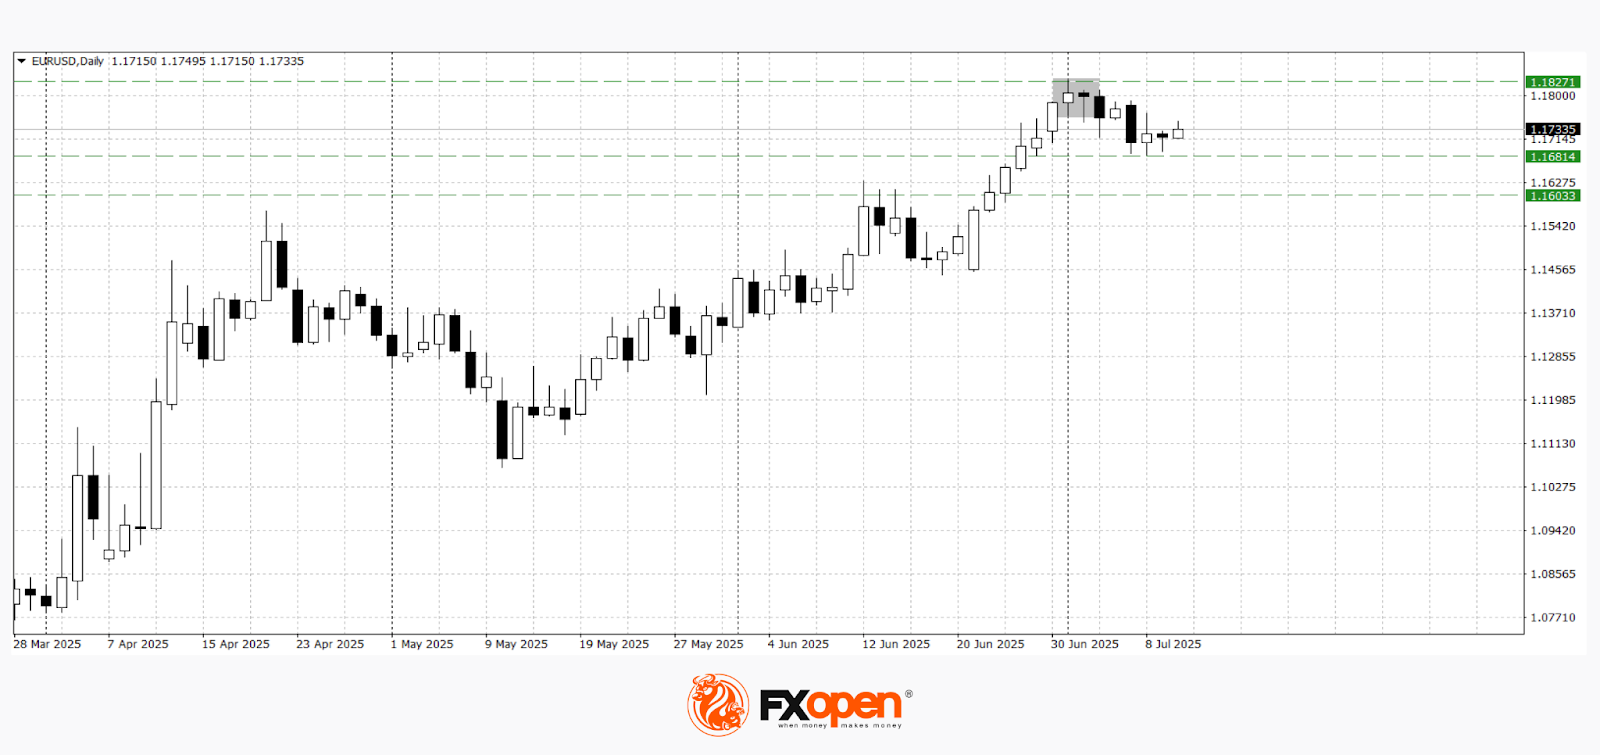
EURCAD Marks a Top Ahead of Canadian Employment
The Canadian Dollar has had a rough year against the Euro, as the joined currency had been printing its best performance in years against its G10 counterparts – A return of the US Dollar is in the building and it is propping upwards North-American currencies in the start of the Second Half of 2025.
After coming close to its 2018 highs, a daily engulfing bearish candle led to a full-handle pullback in EURCAD.
With the ECB attaining the end of its cutting cycle, joining the Bank of Canada which expedited its own cutting cycle due to a struggling Canadian Economy, both interest rates for the Euro and CAD are close to parity (2.75% Canadian Main Rate vs 2.15% ECB Refinancing Rate) – This is leading to a fundamental top to interest rate relative strength.
Tomorrow will see the release of Canadian Employment data, stabilizing close to 21 Million (20,978.1M) and expectations for the 8:30 AM number are unchanged – Data tends to surprise in Canada due to volatile expectations and less participants in surveys.
EURCAD Multi-Timeframe analysis going from the Daily to 1H Charts
EURCAD Daily
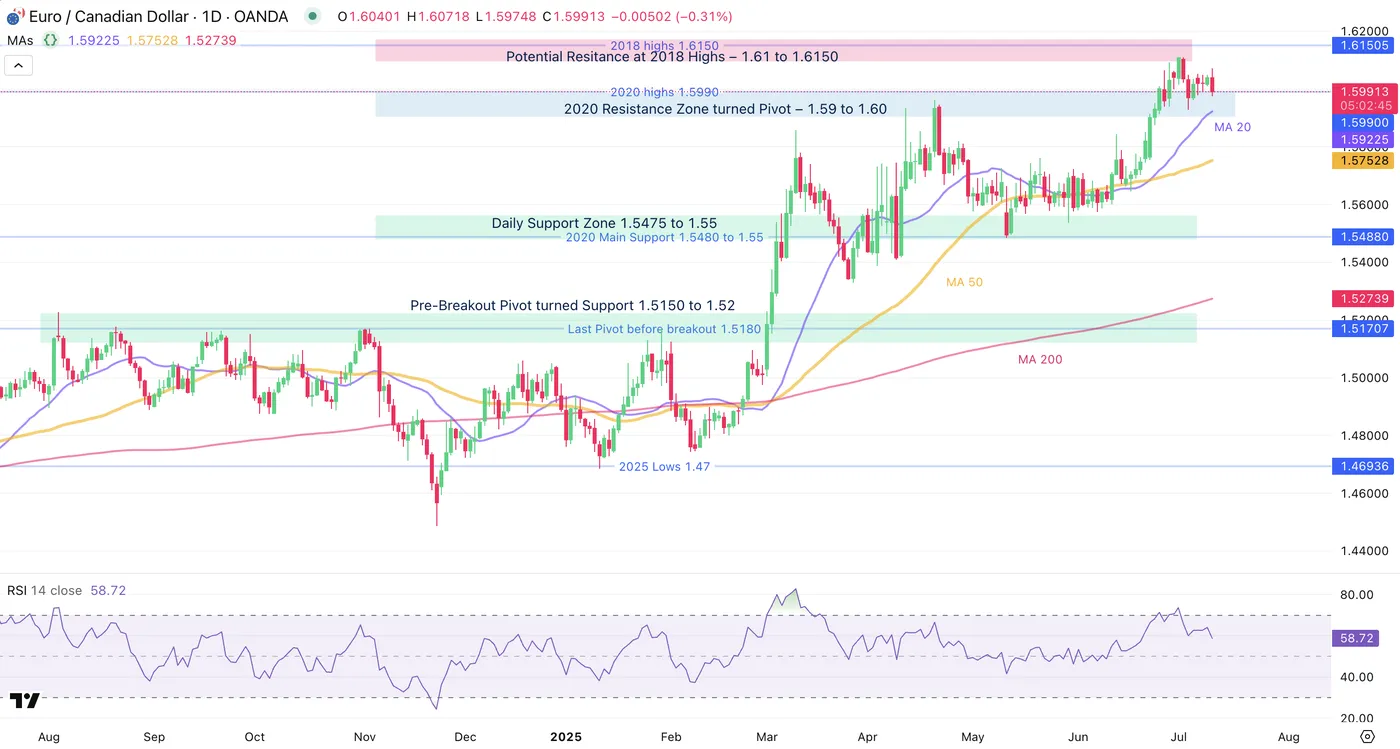
EURCAD Daily Chart, July 10, 2025 – Source: TradingView
As mentioned in the introduction, EURCAD is forming what seems to be an intermediate top, failing to breach the 2018 (1.6150) highs in a bearish engulfing Daily candle. Market interpretation to such candlestick patterns is a failure to hold a strong bullish bar, which can be seen as a sign of major reversal.
Since our last EURCAD analysis, the currency pair attained what was the potential 2018 resistance zone and failed to breach it, with prices currently trading in the 1.59 to 1.60 2020 Resistance Zone turned Pivot.
RSI momentum is in convergence with price action further confirming this idea – anyhow, tomorrow's data will be one of the last hurdles before assuming that prices can be reversing lower.
A rejection higher from the current pivot zone will point to a retest of intermediate highs, while a break of the 20-Day Moving Average (1.59225) will point to a re-entry in the early 2025 range (1.54 to 1.59)
EURCAD 4H Chart
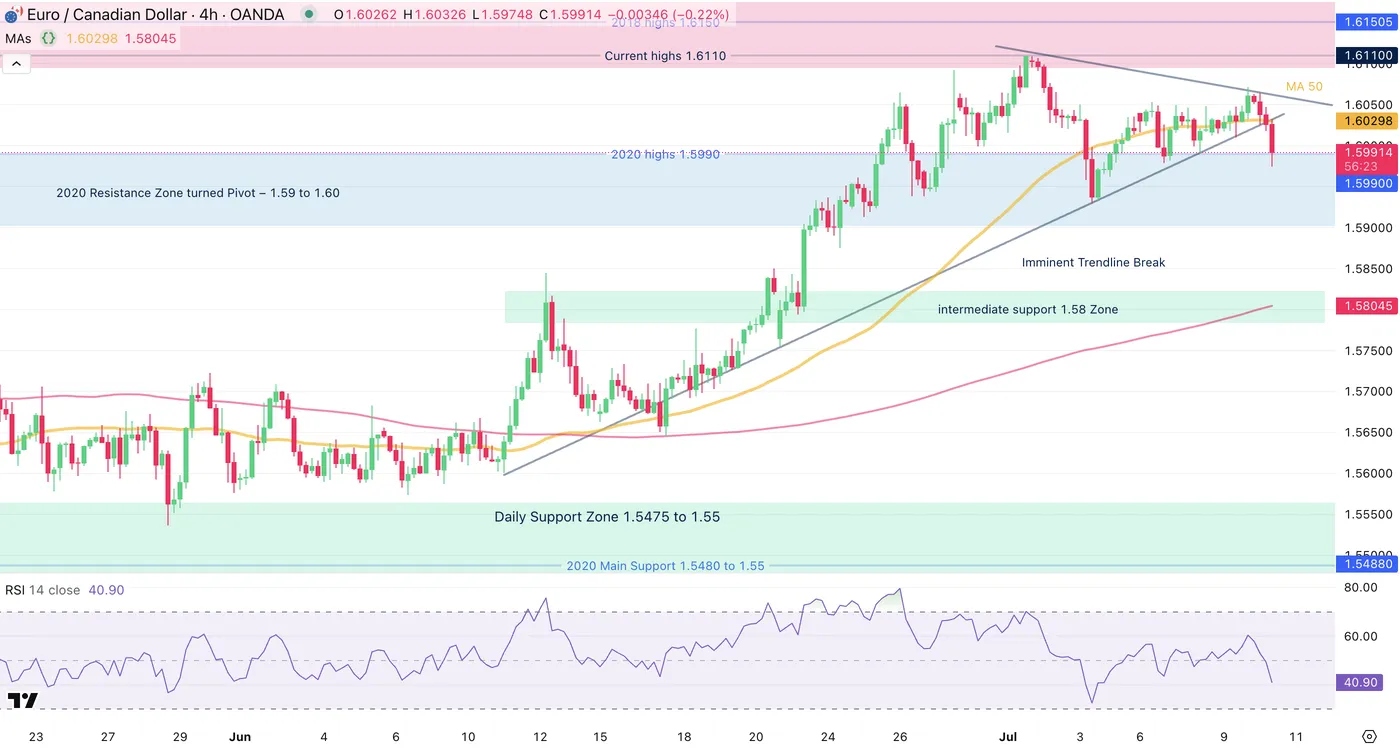
EURCAD 4H Chart, July 10, 2025 – Source: TradingView
Looking closer, we see a few signs to confirm the thesis, particularly with the 4H 50-Period MA coming as immediate resistance and sellers breaching the mid-term upward trendline.
Probabilities will confirm further in a proper entry within the pivot zone and will see more validation if prices close below 1.5930 (last intermediate low) on strong momentum and volume.
Levels to place on your charts:
Support Zones
- 2020 Resistance Zone turned Pivot – 1.59 to 1.60
- Intermediate support 1.58 Zone (confluence with 4H MA 200)
- Daily Support Zone 1.5475 to 1.55
Resistance Zones
- 1.6030 (4H MA 50)
- Current highs 1.6110
- 2018 Resistance Zone between 1.61 to 1.6150
EURCAD 1H Chart
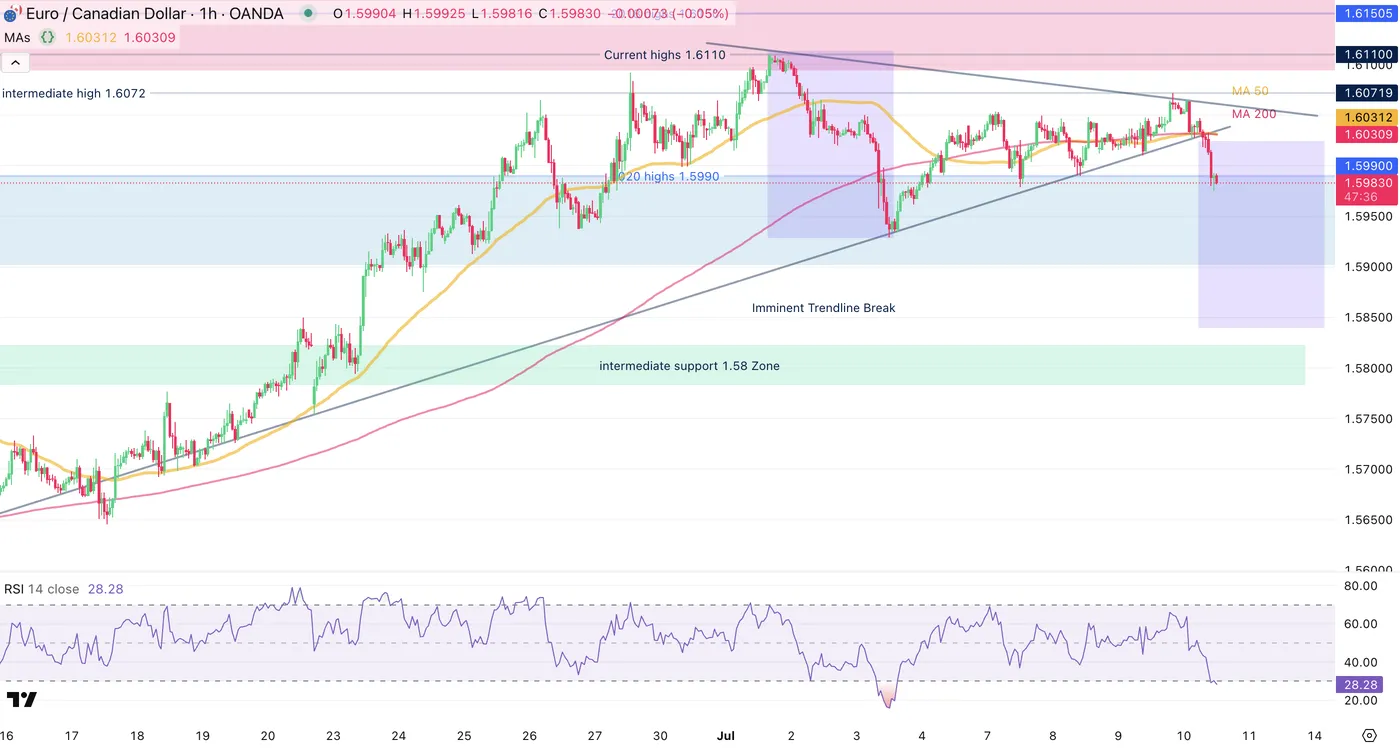
EURCAD 1H Chart, July 10, 2025 – Source: TradingView
Current momentum is oversold on shorter timeframe, pointing to some consolidation in the waiting for tomorrow's 8:30 release.
A potential measured move (purple squares) to the downside using the early July correction may point to a retracement to 1.5850 – that is as long as prices do not rise above the intermediate high at 1.6072.
50 and 200 Hour Moving Averages are also pointing towards lower price action, but do not forget that anything is possible in trading and the current trend may still continue upwards, particularly if tomorrow's number comes in low.
Safe Trades!
Bitcoin Wave Analysis
Bitcoin: ⬆️ Buy
- Bitcoin broke round resistance level 110000.00
- Likely to rise to resistance level 115000.00
Bitcoin cryptocurrency recently broke the round resistance level 110000.00 (which stopped multiple upward impulse waves from the start of this year).
The breakout of the resistance level 110000.00 should strengthen the bullish pressure on Bitcoin in the coming trading sessions.
Given the strongly bullish sentiment seen across the cryptocurrency markets today, Bitcoin cryptocurrency can be expected to rise to the next resistance level 115000.00 (target price for the completion of wave (3)).
FTSE 100 Wave Analysis
FTSE 100: ⬆️ Buy
- FTSE 100 broke key resistance level 8900.00
- Likely to rise to resistance level 9100.00
FTSE 100 index recently broke above the key resistance level 8900.00 (which has been reversing the price from March, as can be seen below).
The breakout of the resistance level 8900.00 continues the active short-term impulse wave 3 of the intermediate impulse wave (3) from the end of June.
Given the clear daily uptrend, FTSE 100 index can be expected to rise to the next resistance level 9100.00 (target for the completion of the active impulse wave 3).