Sample Category Title
BoJ minutes reflect extremely high uncertainties, stresses need to judge without preconceptions
BoJ’s May policy meeting minutes reveal a board wary of “extremely high uncertainties” stemming from global trade tensions. While BoJ left its short-term interest rate unchanged at 0.5%, it sharply downgraded its growth and inflation outlooks, largely due to the expected hit on Japan’s economy from higher US tariffs.
Members reiterated that “if the outlook for economic activity and prices was realized,” further rate hikes would still be appropriate, aligning with gradual normalization. However, A key theme was the need to remain flexible and data-dependent, with many members emphasizing the importance of “carefully examining” the evolving outlook before acting.
Many members warned that it was crucial “to judge whether the outlook… would be realized, without any preconceptions.” One policymaker admitted that the probability of the forecast materializing was “not as high as before,” while another stressed that both upward and downward risks must be weighed.
The minutes also captured divergent internal views. One board member said that “while the Bank would enter a phase of pausing,” policy must remain “nimble and more flexible.” Another warned of the risk that simultaneous supply-chain disruptions and inflation spikes would leave Japan in a difficult position, especially given that “inflation expectations were not as anchored as in the United States.”
Japan’s CPI core jumps to 3.7% as rice prices more than double
Japan’s core consumer inflation (ex-fresh food) accelerated from 3.5% yoy to 3.7% yoy in May, beating expectations of 3.6% yoy and marking the fastest pace since January 2023. The gain was driven by soaring rice costs, which jumped over 100% amid supply shortages. The core-core inflation measure, excluding both fresh food and energy, also quickened to 3.3% yoy from 3.0% yoy, reflecting broadening price pressures.
While the headline CPI edged down slightly from 3.6% yoy to 3.5% yoy, underlying inflation trends continue to exceed BoJ’s 2% target, where they have remained since April 2022.
Also Service prices rose 1.4% yoy in May, up from 1.3% yoy in April, with dining and travel costs gaining momentum—an important sign for BoJ, which monitors this segment closely as a proxy for wage-driven inflation.
Cliff Notes: Labour Market Resilience Critical to the Outlook
Key insights from the week that was.
In Australia, all eyes were on the May Labour Force Survey amid an otherwise quiet domestic calendar. In the event, the level of employment edged slightly lower following last month’s surge, falling by –2.5k in May. While this was on the softer side of expectations, it is worth highlighting that the current trend for employment growth remains stable and robust at a three-month average pace of 2.3%yr, unchanged from five months ago and a strong result versus history.
This modest decline in employment was met with a slight pull-back in the participation rate to 67.0%, allowing the unemployment rate to hold steady at 4.1% for a fourth consecutive month, marking around a year-and-a-half of readings at or slightly above 4.0%. Emphasising the current resilience in labour demand, average hours worked rebounded back towards its long-run trend following prior disruptions, aiding a continued modest downtrend in the underemployment rate.
This latest reading is unlikely to shift the dial for the RBA who consider the labour market tight relative to full employment. Overall, we remain comfortable with our view that the RBA’s next rate cut is most likely to occur in August. The Board is cognisant of the downside risks to global and domestic growth. But the RBA have made it clear they want to adjust policy in a cautious and predictable manner, warranting another quarterly reading on inflation and time to assess global conditions before the balance of risks is re-evaluated.
Across the Tasman, New Zealand GDP rose by 0.8% in the March quarter, slightly ahead of market forecasts, albeit not as broad based as anticipated. With the economy regaining its footing sooner than expected after last year’s sharp downturn, our NZ economics team continue to expect the RBNZ to take the opportunity to pause and assess at its July OCR review.
Further afield, the US FOMC kept rates steady at their June meeting, believing a reactive approach to policy is prudent. Broadly, the FOMC remain positive on the health of the US economy, a view based on the underlying pulse in private final demand to abstract from trade volatility. The Committee’s median GDP forecast was revised down from 1.7%yr to 1.4%yr in 2025 and from 1.8%yr to 1.6%yr in 2026, reflecting the impact on confidence and economic activity of the Administration’s trade policies. Still, the revised forecasts are only marginally below the FOMC’s estimate of trend growth (1.8%yr), and the unemployment rate is expected to peak around 4.5%, just above the full employment level of 4.2%.
On inflation, the FOMC are clear that someone will eventually have to pay for the tariffs, and it is most likely to be the US consumer. Still, the net impact on consumer inflation is seen as modest and short lived. Annual headline and core inflation is forecast to top out around 3.0% at end-2025 then decelerate quickly back towards target, to 2.4%yr in 2026 and 2.1%yr come 2027. The full range of forecasts from Committee members points to a greater degree of apprehension over the risks for inflation than economic activity and employment. The top-of-range forecast for core inflation is 3.5%yr in 2025 and around 3.0%yr in 2026 and 2027. These are outcomes that would require monetary policy to remain restrictive throughout this period instead of returning to neutral as per the Committee’s median view.
We continue to see downside risks to growth and employment compared to the FOMC’s expectations, forecasting GDP growth of 0.9%yr,1.0%yr and 1.5%yr in 2025–2027 and a sustained lift in the unemployment rate to 4.8%. But we also expect to see more persistent inflation pressures and risks in 2026 and 2027, more as a result of supply constraints than delayed tariff effects. In our view, it is therefore most probable that the FOMC will be on hold at a mildly contractionary level of 3.875% in 2026 and 2027 after two 25bp cuts in H2 2025.
The Bank of England’s Monetary Policy Committee also kept Bank Rate unchanged at 4.25% in June. Six committee members supported the decision, while three members voted for a 25bp cut. The minutes revealed the majority view was supported by the recent pickup in inflation, which is expected to persist in the second half of the year. Meanwhile, those in favour of lowering Bank Rate emphasized the further loosening in labour market conditions. Indeed, the whole committee acknowledged that, together with weak underlying GDP growth, the labour market is pointing to a margin of slack opening up over time. While pay growth is moderating as a result, the committee are yet to be convinced it is dampening consumer inflation.
The MPC continued to assess that risks to inflation are two-sided, particularly given the recent increase in energy prices and “heightened unpredictability in the economic and geopolitical environment”. The MPC’s forward guidance was left unchanged, emphasising “a gradual and careful approach to the further withdrawal of monetary policy restraint”. To date, this approach has been consistent with a 25bp cut per quarter, a pace we believe will be maintained through the remainder of 2025, with the next 25bp cut coming in August after further evidence of moderating pay growth.
In Japan, the Bank of Japan held the policy rate steady at 0.5% and announced its purchase of Japanese Government Bonds (JGBs) through March 2027. The pace of purchases will be reduced by ¥200bn per quarter from June quarter 2026 to March quarter 2027 compared to the ¥400bn per quarter reduction outlined in last year’s plan and in place until March quarter 2026. The messaging around tapering was consistent with the 2024 statement: the BoJ is prepared to intervene should long-term interest rates rise sharply, and will amend the plan at subsequent meetings if necessary.
To provide greater liquidity to the market, there were two changes to the Securities Lending Facility. These include broadening the bonds available for lending to 10-year JGBs maturing after 2031, and continuing to lend from its balance sheet until outstanding bonds (i.e. those not owned by the BoJ) to reach ¥1.5trn (previously ¥1.2trn) – changes that likely come as a result of feedback from market participants.
The Committee continues to describe financial conditions as ‘accommodative’ and believes achieving their inflation target in the medium-term remains probable. Though, given global uncertainty, we maintain the BoJ will wait until the March 2026 RENGO decision before raising rates again – continued robust wage growth and passthrough to inflation warranting taking the next step.
Finally to China. Signs of improving confidence and effective policy were evident in the latest consumption data, retail sales growth accelerating from 5.1%yr in April to 6.4%yr in May (5.0%ytd) mostly as a result of discretionary spending. However, there was no such improvement in the property market, new and existing home prices falling in May, respectively -0.2% and -0.5%, and property investment still down 10.7%ytd. Industrial production continues to carry solid momentum, 6.3%ytd, and new capacity is being invested in, with total fixed asset investment up 3.7%ytd despite the drag from the property sector. Authorities 5.0% growth target for 2025 remains readily achievable. Though to ward off downside risks for 2026, gains need to be made in housing.
USD/JPY Bulls Push Higher — Can The Rally Continue?
Key Highlights
- USD/JPY started a fresh increase above the 144.50 resistance.
- A major bullish trend line is in place with support at 143.20 on the 4-hour chart.
- EUR/USD slowly moved below the 1.1520 pivot level.
- GBP/USD dipped below the 1.3500 support and struggled to recover.
USD/JPY Technical Analysis
The US Dollar formed a base and started a fresh increase above 143.00 against the Japanese Yen. USD/JPY surpassed the 144.00 and 144.20 resistance levels.
Looking at the 4-hour chart, the pair traded above the 76.4% Fib retracement level of the downward move from the 145.46 swing high to the 142.79 low. It even settled above the 145.00 level, the 100 simple moving average (red, 4-hour), and the 200 simple moving average (green, 4-hour).
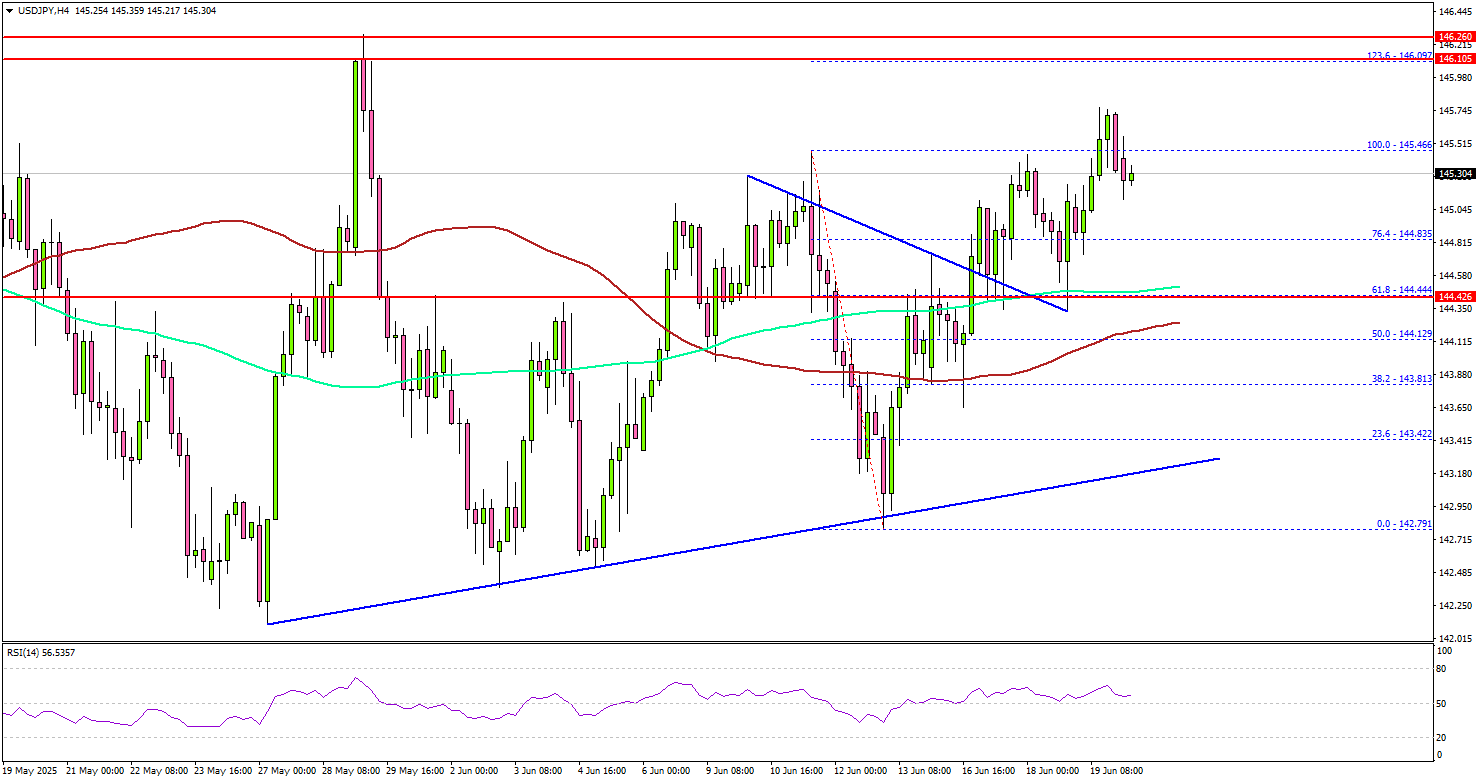
On the upside, the pair could face resistance near the 145.80 level. The next key resistance sits near the 146.00 level. It is close to the 1.236 Fib extension level of the downward move from the 145.46 swing high to the 142.79 low.
The first major resistance sits at 146.20. A close above the 146.20 level could set the pace for another increase. In the stated case, the pair could even clear the 147.00 resistance. The next major stop for the bulls could be near the 148.00 resistance.
On the downside, immediate support is near the 144.80 level. The next key support sits near 144.20. Any more losses could send the pair toward the 143.50 level. The main support could be near 143.20. There is also a major bullish trend line in place with support at 143.20 on the same chart.
Looking at EUR/USD, the pair dipped below the 1.1500 level and now remains at risk of more losses in the near term.
Upcoming Economic Events:
- Fed Monetary Policy Report.
- Philadelphia Fed Manufacturing Survey for June 2025 – Forecast -1, versus -4 previous.
FTSE 100 Wave Analysis
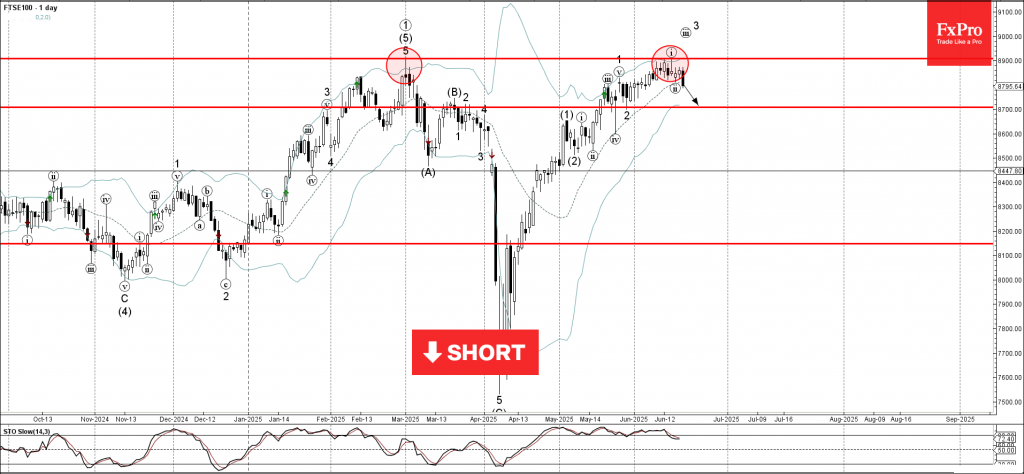
FTSE 100: ⬇️ Sell
- FTSE 100 reversed from the resistance zone
- Likely to fall to support level 8700.00
FTSE 100 index recently reversed down from the resistance zone located between the strong resistance level 8900.00 (which stopped the weekly uptrend at the end of February) and the upper daily Bollinger Band.
The downward reversal from this resistance zone stopped the previous impulse wave i of the intermediate impulse wave 3 from May.
Given the strength of the resistance level 8900.00, FTSE 100 index can be expected to fall to the next support level at 8700.00 (the former low of wave 2 from last month).
Nasdaq-100 Wave Analysis
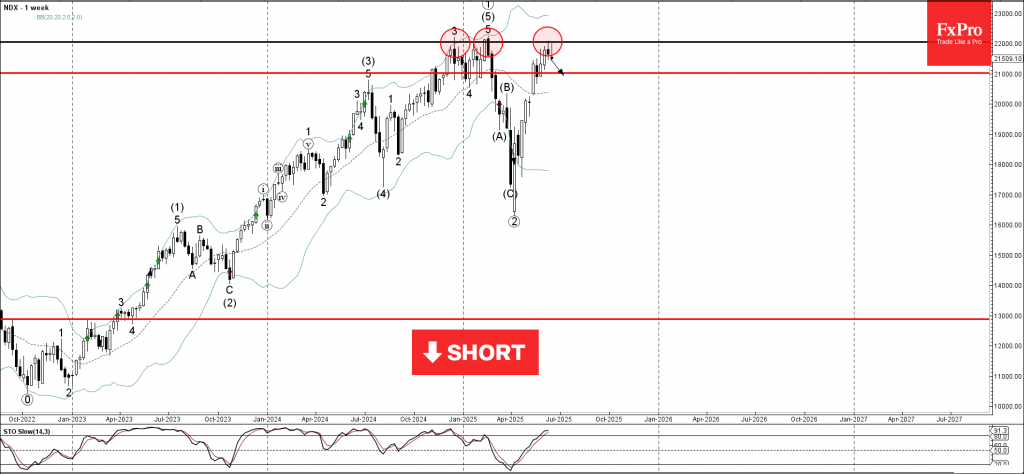
Nasdaq-100: ⬇️ Sell
- Nasdaq-100 reversed from long-term resistance level 22000.00
- Likely to fall to support level 21000.00
Nasdaq-100 index recently reversed down from the major long-term resistance level 22000.00 (which has been steadily reversing the price from the end of last year).
The downward reversal from the resistance level 22000.00 will form the weekly Shooting Star candlesticks reversal pattern if the price closes this week near the current levels.
Given the strength of the resistance level 22000.00 and the overbought weekly Stochastic, Nasdaq-100 index can be expected to fall to the next support level at 21000.00.
Sunset Market Commentary
Markets
Market positioning about the near term Bank of England’s policy rate path has been quite volatile over the past months. Going into the May decision, investors expected the UK central bank to ditch its gradual rate cut cycle to give the economy additional backing going through the turbulent tariff period. They were wrongfooted. The BoE indicated that without the US trade threat, it even would have been a close call between doing nothing and a 25 bps rate cut. The latter eventually was the preferred option in a three-way split (two out of nine in favor of status quo, two in favor of larger 50 bps rate cut), but with the “gradual cutting pace” still in play. A significant upward surprise in April UK inflation numbers added to the hawkish repositioning on UK money markets up to the point were they discounted only one additional rate cut this year. An awful labour market report and more moderate June (services) inflation later, traders again took a less hawkish view going into today’s decision. This time it paid off, though the Gilt market reaction shows that some still need convincing. UK Gilt yields drop by 2.5 bps (2-yr) to 4.4 bps (5-yr). EUR/GBP didn’t budge near 0.8550. The BoE kept its policy rate unchanged at 4.25% in a 6-3 vote. BoE MPC Taylor joined the ranks of long-standing doves Dhingra and Ramsden. Given the outlook, and continued disinflation, a gradual and careful approach to the further withdrawal of monetary policy restraint remains appropriate. By sticking with this guidance, the BoE drops a clear hint that they’ll extend the quarterly 25 bps cutting cycle in place since August of last year at the next policy meeting (Aug 7) when an updated Monetary Policy Report will be available. At today’s brief update, the BoE admits that underlying UK GDP growth appears to have remained weak and the labour market has continued to loosen. Risks to the inflation outlook (broadly at current 3.4% Y/Y pace throughout the remainder of the year before falling back towards 2% target next year) remain two-sided. Persistent wage growth and consumer services inflation, higher oil prices and tariff-related price uncertainty vs downside risks stemming from potentially weaker demand.
The absence of US investors (Juneteenth) holiday, Powell’s steady hand at yesterday’s press conference and the empty EMU eco calendar set the tone for dull trading on European FI and FX markets. EMU swap yields rise by up to 2 bps at the very long end of the curve with EUR/USD going nowhere at 1.1480. European stock markets are exception to the rule. They slide by up to 1% and Brent crude prices return to this month’s high near $78/b given the possible escalation in the Israeli-Iran conflict (US involvement?).
News & Views
The Swiss National Bank (SNB) reduced its policy rate by 25 bps; bringing it back to 0%, as inflation since the previous policy meeting in March decreased more than expected. Headline CPI price declined by 0.1% Y/Y in May, amongst others due to a slowdown in tourism prices and lower oil prices. The SNB further lowered its (conditional) inflation forecast for 2025-27 to 0.2%, 0.5% and 0.7%. Inflation remains in the lower half of the 0%-2% price stability range over the policy horizon. The central bank maintained a 1%-1.5% growth forecast for 2025 and 2026, but remains prepared to adjust policy if necessary and is willing to be active in the FX market. The bar to return to negative interest rates (deployed between 2015 and 2022) is high. The SNB is well aware of the undesirable side-effects and challenges. The market scaled back expectations on a September rate cut (< 50%). The franc strengthened modestly to EUR/CHF 0.9385.
The Norges Bank (NB) unexpectedly lowered the policy rate for a first time since hitting peak rates in December 2023 by 25 bps to 4.25%. The central bank assesses that inflation declined since the March policy meeting and expects a stronger disinflationary process for the coming year than previously as witnessed by the reduction in the projected path for CPI-ATE to 3.1% this year (-0.3%), to 2.7% (-0.2%) next year, 2.2% (-0.1%) in 2027 and 2.1% in 2028. This allows to start a cautious normalization process with tight monetary policy still contributing to cool the economy. The NB estimates the policy rate near 4% by the end of this year and at 3% end 2028. Interestingly, mainland growth was upwardly revised for this (1.6%, +0.4%) and next year (1.4%, +0.2%). The unemployment has increased somewhat from a low level and output is now close to potential. The Norwegian krone loses modest ground (EUR/NOK 11.54 from 11.48).
EUR/USD Mid-Day Outlook
Daily Pivots: (S1) 1.1453; (P) 1.1491; (R1) 1.1522; More...
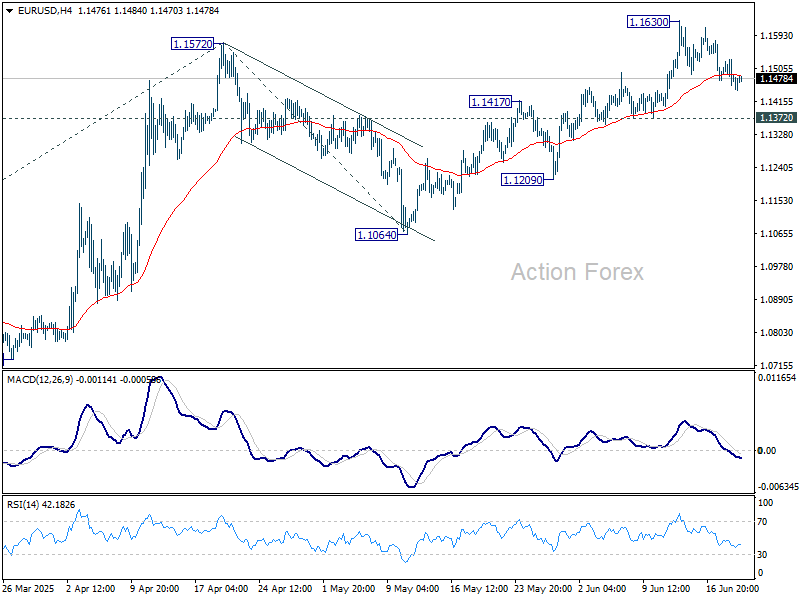
Intraday bias in EUR/USD remains neutral as consolidation continues below 1.1630. With 1.1372 support intact, further rally is expected. Break of 1.1572 will extend the rise from 1.0176. Next target is 61.8% projection of 1.0176 to 1.1572 from 1.1064 at 1.1927. However, break of 1.1372 support will indicate short term topping, and turn bias to the downside for deeper pullback.
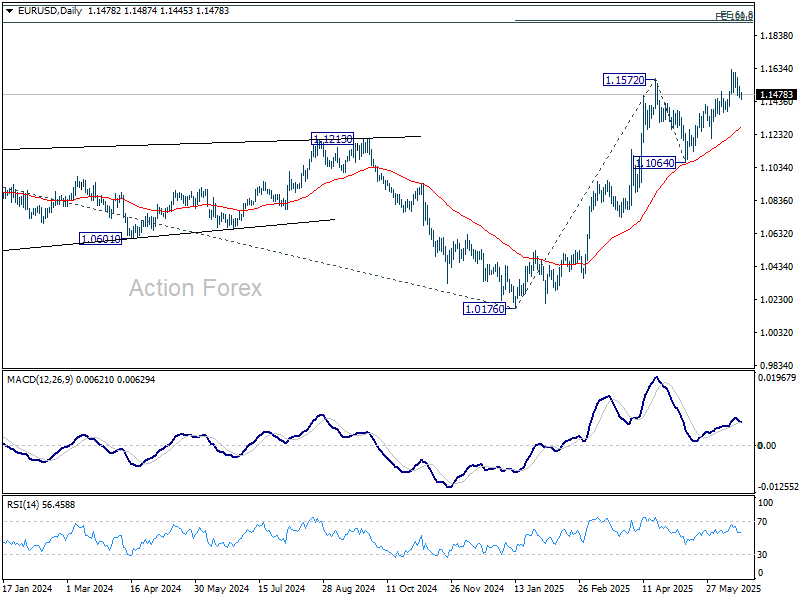
In the bigger picture, rise from 0.9534 long term bottom could be correcting the multi-decade downtrend or the start of a long term up trend. In either case, further rise should be seen to 100% projection of 0.9534 to 1.1274 from 1.0176 at 1.1916. This will now remain the favored case as long as 1.1604 support holds.
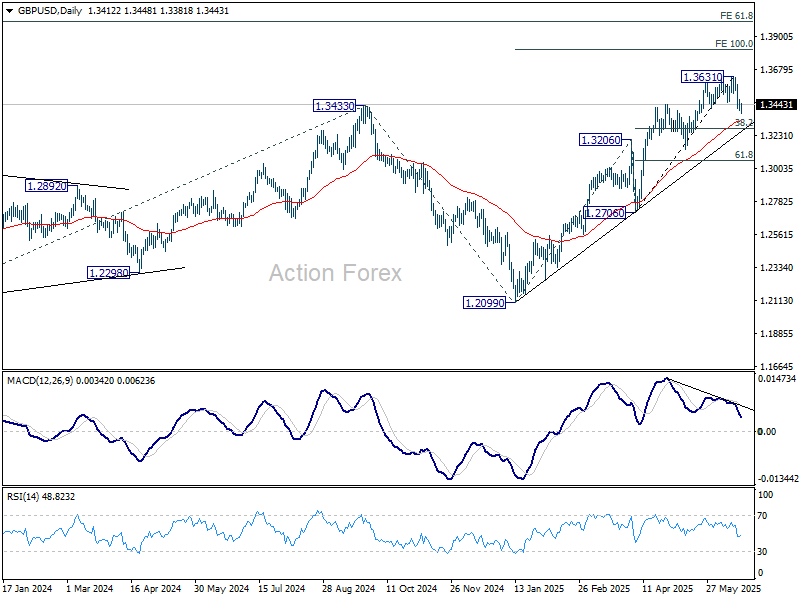
GBP/USD Mid-Day Outlook
Daily Pivots: (S1) 1.3388; (P) 1.3433; (R1) 1.3465; More...
No change in GBP/USD's outlook. Intraday bias stays on the downside, and fall from 1.3631 short term top is in progress for 55 D EMA (now at 1.3330). Strong support could be seen there to bring rebound. On the upside, above 1.3475 minor resistance will turn intraday bias neutral first. However, sustained break of 55 D EMA will bring deeper correction to 38.2% retracement of 1.2706 to 1.3631 at 1.3278.
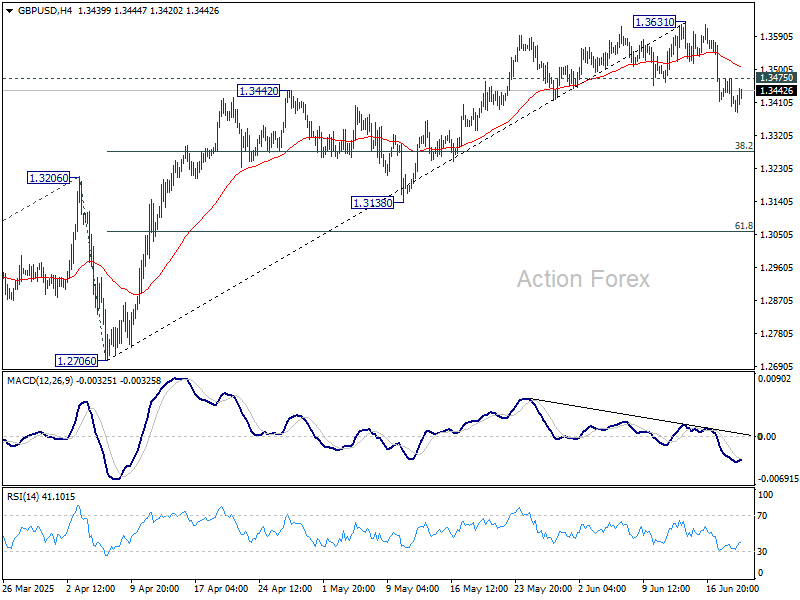
In the bigger picture, up trend from 1.3051 (2022 low) is in progress. Next medium term target is 61.8% projection of 1.0351 to 1.3433 from 1.2099 at 1.4004. Outlook will now stay bullish as long as 55 W EMA (now at 1.2937) holds, even in case of deep pullback.