Sample Category Title
GBP/USD Falters at Resistance, All Eyes on Upcoming BoE Policy Decision
Key Highlights
- GBP/USD failed to extend gains above 1.3620 and corrected lower.
- It traded below a bullish trend line with support at 1.3515 on the 4-hour chart.
- EUR/USD is still consolidating gains above the 1.1450 zone.
- WTI Crude Oil prices started a fresh increase above the $73.50 resistance.
GBP/USD Technical Analysis
The British Pound made a few attempts to surpass 1.3620 against the US Dollar but failed. GBP/USD started a downside correction below the 1.3550 level.
Looking at the 4-hour chart, the pair traded below a bullish trend line with support at 1.3515. The pair settled below the 1.3500 level and the 100 simple moving average (red, 4-hour). It tested the 1.3420 support and the 200 simple moving average (green, 4-hour).
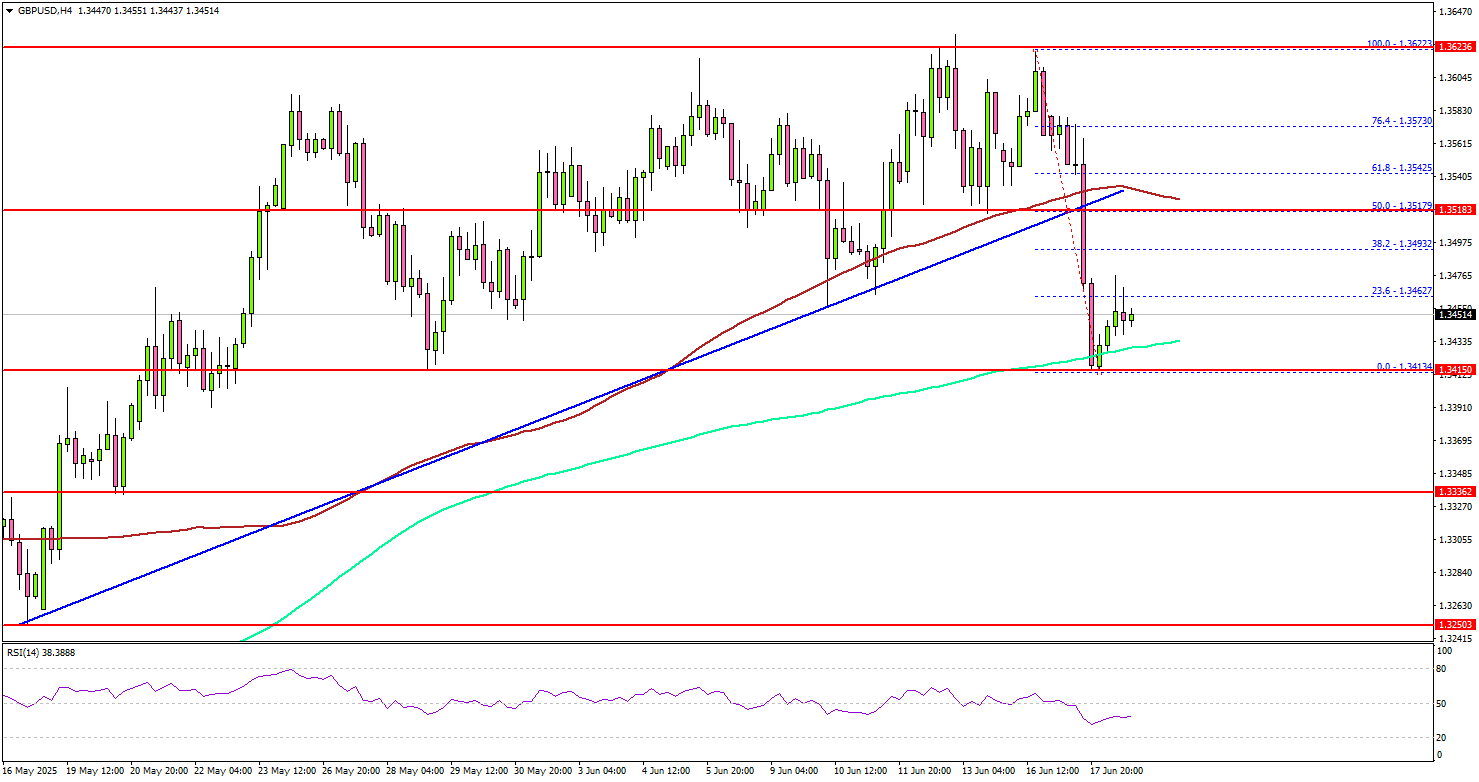
It started a consolidation phase above the 1.3400 zone. On the upside, the pair could face resistance near the 1.3515 level and the 100 simple moving average (red, 4-hour).
The next key resistance sits near the 1.3540 level. The first major resistance sits at 1.3620. A close above the 1.3620 level could set the pace for another increase. In the stated case, the pair could even clear the 1.3700 resistance. The next major stop for the bulls could be near the 1.3800 resistance.
On the downside, immediate support is near the 1.3400 level. The next key support sits near 1.3340. Any more losses could send the pair toward the 1.3220 level. The main support could be near 1.3150.
Looking at WTI Crude Oil, the price found support near $70.00 and started a fresh increase above the $73.50 resistance.
Upcoming Economic Events:
- BoE Interest Rate Decision - Forecast 4.25%, versus 4.25% previous.
USDCAD Wave Analysis
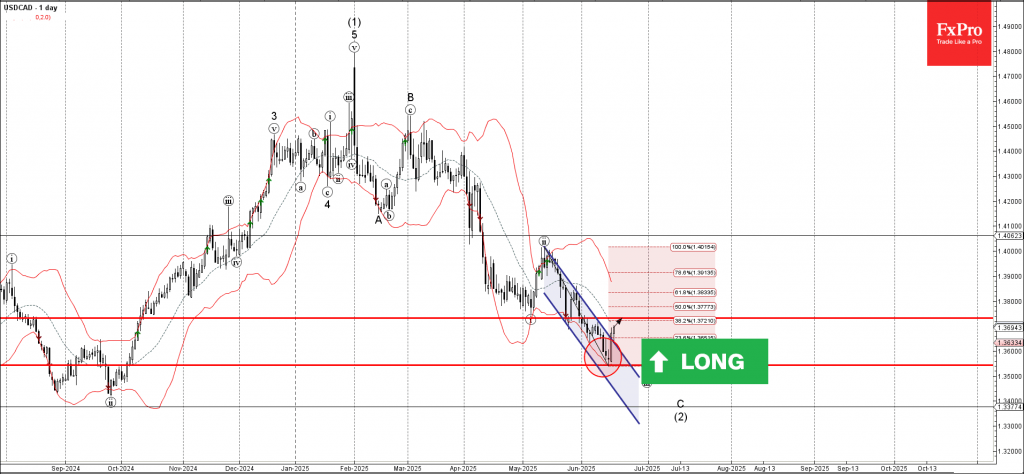
USDCAD: ⬆️ Buy
- USDCAD broke daily down channel
- Likely to rise to the resistance level at 1.3730
USDCAD currency pair recently broke the resistance trendline of the daily down channel from the start of May.
The breakout of this down channel follows the earlier upward reversal from the pivotal support level 1.3545 coinciding with the lower daily Bollinger Band.
USDCAD currency pair can be expected to rise to the next resistance level at 1.3730 (former strong support from May).
Gold Wave Analysis
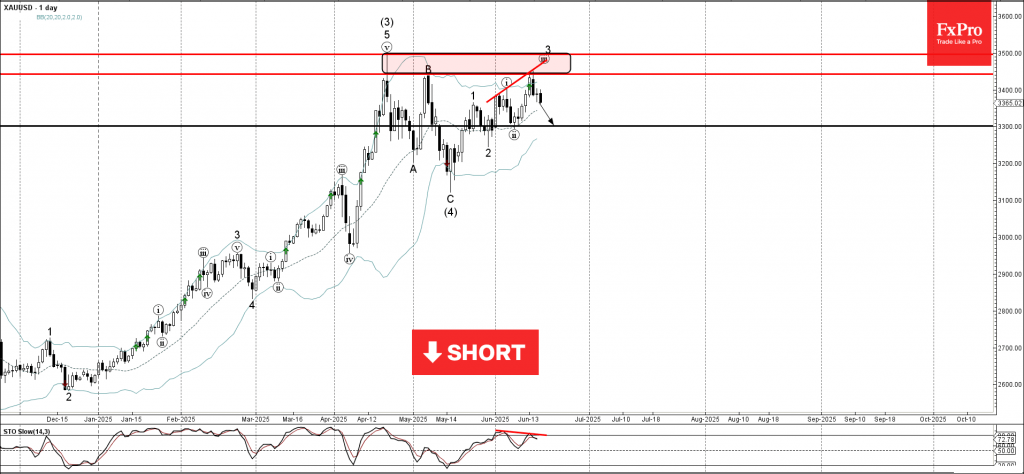
Gold: ⬇️ Sell
- Gold reversed from resistance level 3445.00
- Likely to fall to support level 3300.00
Gold recently reversed with the Bearish Engulfing from the resistance level 3445.00, which is the lower border of the resistance area which has been reversing the price from April.
The resistance level 3445.00 was further strengthened by the upper daily Bollinger Band.
Given the strength of the resistance level at 3445.00 and the bearish divergence on the daily Stochastic indicator, Gold can be expected to fall to the next support level at 3300.00 (the low of the previous minor correction ii).
Fed Review: Waiting for Clarity
- The Fed maintained its monetary policy unchanged as widely expected.
- The updated median 'dots' still signal two more 25bp rate cuts by the end of the year. Median rate projection for 2026-27 shifted 25bp higher, but the distribution of views within FOMC remained little changed.
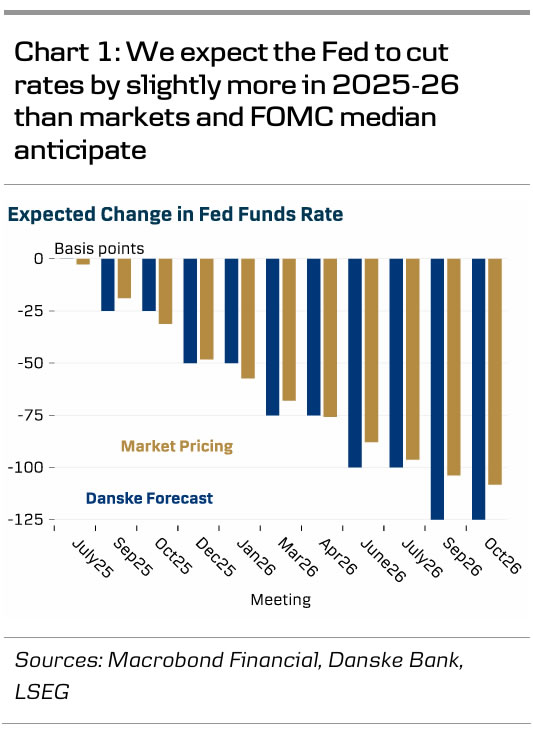
- Market reaction was generally muted. We still expect the Fed to cut in September and December, followed by three more reductions in 2026. We forecast EUR/USD at 1.20 and 10y UST yield at 4.50% in 12M horizon.
FOMC's June meeting was mostly about stocktaking as tariff uncertainty leaves little room for forward-looking policy views. Powell repeated the familiar message of the Fed remaining 'in a good place' with its current policy stance.
The policy statement was little changed, as the Fed only omitted the May addition of "[committee] judges that the risks of higher unemployment and higher inflation have risen". Powell clarified that the Fed sees peak-trade war uncertainty easing, but that uncertainty in general remains elevated.
In our preview, we speculated if the Fed would take a firmer stance on whether the trade war appeared more concerning from inflation or labour market standpoint. That was not the case, however, as the Fed does not yet appear confident enough to draw strong conclusions from data received since the 'Liberation Day'.
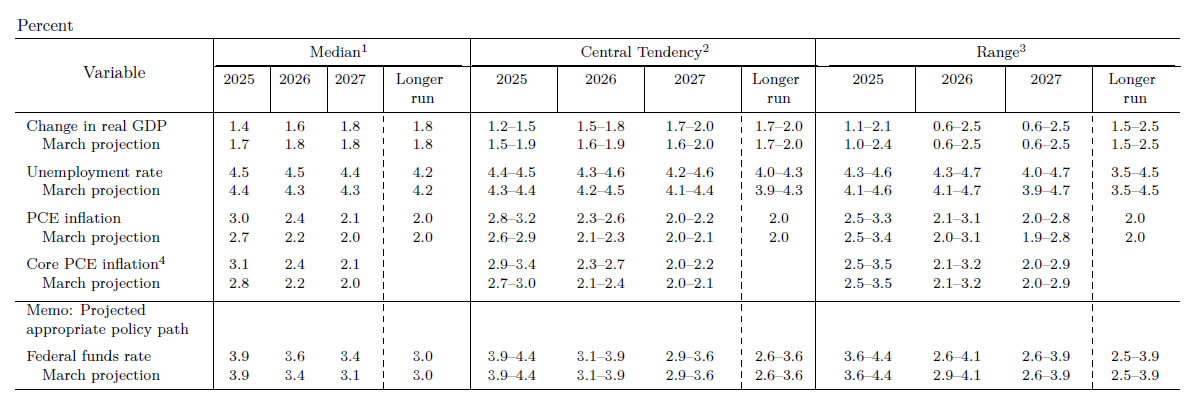
Median 2025 GDP forecast was revised down to 1.4% (from 1.7%) and 2026 to 1.6% (from 1.8%) - largely in line with expectations. Both inflation and unemployment rate forecasts were revised up modestly. Powell affirmed that incoming data on both labour markets and inflation has been promising, but that the Fed continues to monitor how the tariff costs will be absorbed by consumers and businesses before cutting rates further.
The median 'dots' still signal two rate cuts over the rest of the year. The median rate projection was revised up by 25bp for 2026-27, now signalling only one cut each year. However, the central tendency range (which illustrates the distribution of views omitting the three highest and lowest observations) remained completely unchanged throughout the forecast horizon. Participants judged that risks surrounding the GDP estimate remain skewed to the downside, and to the upside for inflation - as was the case in March.
Powell downplayed the risk of persistent inflation pressures stemming from the Israel-Iran conflict, which is well in line with the Fed's general tendency to look through short-term volatility in financial conditions.
We maintain our Fed call unchanged and still see 25bp rate cuts in September and December this year, followed by three more reductions in 2026. As we gain more clarity around both the level of tariffs and their pass-through to prices, and as economic growth continues to cool both cyclically and structurally, we think the Fed still has plenty of room for cuts ahead. Market reaction was limited, and markets price in around 18bp worth of cumulative cuts by September and 48bp by December.
Elevated Uncertainty Keeps FOMC on Hold Again
Summary
- The FOMC voted unanimously today to keep its target range for the federal funds rate unchanged at 4.25%-4.50%.
- In its post-meeting statement, the FOMC noted an easing in market volatility since its last meeting in May, stating "uncertainty about the economic outlook has diminished." That said, the Committee continued to characterize the level of uncertainty as "elevated."
- The Summary of Economic Projections showed the FOMC sees a bit more stagflation than its last published forecasts in March. The median GDP forecast was downgraded in 2025 and 2026 while the median forecast for core PCE inflation and the unemployment rate edged up for both years.
- The "dot plot" showed that the median FOMC member continued to look for 50 bps of easing by the end of 2025, while the median dot for year-end 2026 shifted up from 100 bps of easing in March to 75 bps in June.
- The dispersion of the dots shows the Committee remains divided regarding the outlook for monetary policy. We currently look for the FOMC to commence an easing cycle in September and expect 75 bps of rate cuts by year-end. That said, the uncertain outlook regarding U.S. trade policy imparts an unusually high degree of uncertainty to the outlook for monetary policy.
Uncertainty Has Diminished But It Remains Elevated
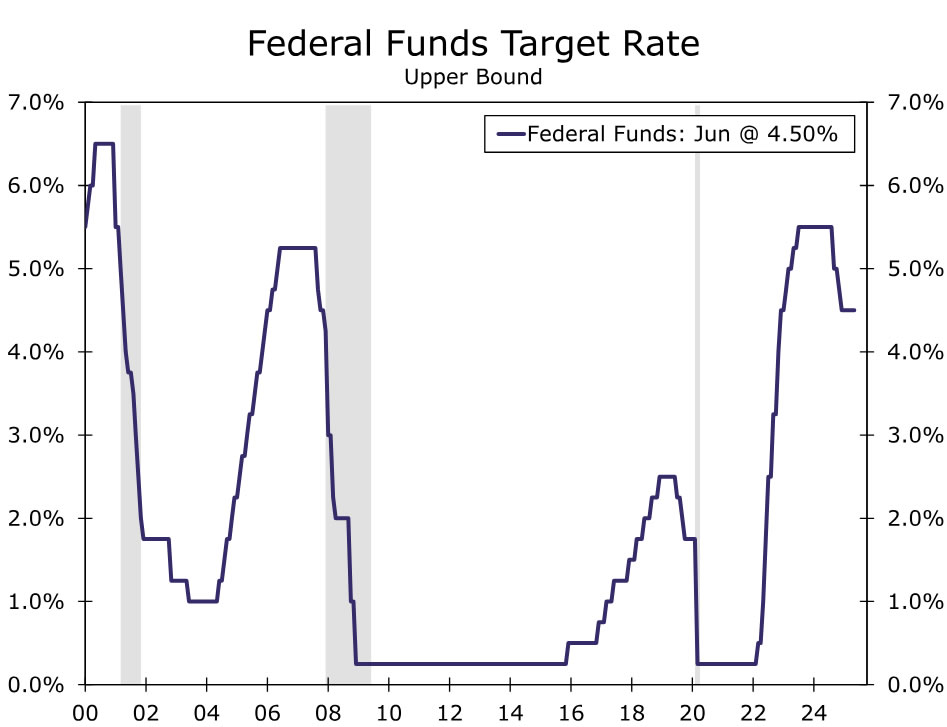
The Federal Open Market Committee (FOMC) decided to maintain its target range for the federal funds rate at 4.25%-4.50% at the conclusion of its policy meeting today. The decision was unanimously supported by all 12 voting members of the Committee and was universally expected by market participants. After easing policy by 100 bps between last September and December, the FOMC has now kept rates on hold for four consecutive policy meetings (Figure 1).
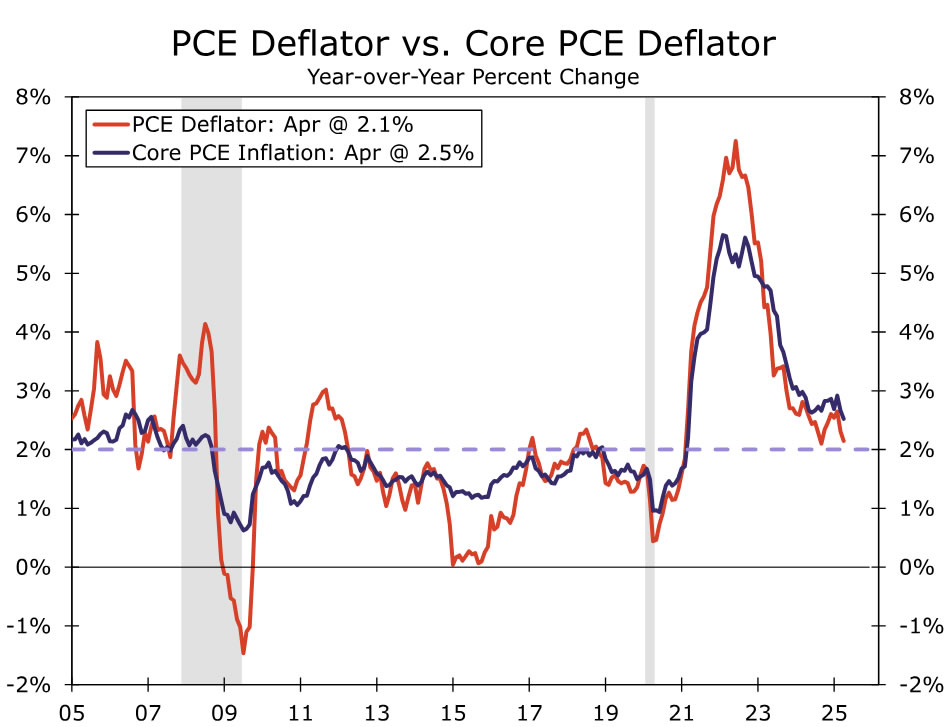
In outlining its reasons for maintaining the federal funds rate in its current target range, the FOMC said in its post-meeting statement that "economic activity has continued to expand at a solid pace." The statement also noted that "the unemployment rate remains low" and that "labor market conditions remain solid." The statement continued to characterize inflation as "somewhat elevated." Indeed, the year-over-year rate of core PCE inflation, which most Fed officials believe is the best measure of the underlying rate of consumer price inflation, continues to run a bit above the FOMC's target of 2% (Figure 2). The Committee is more or less implying that it does not need to ease policy at this time because the economy generally remains resilient and inflation continues to exceed the Committee's target.
In the statement that was released after the last meeting on May 7, the FOMC noted that "uncertainty about the economic outlook has increased further" (emphasis ours). That meeting occurred soon after President Trump announced his "Liberation Day" tariffs, which led to volatility in financial markets. The president has subsequently reduced the "reciprocal" tariffs while negotiating trade agreements with some foreign countries. Consequently, volatility in financial markets has subsided somewhat. Reflecting this easing of tensions, the statement today noted that "uncertainty about the economic outlook has diminished." That said, the Committee continued to characterize the level of uncertainty as "elevated." The statement continued to stress that the FOMC "is strongly committed to supporting maximum employment and returning inflation to its 2 percent objective."
Dot Plot Shows that the FOMC Is Divided Regarding Outlook for Policy
The FOMC publishes its Summary of Economic Projections (SEP), which summarizes the macroeconomic forecasts of the 19 individual FOMC members, four times a year. The summary forecasts that were published today imply that the FOMC sees a bit more stagflation than it did in March. Specifically, the median GDP growth forecast was reduced by about 1/4 percentage point in both 2025 and 2026 while the median forecast for core PCE inflation was raised by about 1/4 percentage point in both years. The median forecast for the unemployment rate at the end of this year edged up from 4.4% in the March SEP to 4.5% in the June SEP. The rate for the end of 2026 rose by 0.2 percentage points relative to the March SEP, to 4.5%. The increase in the jobless rate in both years reflects the slower growth forecasts in June relative to March.
The "dot plot" that was released in March showed that the median FOMC member thought that 50 bps of rate cuts by the end of 2025 and a cumulative amount of 100 bps of policy easing by year-end 2026 would be appropriate. The dot plot that was published after the conclusion of today's meeting showed the median dot for year-end 2025 remaining unchanged, which continues to imply 50 bps of easing from the current target range of 4.25%-4.50% (Figure 3). That said, the Committee remains divided regarding the outlook for monetary policy this year. There are currently 10 members who believe that either 50 bps or 75 bps of rate cuts would be appropriate by the end of 2025. Two FOMC participants think that only 25 bps of policy easing this year would be appropriate. Seven members currently believe the Committee should remain on hold all year. There were only four participants in March who thought that the FOMC should refrain from cutting rates this year.
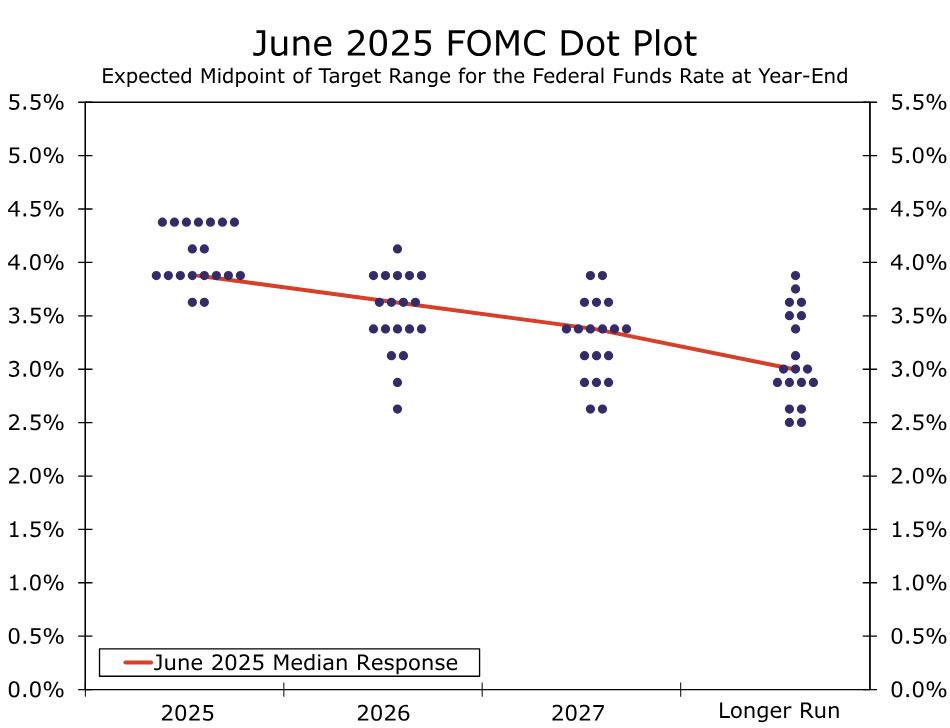
The median dot for year-end 2026 shifted up from 100 bps of cumulative easing in March to 75 bps in June. Again, however, the dispersed nature of dots for next year implies a meaningful number of different views among individual FOMC members regarding the outlook for monetary policy (Figure 3). Indeed, Chair Powell noted in his post-meeting press conference that "no one holds these rate paths with a great deal of conviction."
Outlook for Monetary Policy Remains Highly Uncertain
The dot plot and Powell's comment imply to us that the outlook for policy remains highly uncertain due, at least in part, to the uncertain outlook for U.S. trade policy. Higher tariffs will likely weigh on real GDP growth, which could be offset by policy easing, while also raising inflation, which would likely induce the FOMC to remain on hold if not tighten policy. As we discussed in our most recent U.S. Economic Outlook, we think the FOMC will look through any one-off price increases caused by tariffs and instead concentrate on the growth-eroding and unemployment-increasing effects of higher import duties. We currently look for the FOMC to commence an easing cycle in September, and look for 75 bps of rate cuts by the end of the year. That said, we readily acknowledge that the FOMC may refrain from cutting rates if inflation expectations rise and/or wages accelerate. Chair Powell also said in his press conference that policymakers "think they will learn a great deal on tariffs over the summer." We also will be focused intently on economic developments in coming months.
Fed holds steady but upgrades inflation path, slower easing ahead
As expected, Fed left interest rates unchanged at 4.25%–4.50% today, with all FOMC members voting in favor of the decision. The real focus was on the revised projections, which revealed a cautious shift: while two rate cuts remain penciled in for 2025, the pace of easing slows meaningfully beyond that.
The median forecast now puts the federal funds rate at 3.6% by the end of 2026, up from 3.4% previously, and 3.4% by the end of 2027, up from 3.1%. This implies only one cut per year after 2025. The change suggests that the Fed is growing more concerned about stickier inflation, particularly as tariff-related price effects take longer to dissipate.
Inflation forecasts were lifted meaningfully. Headline PCE inflation is now expected to run at 3.0% in 2025, up from 2.7% previously, before easing to 2.4% in 2026 and 2.1% in 2027. Core PCE projections followed a similar pattern, raised to 3.1% in 2025 from 2.8% in March. These changes reflect Fed’s acknowledgment of tariff-related price pressures filtering through the economy more persistently than previously assumed.
Meanwhile, growth forecasts were trimmed, with real GDP now seen expanding just 1.4% in 2025, down from 1.7%. The 2026 estimate was also reduced from 1.8% to 1.6%. However, the unemployment rate is expected to remain relatively stable, only nudging up to 4.5% in 2025 and holding near that level through 2027.
The slight upward drift in the unemployment forecast likely reflects this softer growth outlook, though the impact is not severe enough to force Fed’s hand.
Overall, the message is clear: while cuts are still on the table, the Fed is prepared to ease more slowly and less deeply than markets had hoped. With tariffs adding upward pressure on prices but not severely denting the labor market, policymakers are likely to remain in wait-and-see mode, calibrating their response carefully.
(FED) Federal Reserve Issues FOMC Statement
Although swings in net exports have affected the data, recent indicators suggest that economic activity has continued to expand at a solid pace. The unemployment rate remains low, and labor market conditions remain solid. Inflation remains somewhat elevated.
The Committee seeks to achieve maximum employment and inflation at the rate of 2 percent over the longer run. Uncertainty about the economic outlook has diminished but remains elevated. The Committee is attentive to the risks to both sides of its dual mandate.
In support of its goals, the Committee decided to maintain the target range for the federal funds rate at 4-1/4 to 4-1/2 percent. In considering the extent and timing of additional adjustments to the target range for the federal funds rate, the Committee will carefully assess incoming data, the evolving outlook, and the balance of risks. The Committee will continue reducing its holdings of Treasury securities and agency debt and agency mortgage‑backed securities. The Committee is strongly committed to supporting maximum employment and returning inflation to its 2 percent objective.
In assessing the appropriate stance of monetary policy, the Committee will continue to monitor the implications of incoming information for the economic outlook. The Committee would be prepared to adjust the stance of monetary policy as appropriate if risks emerge that could impede the attainment of the Committee's goals. The Committee's assessments will take into account a wide range of information, including readings on labor market conditions, inflation pressures and inflation expectations, and financial and international developments.
Voting for the monetary policy action were Jerome H. Powell, Chair; John C. Williams, Vice Chair; Michael S. Barr; Michelle W. Bowman; Susan M. Collins; Lisa D. Cook; Austan D. Goolsbee; Philip N. Jefferson; Adriana D. Kugler; Alberto G. Musalem; Jeffrey R. Schmid; and Christopher J. Waller.
BoC’s Macklem: Ready to cut again if tariff drag grows and inflation stays contained
BoC Governor Tiff Macklem reinforced the Bank’s dovish lean today, stating that further rate cuts could be warranted if the economic fallout from US tariffs deepens and inflation pressures remain contained.
“Overall, my colleagues on Governing Council and I agreed there could be a need for a further reduction in the policy interest rate if the effects of U.S. tariffs and uncertainty continued to spread through the economy and cost pressures on inflation were contained,” Macklem said in a speech today, outlining the Bank’s conditional easing bias.
BoC has already cut rates seven times in this easing cycle. The June 4 decision to hold rates steady at 2.75% was shaped by three key concerns: lingering uncertainty, a mildly weaker domestic outlook, and some renewed firmness in core inflation. The mixed signals left policymakers in wait-and-see mode.
Dollar Remains Constructive Ahead of Fed Verdict
The dollar index held steady and moved within a narrow range following advance in past three days, as traders await announcement from Fed.
The dollar benefited from safe-haven demand on the most recent escalation of conflict in the Middle East, while markets look for more information about Fed’s steps in the near future, as the central bank is widely expected to keep the interest rates on hold at the policy meeting that ends today.
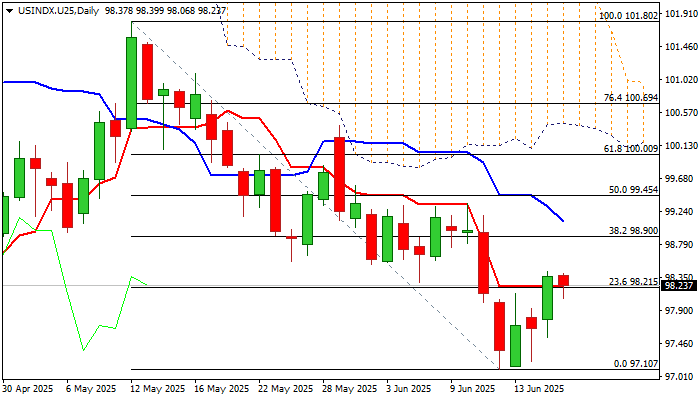
Tuesday’s close above important resistance at 98.21 (daily Tenkan-sen / Fibo 23.6% of 101.80/97.10) was initial bullish signal, which requires repeated closing above this level to be verified.
This would brighten near-term prospects for further recovery and unmask targets at 98.90 (Fibo 38.2%) and 99.10 (daily Kijun-sen). Scenario also includes positive dollar’s reaction to Fed’s decision.
Conversely, failure to sustain break above 98.21 would generate initial signals that bulls are running out of steam and that near-term recovery has likely peaked.
Res: 98.50; 98.90; 99.10; 99.45
Sup: 98.06; 97.65; 97.53; 97.10