
Sample Category Title
Eurozone CPI finalized at 1.9% in May, disinflation takes hold as services inflation softens
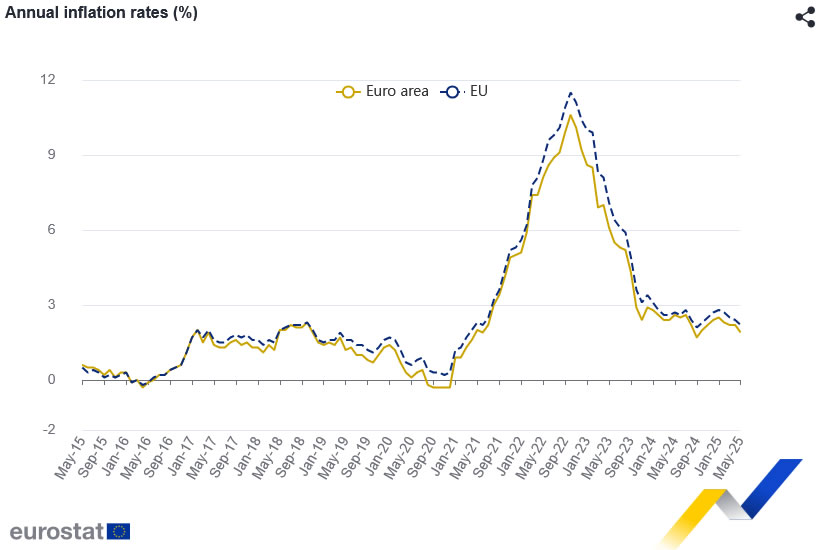
Final Eurozone inflation figures for May confirmed further softening in price pressures, with headline CPI easing to 1.9% yoy from April’s 2.2% yoy. Core CPI (ex energy, food, alcohol & tobacco) also moderated to 2.3% yoy from 2.7% yoy. Services inflation, a key component closely tracked by ECB, slowed markedly from 4.0% yoy to 3.2% yoy, contributing to the broader disinflation trend across the bloc.
According to Eurostat, the largest contribution to the overall annual inflation rate came from services (+1.47 percentage points), followed by food, alcohol, and tobacco (+0.62 pp). Non-energy industrial goods added a modest +0.16 pp, while energy dragged the headline rate down by -0.34 pp. The moderation in services inflation is especially important given its linkage to wage growth.
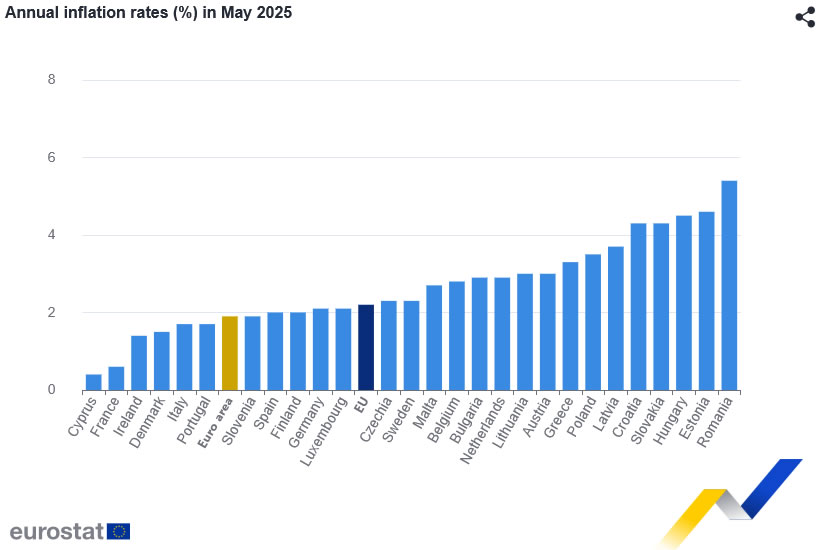
Looking across the EU, headline inflation was steady at 2.2%, but divergence across member states is stark. Cyprus, France, and Ireland posted the lowest annual rates at 0.4%, 0.6%, and 1.4% respectively, while Romania, Estonia, and Hungary topped the inflation chart with rates above 4.5%. Annual inflation declined in 14 member states compared to April.
Natural Gas Prices on the Rise
As shown on the XNG/USD chart today, natural gas prices are trading around $3.960 per MMBtu — the highest level in over a month. This week’s series of bullish candles confirms strong demand.
Natural gas is becoming more expensive due to concerns over the military conflict between Iran and Israel. According to media reports:
→ Israel has attacked Iran’s South Pars gas field, and Donald Trump has called for the evacuation of Tehran.
→ Market participants fear that a blockade of the Strait of Hormuz could disrupt oil and natural gas supply chains.
In addition, forecasts of extreme heat in the US and increased demand for gas-powered air conditioning are also pushing prices higher.
Technical Analysis of the XNG/USD Chart
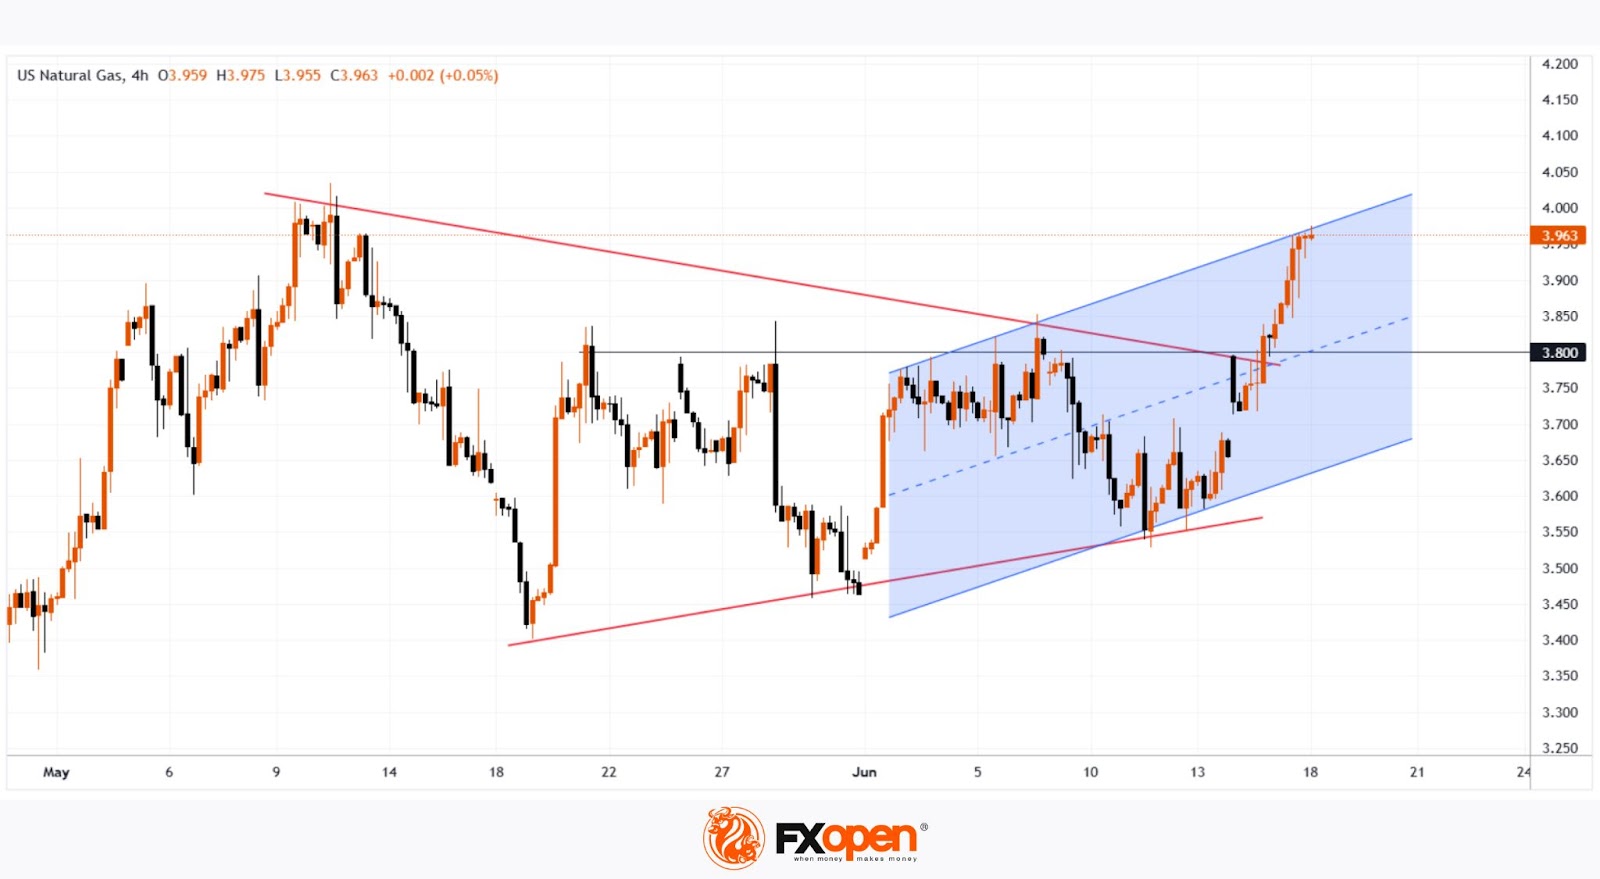
The chart shows that since mid-May, natural gas price movements have formed a narrowing triangle, suggesting a temporary balance between supply and demand.
However, the triangle has been broken to the upside — a sign of demand strength — with the price:
→ breaking through resistance at $3.800 per MMBtu;
→ forming the outlines of an ascending channel (shown in blue).
The following factors could act as resistance to the current upward move in natural gas prices:
→ the upper boundary of the channel;
→ the psychological level of $4.000 per MMBtu, near the May peak.
However, given that the hottest months of summer lie ahead and the situation in the Middle East remains highly volatile, it is reasonable to assume that the upward trend may continue.
Start trading commodity CFDs with tight spreads. Open your trading account now or learn more about trading commodity CFDs with FXOpen.
This article represents the opinion of the Companies operating under the FXOpen brand only. It is not to be construed as an offer, solicitation, or recommendation with respect to products and services provided by the Companies operating under the FXOpen brand, nor is it to be considered financial advice.
GBP/JPY Daily Outlook
Daily Pivots: (S1) 194.40; (P) 195.63; (R1) 196.34; More...
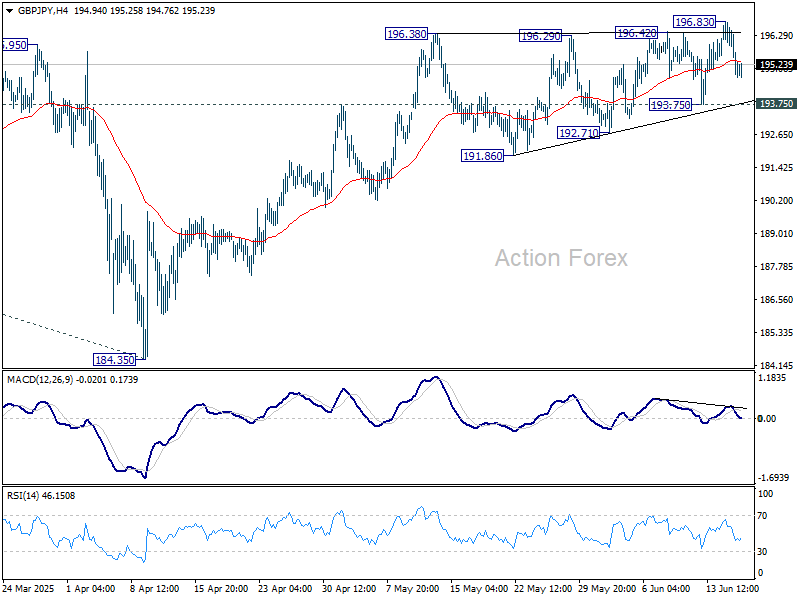
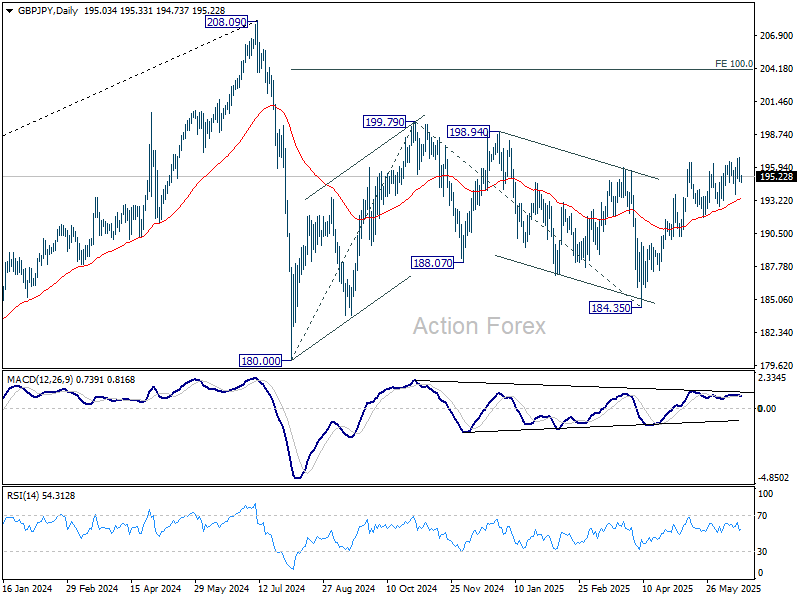
GBP/JPY's pullback from 196.83 extended lower and intraday bias is turned neutral. Further rise will remain in favor as long as 193.75 support holds. Firm break of 196.83 will target 199.79 resistance first. However, sustained break of 139.75 will indicate near term reversal and turn bias to the downside for 191.86 support and possibly below.
In the bigger picture, price actions from 208.09 are seen as a correction to rally from 123.94 (2020 low). Strong support should be seen from 38.2% retracement of 123.94 to 208.09 at 175.94 to contain downside. However, sustained break of 175.94 will bring deeper fall even still as a correction.
EUR/JPY Daily Outlook
Daily Pivots: (S1) 166.45; (P) 167.04; (R1) 167.36; More...
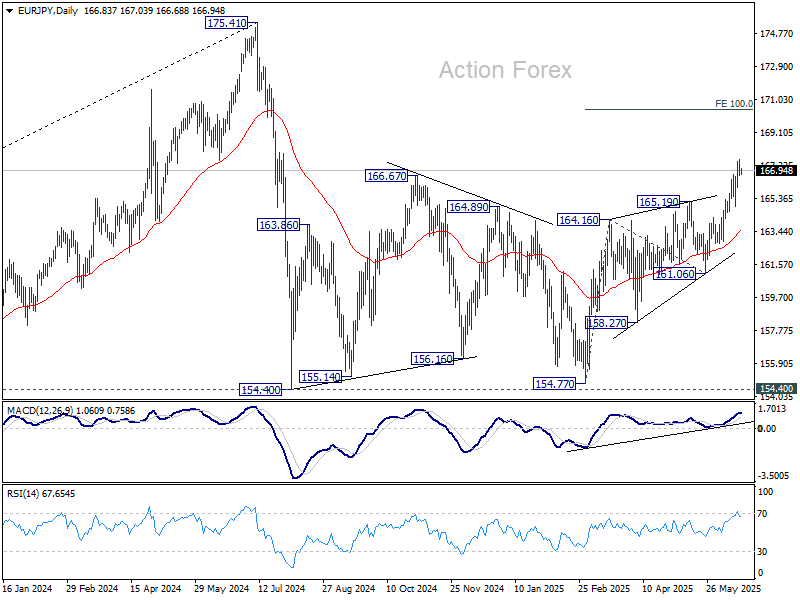
Intraday bias in EUR/JPY stays mildly on the upside despite loss of momentum as seen in 4H MACD. Current rise from 154.77 is in progress. Next target is 100% projection of 154.77 to 165.19 from 161.06 at 170.45. For now, further rally is expected as long as 164.91 support holds, in case of retreat.
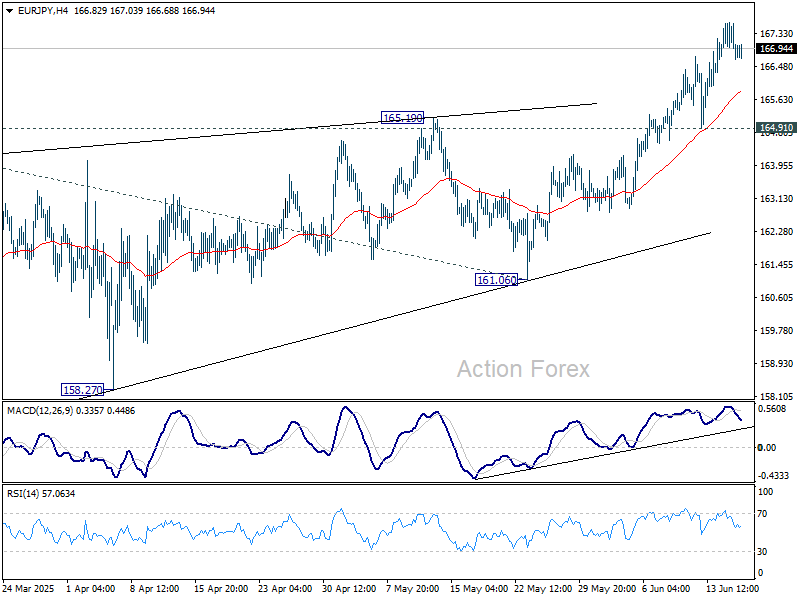
In the bigger picture, price actions from 175.41 are seen as correction to up trend from 114.42 (2020 low). Strong support should be seen from 38.2% retracement of 114.42 to 175.41 at 152.11 to contain downside. However, sustained break of 152.11 will bring deeper fall even still as a correction.
EUR/GBP Daily Outlook
Daily Pivots: (S1) 0.8520; (P) 0.8538; (R1) 0.8566; More...
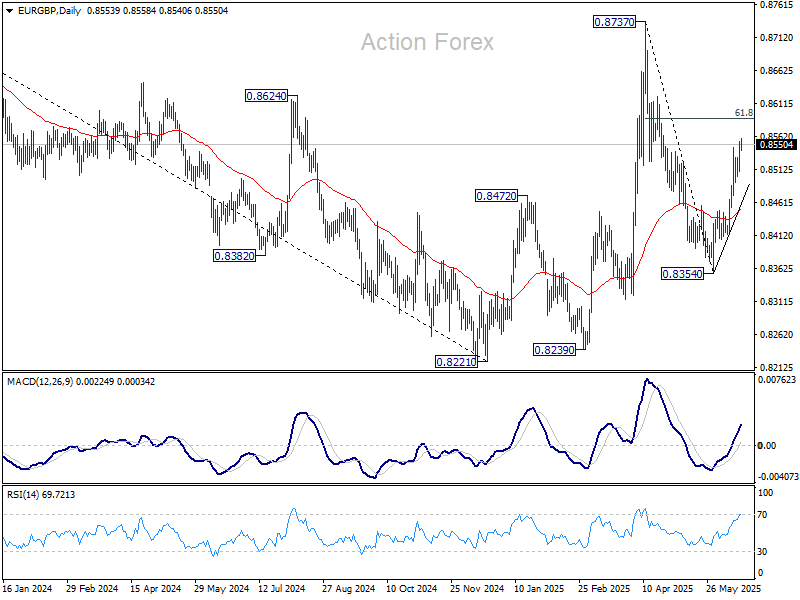
EUR/GBP's rise from 0.8354 resumed after brief consolidations. Intraday bias is back on the upside for 61.8% retracement of 0.8737 to 0.8354 at 0.8591. Firm break there will pave the way to 0.8373 resistance. For now, further rally will remain in favor as long as 0.8492 support holds, in case of retreat.
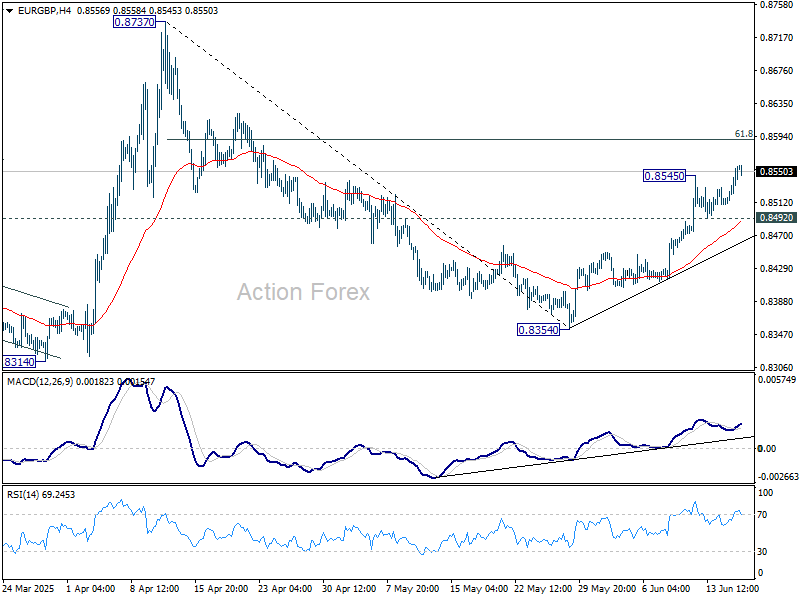
In the bigger picture, price actions from 0.8221 medium term bottom are merely forming a corrective pattern to the down trend from 0.9267 (2022 high). Nevertheless, there is no clear momentum to break through 0.8201 key support (2022 low) yet. Hence, range trading is expected between 0.8221/8737 for now.
EUR/AUD Daily Outlook
Daily Pivots: (S1) 1.7674; (P) 1.7716; (R1) 1.7767; More...
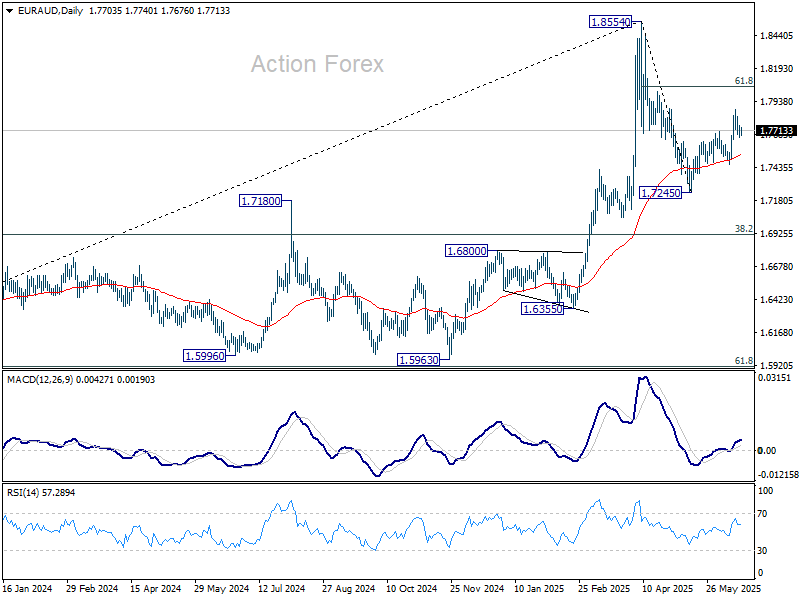
No change in EUR/AUD's outlook. Intraday bias stays neutral for consolidations below 1.7880 and further rally is expected with 1.7459 support intact. Above 1.7880 will target 61.8% retracement of 1.8554 to 1.7245 at 1.8054. Firm break there will pave the way to 1.8554. However, break of 1.7459 will dampen this bullish view and bring deeper decline back to 1.7245 low.
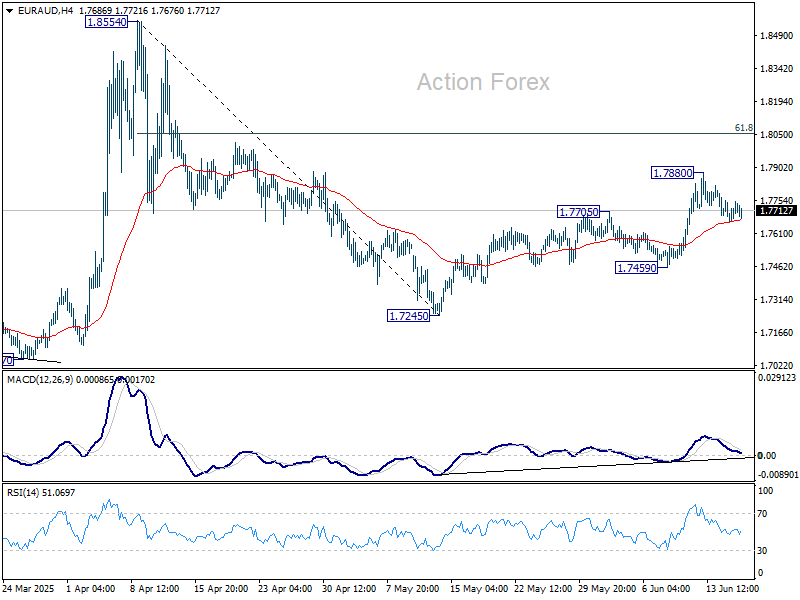
In the bigger picture, with 55 W MACD staying well below signal line, 1.8554 is likely a medium term top already. Price actions from there are seen as a corrective pattern only. While deeper pullback might be seen, downside should be contained by 38.2% retracement of 1.4281 (2022 low) to 1.8554 at 1.6922 to bring rebound. Up trend from 1.4281 is still expected to resume at a later stage.
EUR/CHF Daily Outlook
Daily Pivots: (S1) 0.9350; (P) 0.9384; (R1) 0.9409; More....
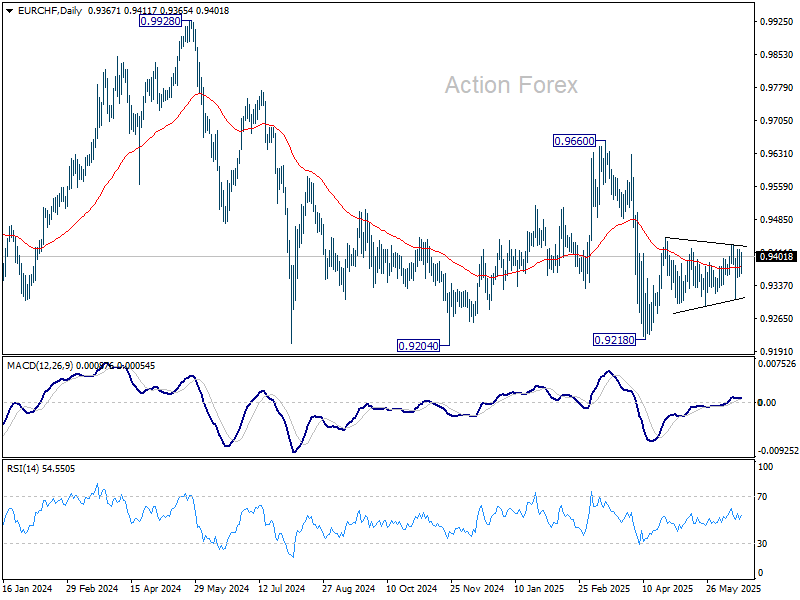
EUR/CHF is still bounded in range trading and intraday bias remains neutral. On the upside, break of 0.9428 will resume the rebound from 0.9218 through 0.9445 resistance. However, break of 0.9291 will bring retest of 0.9218 instead.
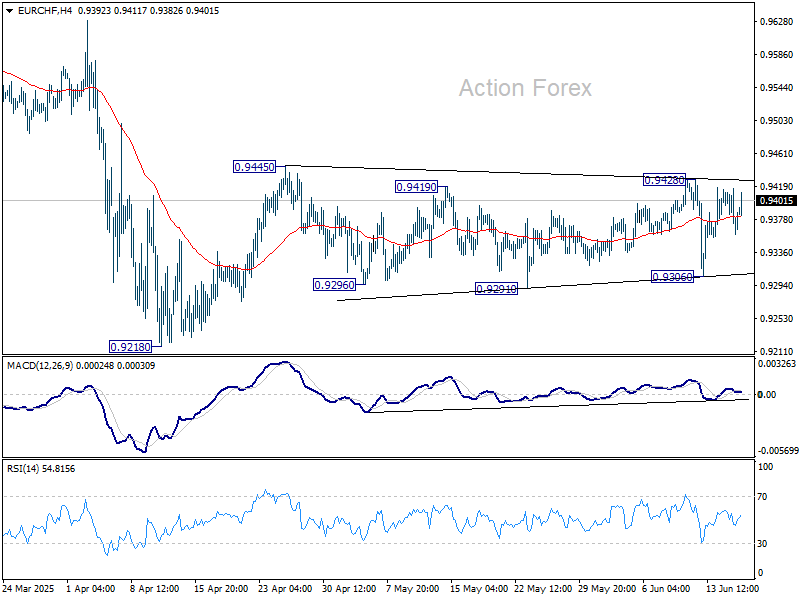
In the bigger picture, prior rejection by long-term falling channel resistance (now at 0.9527) retains medium term bearishness. That is, down trend from 1.2004 (2018 high) is still in progress. Firm break of 0.9204 (2024 low) will confirm resumption. This will remain the favored case as long as 0.9660 resistance holds.
USD/CAD Daily Outlook
Daily Pivots: (S1) 1.3593; (P) 1.3644; (R1) 1.3730; More...
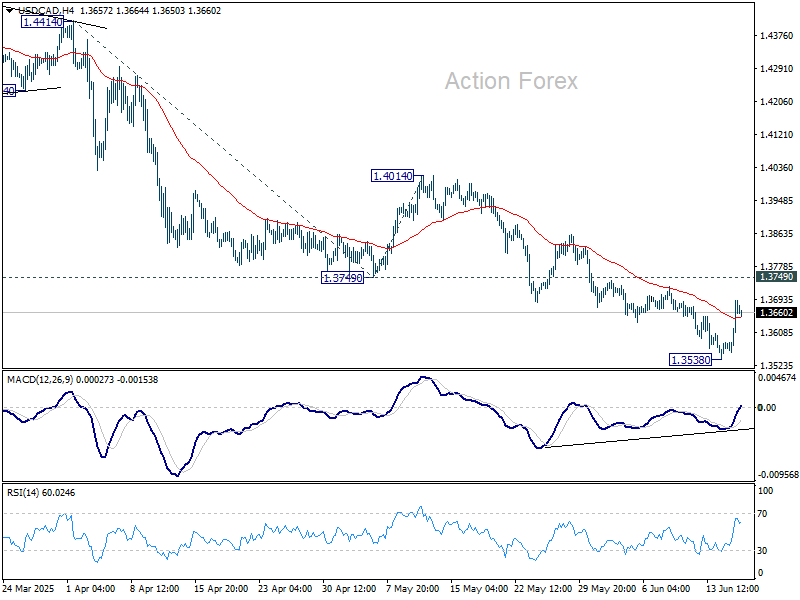
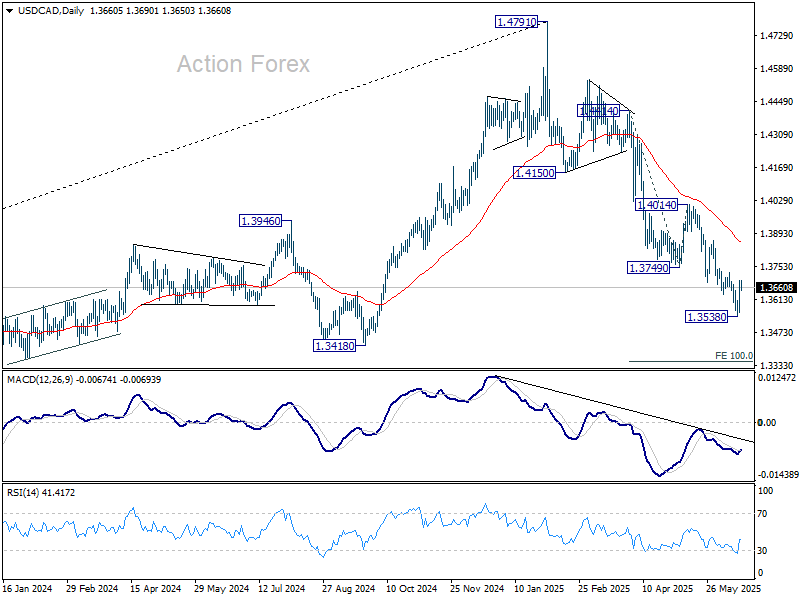
Intraday bias in USD/CAD is turned neutral first with current recovery and some consolidations would be seen above 1.3538 temporary low. Further decline is expected as long as 1.3749 support turned resistance holds. Below 1.3538 will extend larger fall from 1.4791 to 100% projection of 1.4414 to 1.3749 from 1.4014 at 1.3349. However, considering bullish convergence condition in 4H MACD, firm break of 1.3749 will indicate short term bottoming, and bring stronger rebound back to 1.4014 resistance.
In the bigger picture, price actions from 1.4791 medium term top could either be a correction to rise from 1.2005 (2021 low), or trend reversal. In either case, further decline is expected as long as 1.4014 resistance holds. Next target is 61.8% retracement of 1.2005 (2021 low) to 1.4791 at 1.3069.
AUD/USD Daily Report
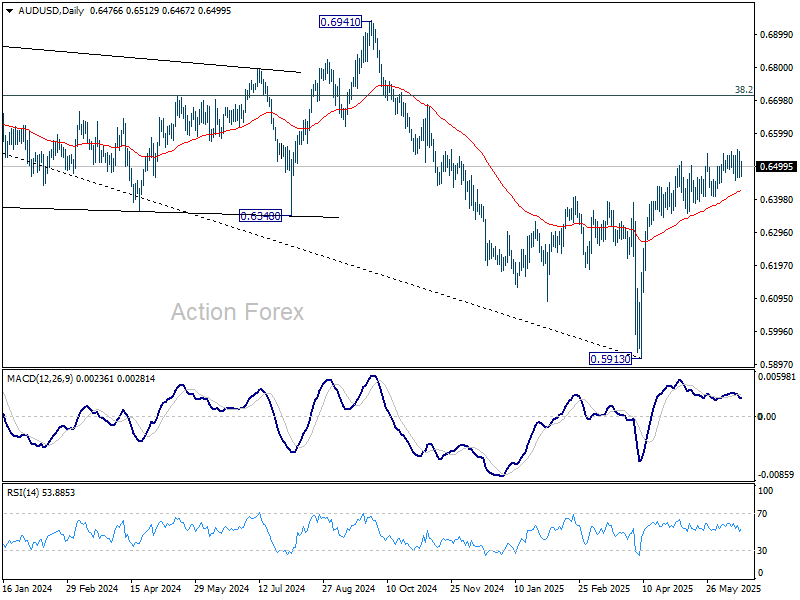
Daily Pivots: (S1) 0.6447; (P) 0.6495; (R1) 0.6525; More...
AUD/USD retreated once again after edging higher to 0.6551. Intraday bias is turned neutral. On the downside, break of 0.6455 support will turn bias back to the downside for deeper pullback to 55 D EMA (now at 0.6425) and below. Nevertheless, above 0.6651 will extend the rally from 0.5913 towards 0.6713 fibonacci level.
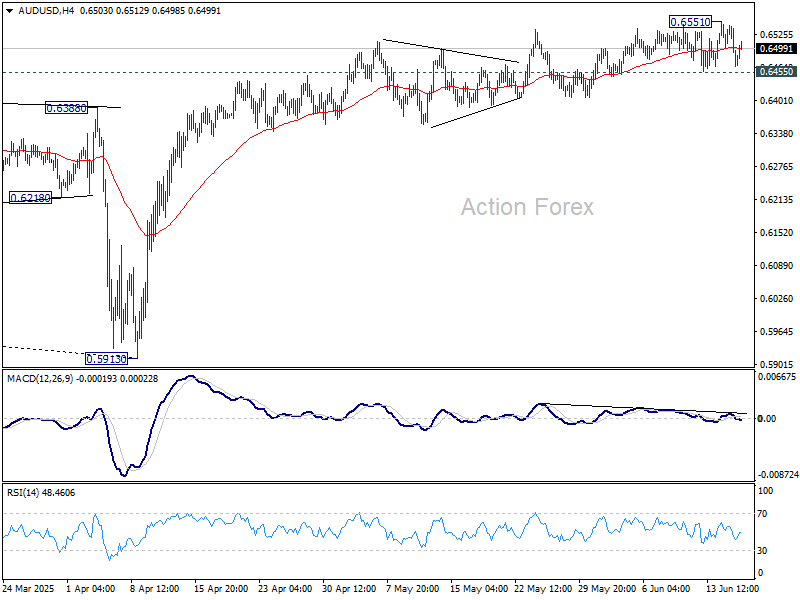
In the bigger picture, AUD/USD is still struggling to sustain above 55 W EMA (now at 0.6443) cleanly, and outlook is mixed. Sustained trading above 55 W EMA will indicate that rise from 0.5913 is at least correcting the down trend from 0.8006 (2021 high), with risk of trend reversal. Further rise should be seen to 38.2% retracement of 0.8006 to 0.5913 at 0.6713. However, rejection by 55 W EMA will revive medium term bearishness for another fall through 0.5913 at a later stage.
Yen Halts Decline, But Domestic Signals Remain Negative
The USD/JPY pair stabilised at 145.11 following three consecutive days of gains.
The Japanese yen had previously faced downward pressure due to a combination of factors, including weak macroeconomic data. Japan’s exports declined for the first time in eight months, indicating that the impact of US tariffs is now being felt. Meanwhile, imports fell more sharply than anticipated, heightening concerns over weakening external demand.
Other indicators painted a similarly bleak picture. Machinery orders dropped significantly in April, while industrial sentiment deteriorated in June. These developments suggest that signs of softening domestic demand are increasingly apparent.
The Bank of Japan (BoJ) held a meeting the previous day, leaving interest rates unchanged and reaffirming its cautious approach to reducing balance sheet assets. BoJ Governor Kazuo Ueda emphasised that the central bank is closely monitoring economic conditions and global trade dynamics, leaving open the possibility of future rate hikes.
Additional pressure on the yen came from the lack of progress at the G7 summit in Canada, where Prime Minister Shigeru Ishiba and US President Donald Trump failed to reach an agreement on tariff cooperation.
Technical analysis of USD/JPY
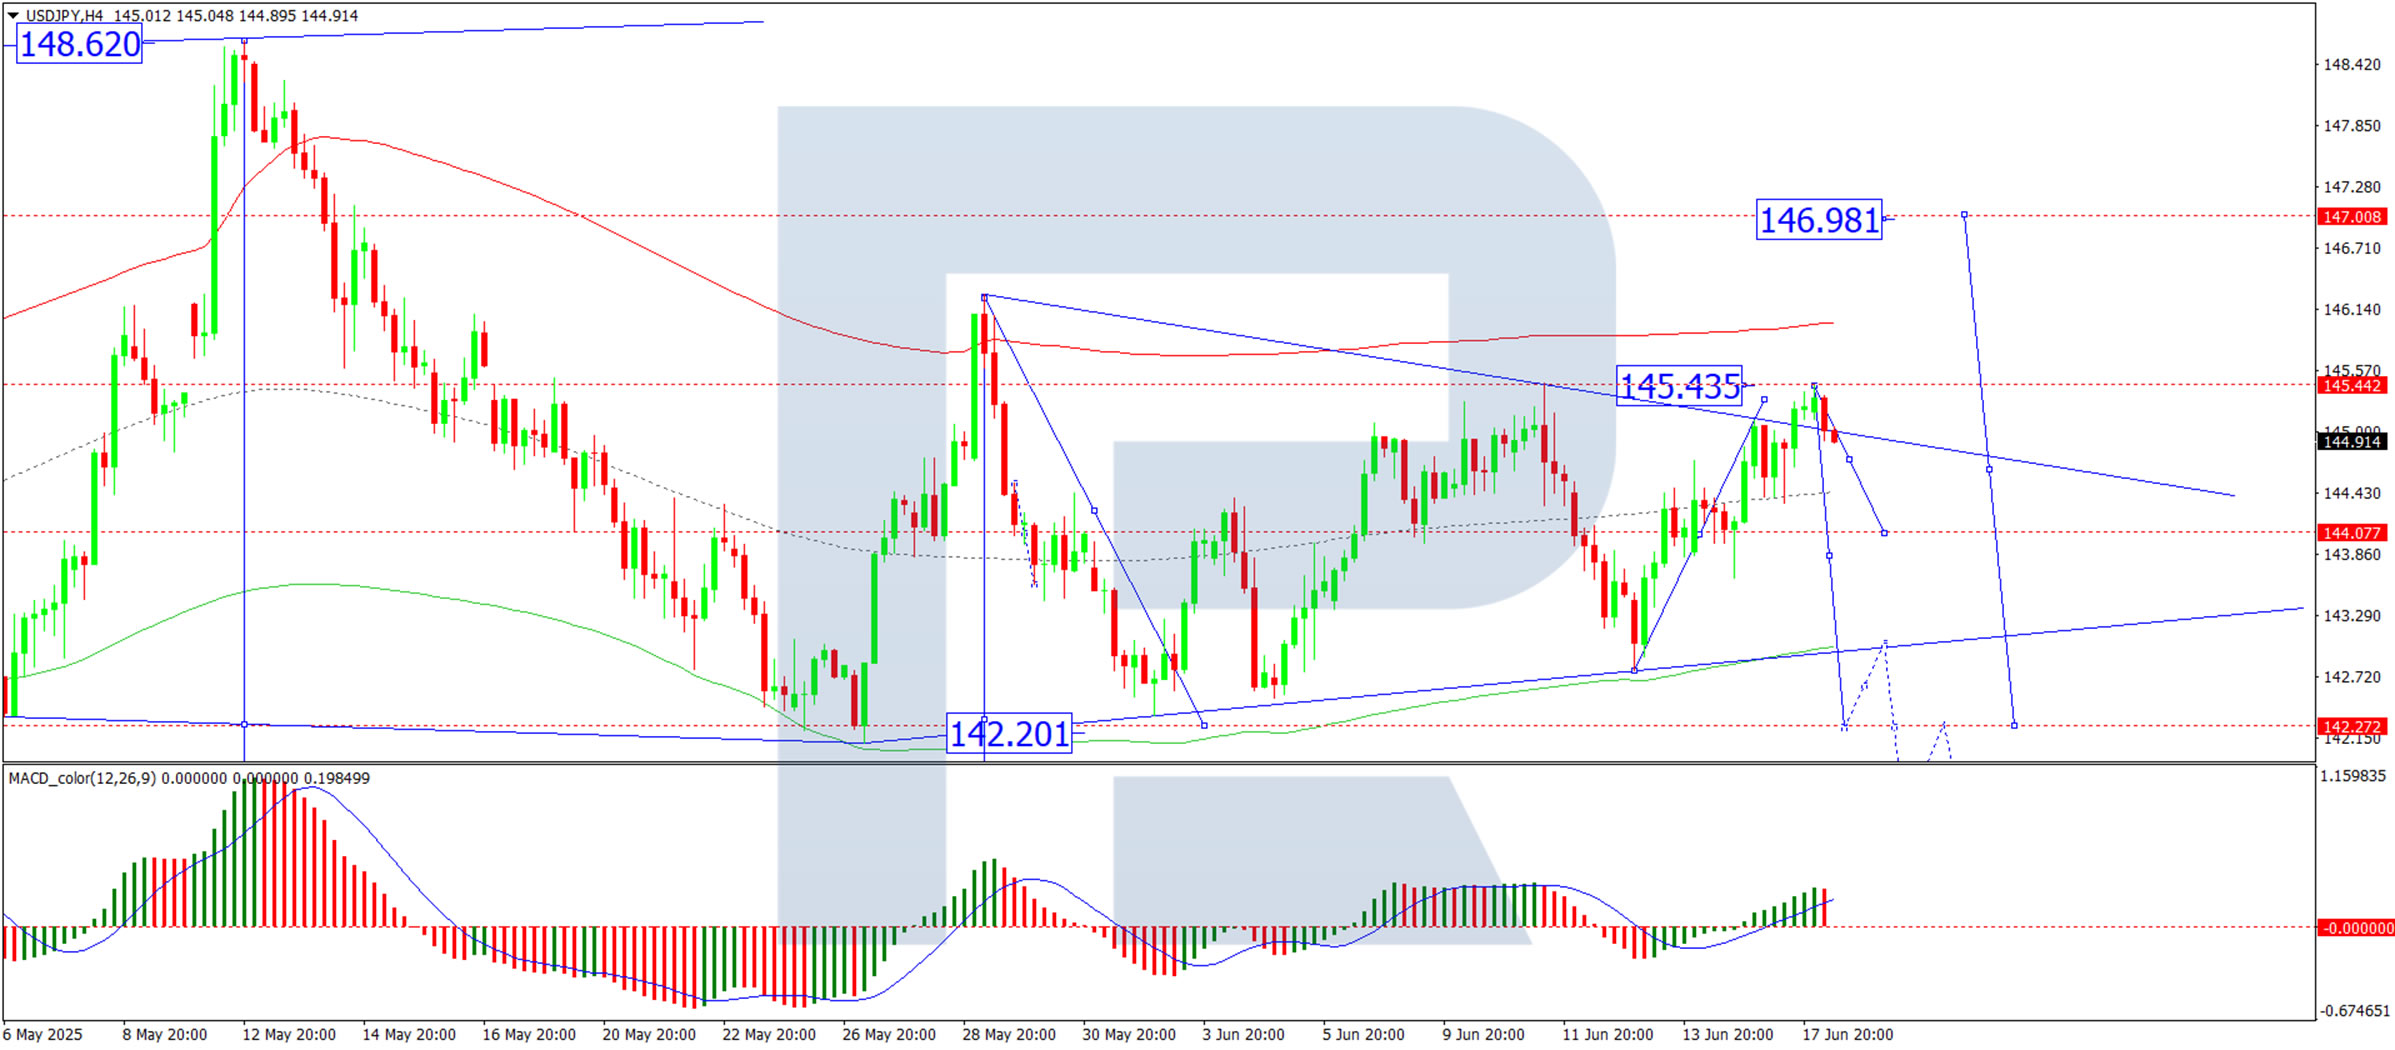
H4 Chart:
The market has completed an upward wave to the upper boundary of the consolidation range at 145.43. Having reached this target, a decline towards 144.00 is now anticipated. A break below this level could open the door for a further drop towards 142.20, with the potential to extend the downtrend to 140.50. Conversely, an upward move would raise the likelihood of a rally towards 146.98. This scenario is supported by the MACD indicator, where the signal line remains above zero and has exited the histogram area. A downward correction with new lows on the indicator is likely to follow.
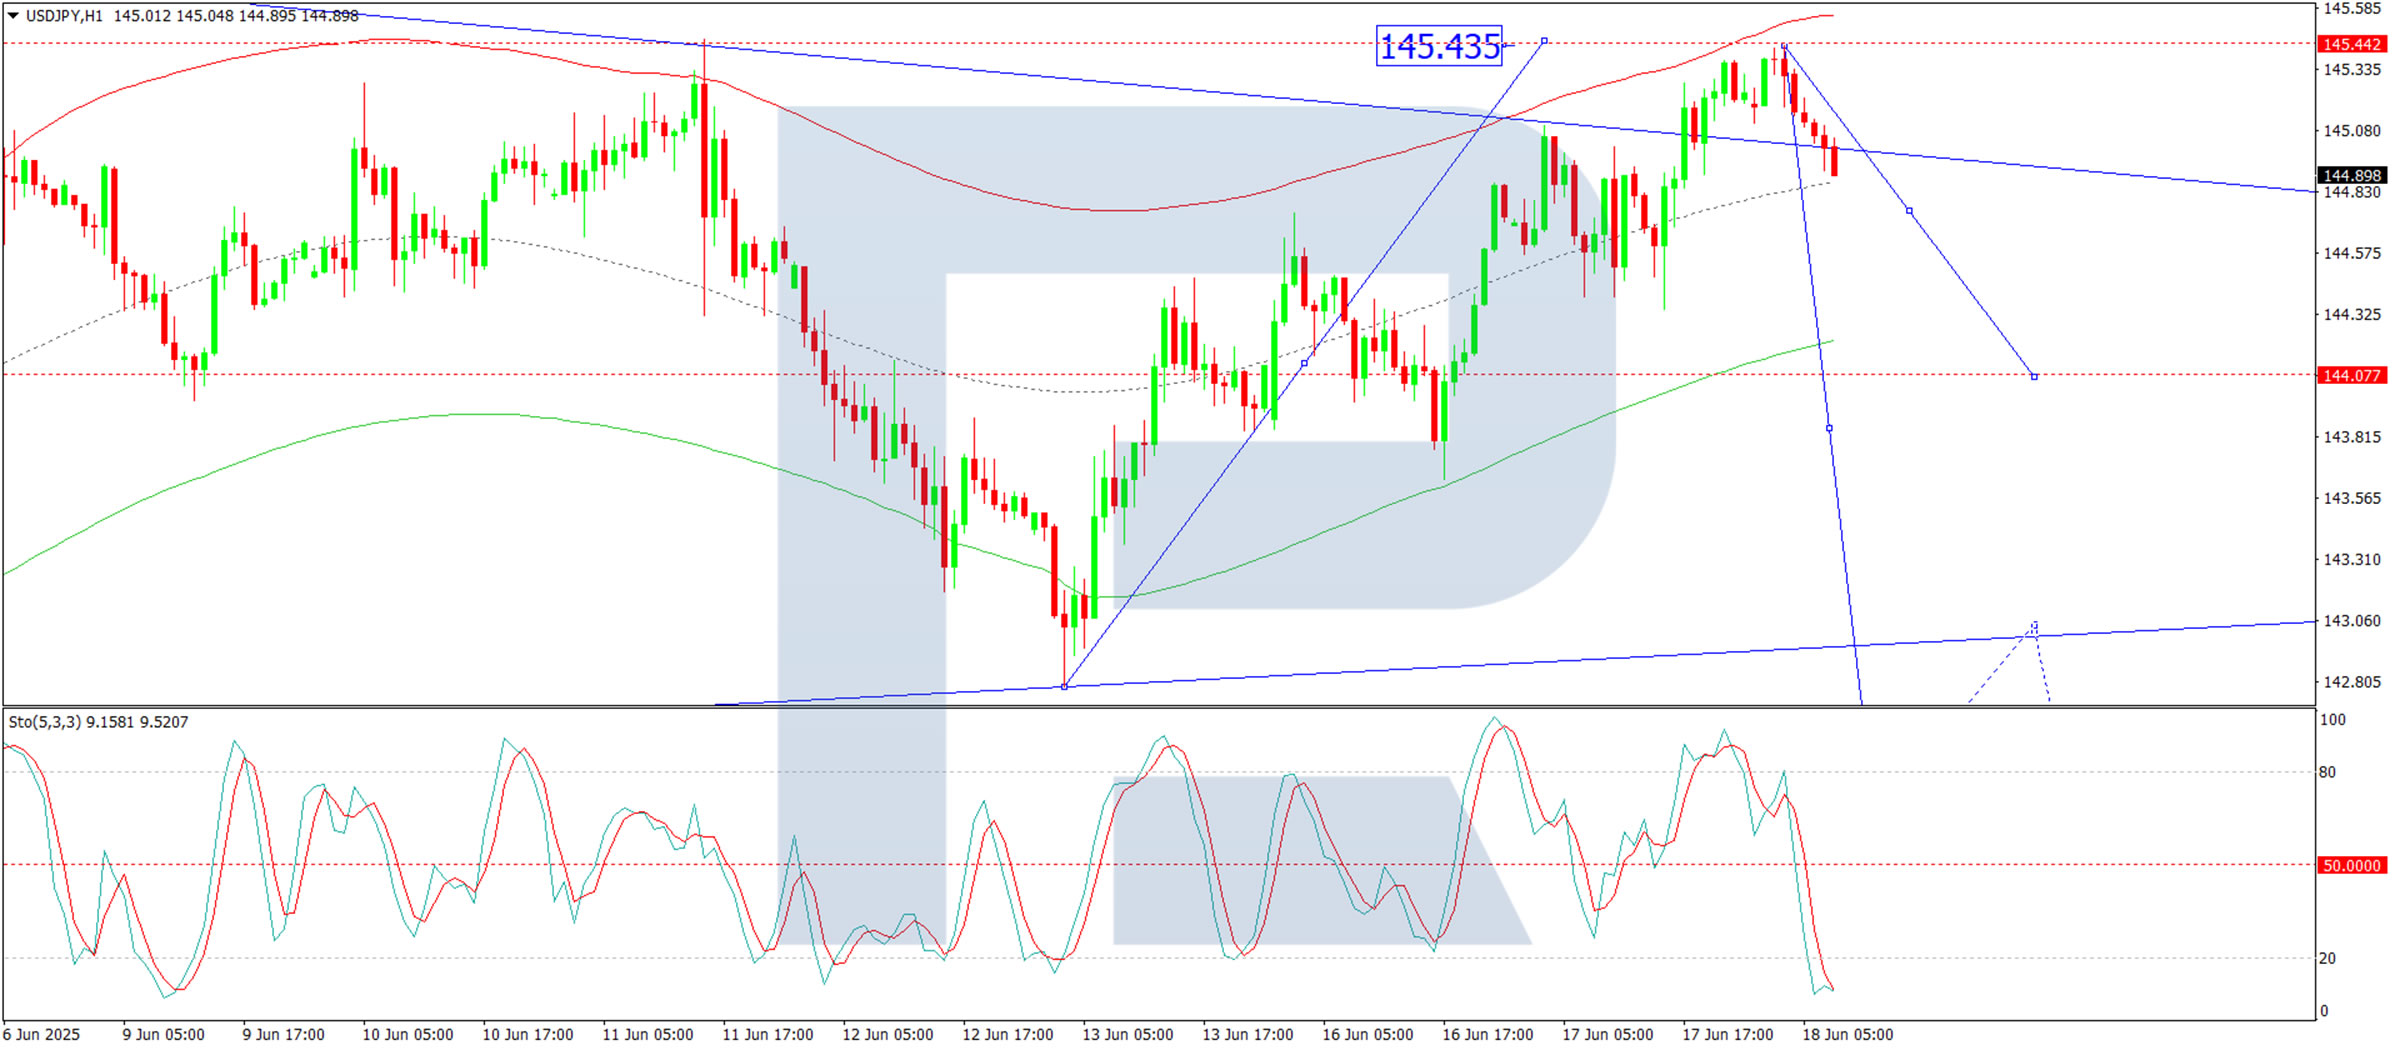
H1 Chart:
The market is forming a bearish wave structure targeting 144.00, which is likely to be reached today. Following this, a corrective rebound towards 144.80 may occur. Overall, price action continues to develop within a broad consolidation range at these levels. The Stochastic oscillator corroborates this outlook, with its signal line positioned below 20 and pointing sharply downward.
Conclusion
While the yen’s decline has paused, domestic economic signals remain unfavourable. With weak trade data, cautious BoJ policy, and stalled international negotiations, the currency faces ongoing headwinds. Technically, the USD/JPY pair shows potential for further downside, though a corrective rebound cannot be ruled out.