Sample Category Title
Gold (XAU/USD) Forecast: Gold Faces Headwinds as Risk Appetite Improves
- Gold prices decline as US-China trade deal hopes rise, impacting safe-haven demand.
- US GDP contracts in Q1 2025, but tariff developments overshadow data releases.
- Key support levels for Gold (XAU/USD) are identified as bearish pressure builds, with 3200 and 3167 being crucial
Gold prices have slipped below two crucial areas of support as hopes of a trade deal between the US-China continues to grow. The precious metal is now trading near a two-week low.
Risk appetite and sentiment continues to improve on rising hopes that a trade deal between the US-China will be reached. According to reports from both Bloomberg and the Financial Times, the Trump administration has reportedly tried reaching out to Beijing to start tariff talks, according to a Chinese state-run media outlet.
The outlet stated that China isn’t in a rush to negotiate and won’t engage unless the US takes meaningful actions. However, it added that there’s no harm for China in talking if the US wants to. Analysts noted this language shows a softer stance from Beijing compared to last week, when China’s commerce ministry said negotiations couldn’t begin until the US removed its heavy tariffs.
The result of this growing optimism has definitely weighed on safe haven demand and thus pushed Gold prices lower.
US GDP contracts in Q1
The U.S. economy shrank by 0.3% in the first quarter of 2025, its first decline since early 2022. This was a sharp drop from 2.4% growth in the previous quarter and missed market predictions of 0.3% growth.
A 41.3% jump in imports played a big role in slowing the economy, as businesses and consumers stocked up on goods ahead of higher costs from new tariffs announced by the Trump administration. Consumer spending grew just 1.8%, its slowest pace since mid-2023, and federal government spending fell by 5.1%, the biggest drop since early 2022. However, fixed investment rose by 7.8%, the largest increase since mid-2023.
The impact saw the US Dollar weaken as recession fears gained momentum. Gold prices also enjoyed a rally but as we have noted of late, tariff developments will overshadow data releases in the short-term.
Gold failed to hold onto gains and experienced a swift selloff in the Asian session as it failed to consolidate gains above the $3300/oz handle.
Looking ahead
There remains a significant amount of high impact data releases for the US this week, with the NFP release tomorrow taking center stage.
Even if the data disappoints, the chances of a stellar Gold recovery may not be forthcoming. As long as sentiment and risk appetite continues to improve Gold bulls will face significant headwinds.
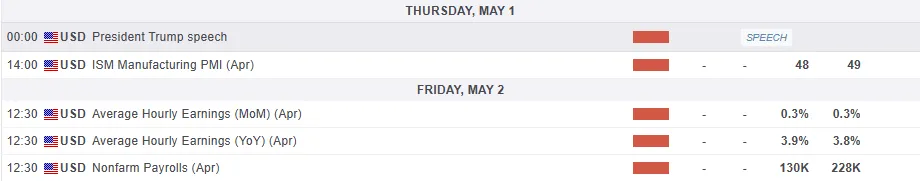
For all market-moving economic releases and events, see the MarketPulse Economic Calendar. (click to enlarge)
Technical Analysis - Gold (XAU/USD)
From a technical analysis standpoint, Gold prices have failed to hold above crucial support at the $3300/oz handle.
A daily candle close below the 3300 handle yesterday has led to an accelerated selloff in the Asian session. This has continued after the European open with the precious metal trading at 3220 at the time of writing.
Looking at the period-14 RSI and it is approaching the neutral 50 level which could prove key. A bounce here could be a sign that bullish momentum remains intact and thus facilitate a short-term recovery.
The precious metal is down around $60 on the day and yet a push toward support at the 3200 handle looks likely.
A crucial level of support i will be keeping an eye on rests at 3167, which was the April 3 swing high, just after the universal tariff announcements. This level could hold the key, and have a big impact on whether the precious metal is able to hold above the crucial 3000 handle.
Gold (XAU/USD) Daily Chart, May 1, 2025
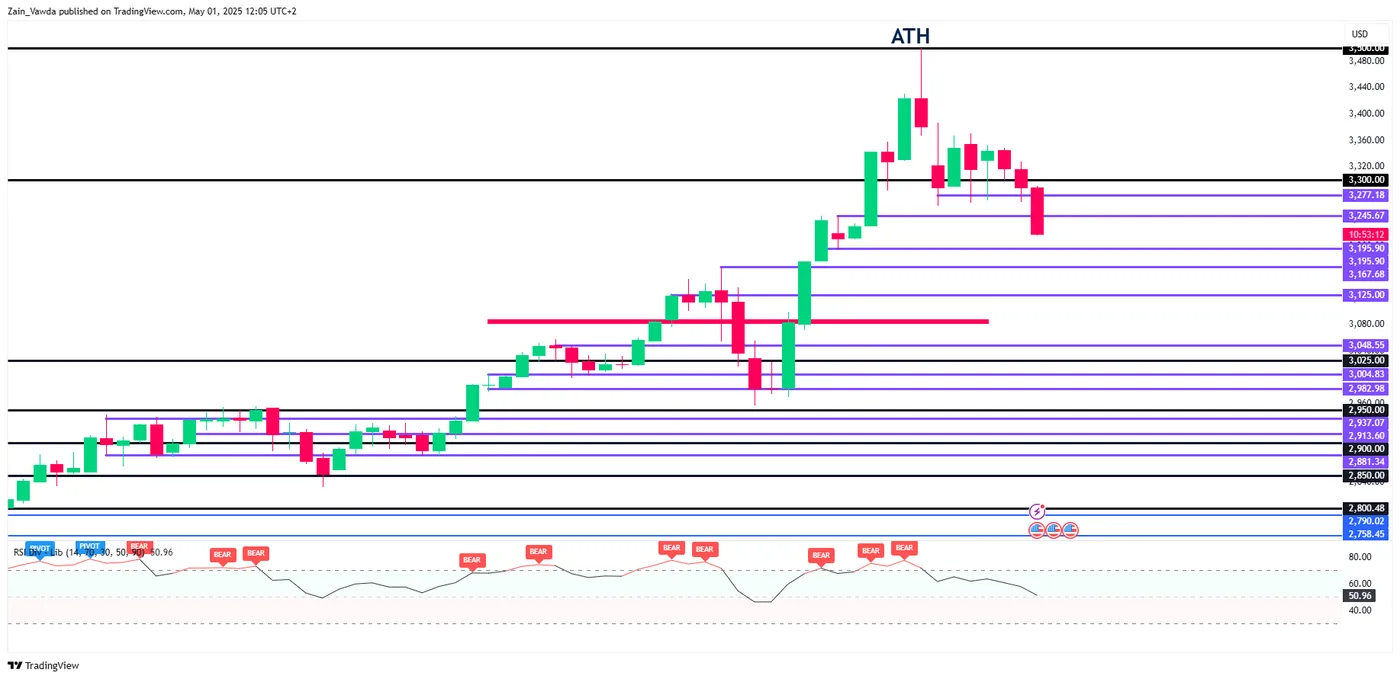
Source: TradingView (click to enlarge)
Support
- 3195
- 3167
- 3150
Resistance
- 3250
- 3300
- 3325
Yen Slides as BoJ Cuts Growth Forecast
The Japanese yen continues to lose ground and is sharply lower on Thursday. In the European session, USD/JPY is trading at 144.36, up 0.92% on the day. Earlier, the yen weakened to 144.74, its weakest level since April 10.
BoJ stays pat, pessimistic about tariffs
There were no surprises from the Bank of Japan, which maintained its key interest rate at 0.5% in a unanimous vote. The BoJ has signaled that it plans to continue hiking rates and normalize policy, but the turmoil caused by US President Trump's tariff policy may delay the next rate increase until after the summer.
The BoJ board cut its growth and inflation forecasts in its quarterly outlook report. The growth forecast for the fiscal year ending March 2026 was slashed to 0.5% from 1.1% in January and inflation is not expected to remain sustainable at 2% until the second half of 2026, a year later than in the January forecast.
The forecast noted that US tariffs would dampen Japan's economy by weighing on global trade and consumer and businesses confidence would be impacted due to the "heightened uncertainties" over the tariffs.
US GDP takes a tumble
The markets expected a soft GDP release for Q1 but the 0.3% q/q decline was well below the market estimate of 0.2%. This followed a strong 2.4% gain in the fourth quarter of 2024. The surprise decline was driven by Trump's tariffs, as imports surged ahead of the tariffs taking effect and consumer spending declined.
The weak GDP figure raised the probability of further rate cuts and the markets are looking for up to four rate cuts before the end of the year. The Fed is in a wait-and-see mode, with little chance of a cut in May, but further economic deterioration could force the Fed to cut in June.
USD/JPY Technical
- USD/JPY has pushed above resistance at 143.45 and 143.84 and is testing resistance at 144.48
- There is support at 142.81 and 142.42
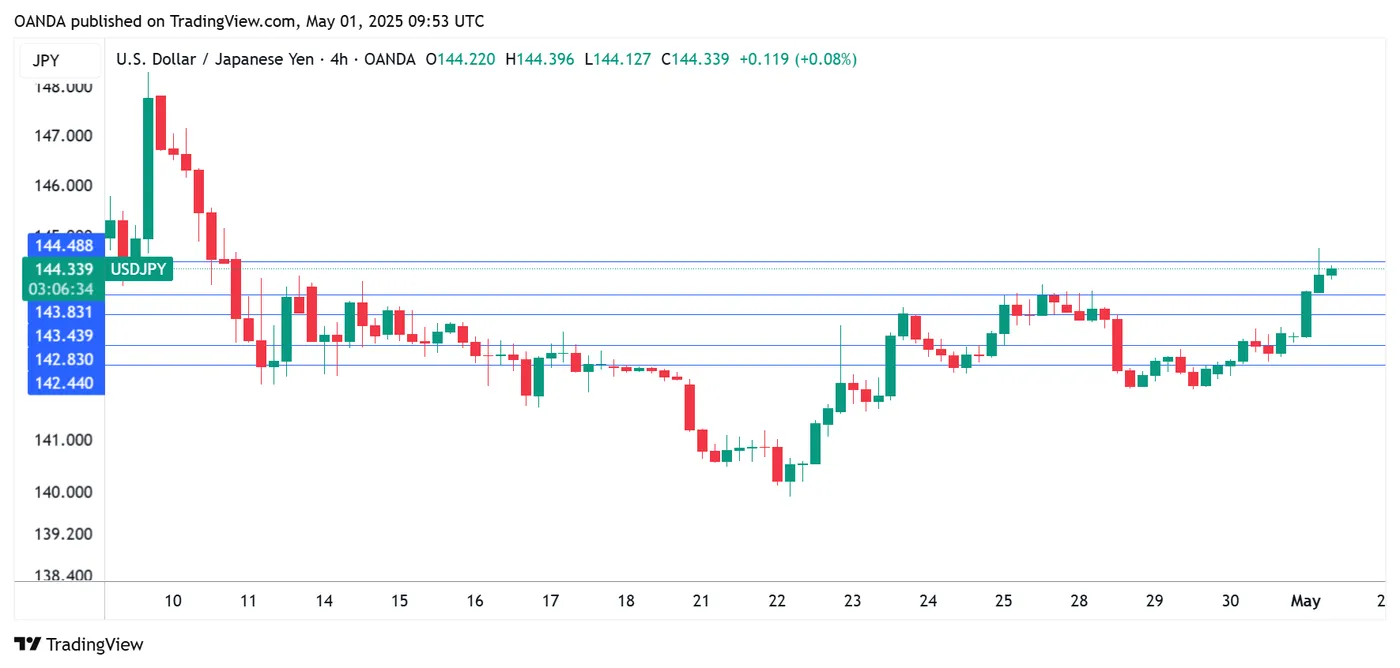
USDJPY 1-Day Chart, May 1. 2025
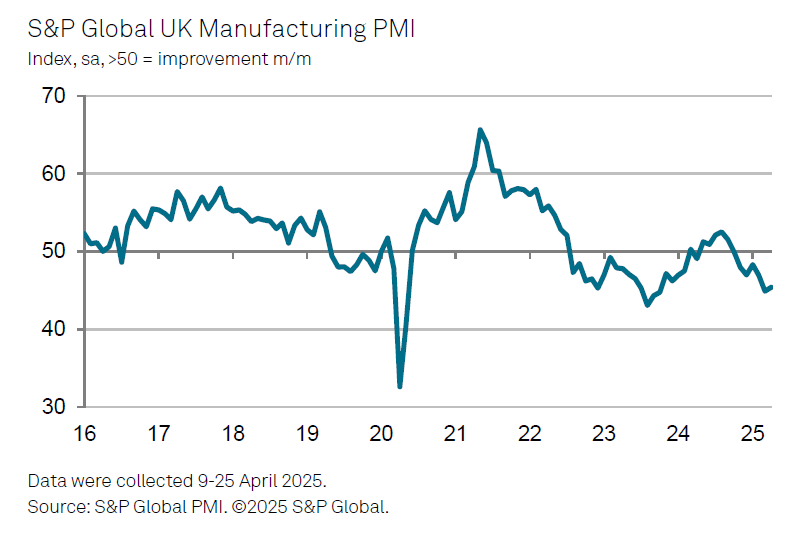
UK PMI manufacturing finalized at 45.4, rising costs, declining demand
UK manufacturing continued to contract in April, with PMI finalized at 45.4, a modest rise from March’s 44.9.
The sector is facing mounting challenges as output, new orders, and exports all declined further. Business confidence also fell to its lowest level since late 2022, reflecting growing unease over global trade disruptions and rising input costs.
S&P Global’s Rob Dobson highlighted a nearly five-year record drop in new export orders, particularly from the US, Europe, and China.
Manufacturers are also being squeezed by a surge in purchase price inflation, now at a 28-month high. This is prompting firms to raise prices and cut discretionary spending, reinforcing a troubling mix of "rising costs, declining demand".
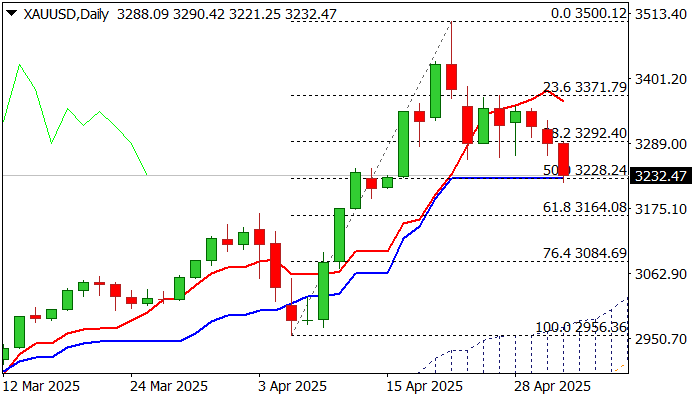
Gold: Loss of Pivotal $3300 Support Zone Generates Reversal Signal
Gold dropped 1.6% in holiday-thinned Asian trading on Thursday, hitting the lowest in two weeks, as fresh risk appetite on fading trade tensions further dented metal’s safe-haven appeal.
Loss of pivotal $3300 support zone has generated strong bearish signal (daily close below these levels to confirm the signal).
Fresh bears cracked next strong supports at $3230 zone (daily Kijun-sen / 50% retracement of $2959/$3500 upleg), adding to negative near term outlook.
Daily studies show 14-d momentum in a steep fall and approaching the centreline, while daily Tenkan-sen turned south that supports the action.
April’s monthly candle with very long upper shadow also contributes to developing reversal signal.
Firm break of $3230 zone to further weaken near term structure and expose targets at $3200 (psychological) and $3164 (Fibo 61.8%) in extension.
Former spike lows at $3260 mark initial resistances, with $3300 zone now acting as solid resistance which should cap potential upticks and signal positioning for deeper correction.
Res: 3260; 3292; 3300; 3328
Sup: 3221; 3200; 3164; 3100
BoJ’s Ueda: Inflation target delay won’t necessarily postpone rate hikes
At the post meeting press conference, BoJ Kazuo Ueda acknowledged that the surge in global trade tensions, sparked by the US's "reciprocal" tariffs, has sharply elevated uncertainty over global policy direction. He warned that these tariff shocks would "weigh on" on Japan’s growth and inflation in the near term, but expressed hope that such effects would fade as overseas economies stabilize.
Ueda noted that BoJ downgraded its growth outlook for fiscal 2025 and 2026, with both inflation and wage gains expected to "likely slow somewhat. However, he maintained that Japan’s "severe labour shortage" should keep the positive wage-inflation cycle intact over the medium term.
Despite pushing back the timeline for inflation to converge with the 2% target, Ueda stressed "that doesn't mean the timing of further rate hikes will automatically be delayed by the same margin."
Ueda emphasized that BoJ's forecasts hinge on the assumption that trade negotiations will progress and avoid serious supply chain disruptions. However, he admitted that the probability of the baseline scenario being realized "is no longer very high." Further tariff escalation could alter both the economic outlook and BoJ’s future policy stance.
GBP/USD Corrects Gains While USD/CAD Dips
GBP/USD started a downside correction from the 1.3450 zone. USD/CAD declined and now consolidates below the 1.3850 level.
Important Takeaways for GBP/USD and USD/CAD Analysis Today
- The British Pound rallied above 1.3200 and 1.3320 before the bears appeared.
- There is a key bearish trend line forming with resistance at 1.3375 on the hourly chart of GBP/USD at FXOpen.
- USD/CAD started a fresh decline after it failed to clear the 1.3900 resistance.
- There is a major bearish trend line forming with resistance at 1.3815 on the hourly chart at FXOpen.
GBP/USD Technical Analysis
On the hourly chart of GBP/USD at FXOpen, the pair formed a base above the 1.3200 level. The British Pound started a steady increase above the 1.3320 resistance zone against the US Dollar, as discussed in the previous analysis.
The pair even cleared 1.3400 before the bears appeared. A high was formed at 1.3443 before there was a downside correction. There was a move below the 1.3400 and 1.3350 levels.
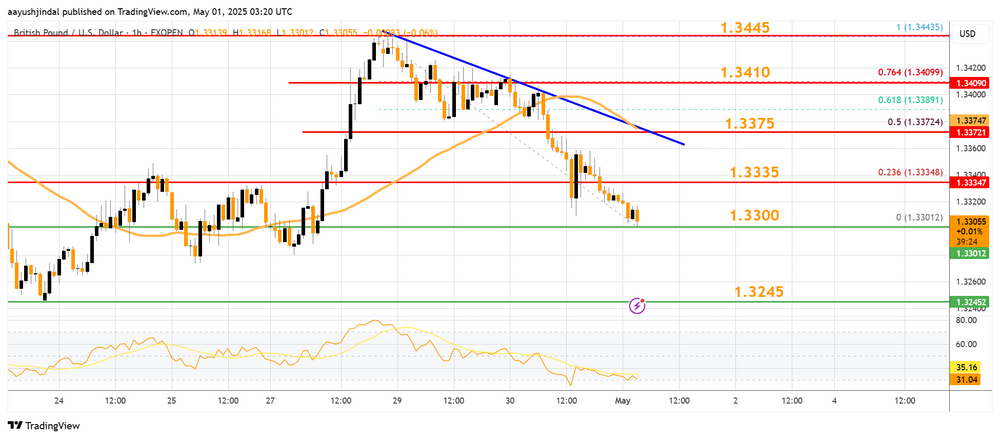
A low was formed at 1.3301 and the pair is now consolidating losses. On the upside, the pair is facing resistance near the 1.3335 level and the 23.6% Fib retracement level of the downward move from the 1.3443 swing high to the 1.3301 low.
The next key resistance near the 1.3375 level. There is also a key bearish trend line forming with resistance at 1.3375. The trend line is near the 50% Fib retracement level of the downward move from the 1.3443 swing high to the 1.3301 low.
An upside break above the 1.3375 zone could send the pair toward 1.3410. Any more gains might open the doors for a test of 1.3445.
If there is another decline, the pair could find support near the 1.3300 level. The first major support sits near the 1.3245 zone. The next major support is 1.3200. If there is a break below 1.3200, the pair could extend the decline. The next key support is near the 1.3150 level. Any more losses might call for a test of the 1.3080 support.
USD/CAD Technical Analysis
On the hourly chart of USD/CAD at FXOpen, the pair climbed toward the 1.4000 resistance zone before the bears appeared. The US Dollar formed a swing high near 1.3890 and recently declined below the 1.3850 support against the Canadian Dollar.
There was also a close below the 50-hour simple moving average and 1.3820. The bulls are now active near the 1.3770 level. The pair is now consolidating losses below the 23.6% Fib retracement level of the downward move from the 1.3892 swing high to the 1.3768 low.
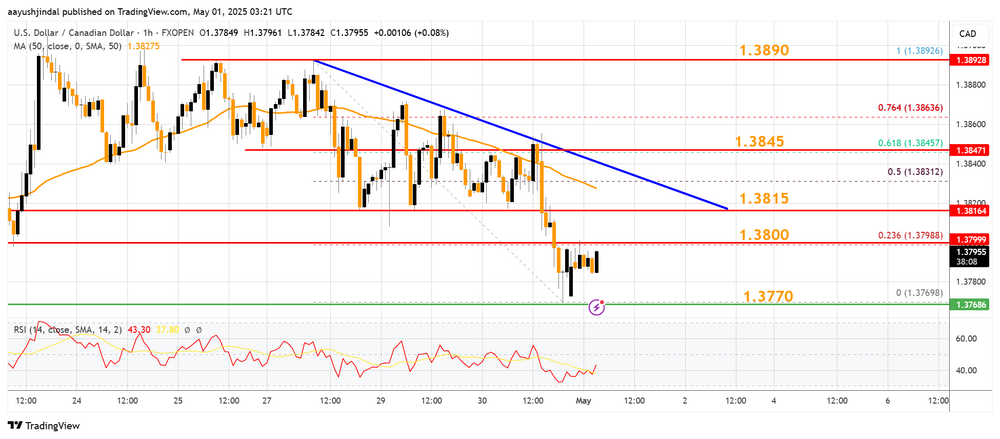
If there is a fresh increase, the pair could face resistance near the 1.3800 level. The next key resistance on the USD/CAD chart is near the 1.3815 level.
There is also a major bearish trend line forming with resistance at 1.3815. If there is an upside break above 1.3815, the pair could rise toward the 1.3845 resistance or the 61.8% Fib retracement level of the downward move from the 1.3892 swing high to the 1.3768 low.
The next major resistance is near the 1.3890 zone, above which it could rise steadily toward the 1.3950 resistance zone. Immediate support is near the 1.3770 level.
The first major support is near 1.3720. A close below the 1.3720 level might trigger a strong decline. In the stated case, USD/CAD might test 1.3640. Any more losses may possibly open the doors for a drop toward the 1.3550 support.
Trade over 50 forex markets 24 hours a day with FXOpen. Take advantage of low commissions, deep liquidity, and spreads from 0.0 pips. Open your FXOpen account now or learn more about trading forex with FXOpen.
This article represents the opinion of the Companies operating under the FXOpen brand only. It is not to be construed as an offer, solicitation, or recommendation with respect to products and services provided by the Companies operating under the FXOpen brand, nor is it to be considered financial advice.
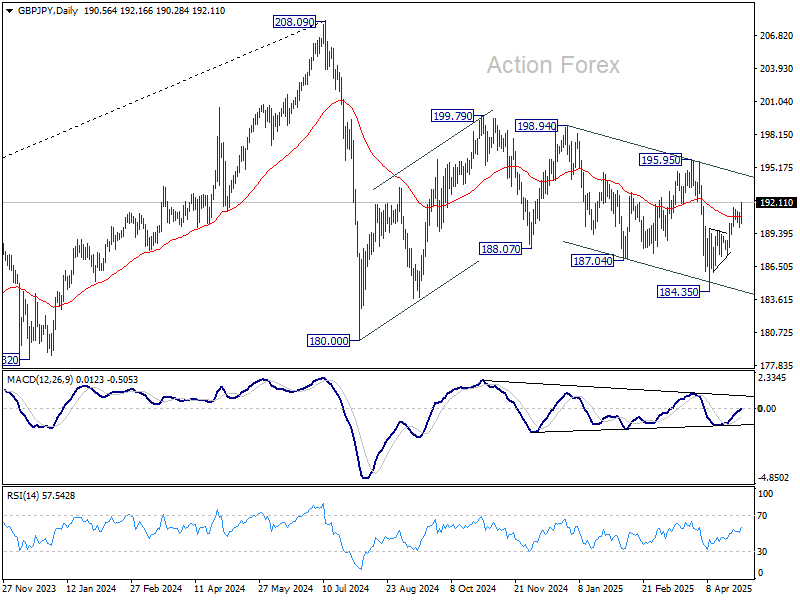
GBP/JPY Daily Outlook
Daily Pivots: (S1) 190.05; (P) 190.66; (R1) 191.33; More...
GBP/JPY's rise from 184.35 resumed by breaking through 191.70 and intraday bias is back on the upside. Further rally would be seen to 195.95 resistance next. For now, break of 189.97 support is needed to indicate short term topping. Otherwise, further rise will remain in favor in case of retreat.
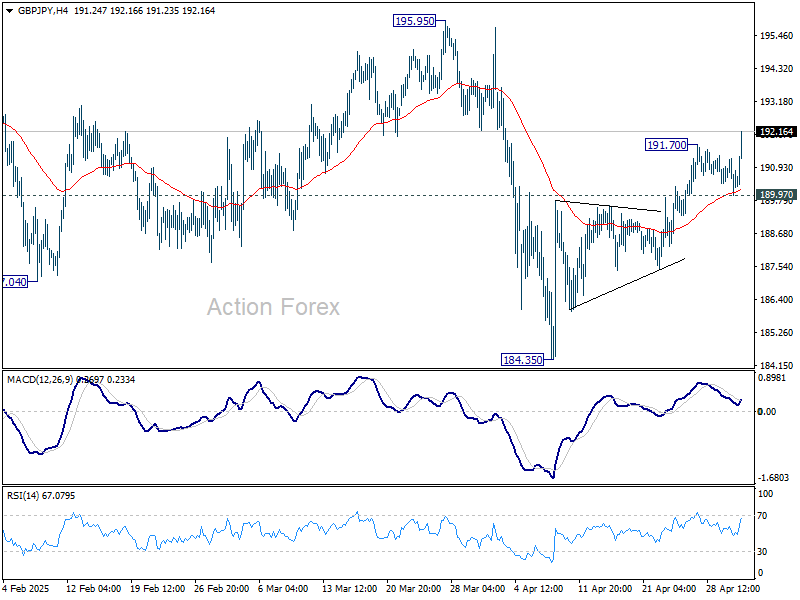
In the bigger picture, price actions from 208.09 are seen as a correction to rally from 123.94 (2020 low). Strong support should be seen from 38.2% retracement of 123.94 to 208.09 at 175.94 to contain downside. However, sustained break of 175.94 will bring deeper fall even still as a correction.
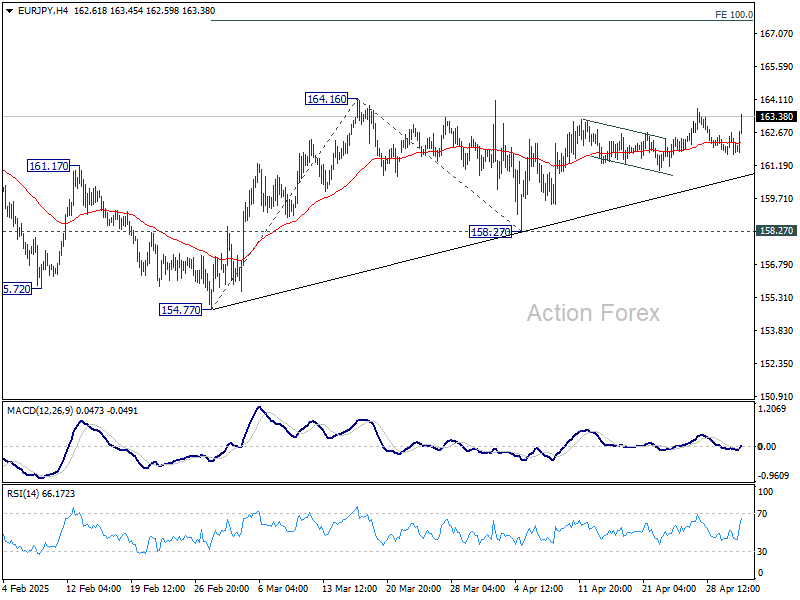
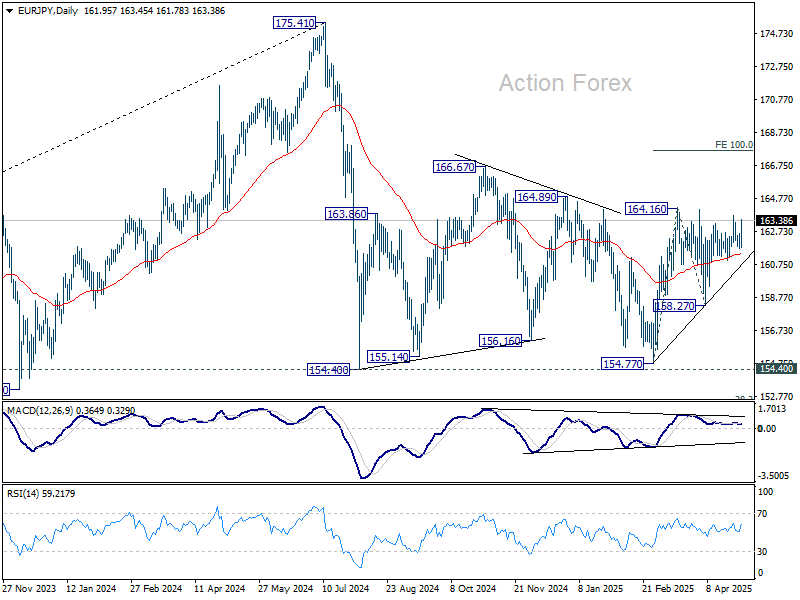
EUR/JPY Daily Outlook
Daily Pivots: (S1) 161.58; (P) 162.12; (R1) 162.53; More...
Intraday bias in EUR/JPY remains neutral a this point. On the upside, firm break of 164.16 will resume whole rise from 154.77. Next target will be 100% projection of 154.77 to 164.16 from 158.27 at 167.66. However, break of 158.27 will bring deeper fall back to 154.40/77 support zone.
In the bigger picture, price actions from 175.41 are seen as correction to rally from 114.42 (2020 low). Strong support should be seen from 38.2% retracement of 114.42 to 175.41 at 152.11 to contain downside. However, sustained break of 152.11 will bring deeper fall even still as a correction.
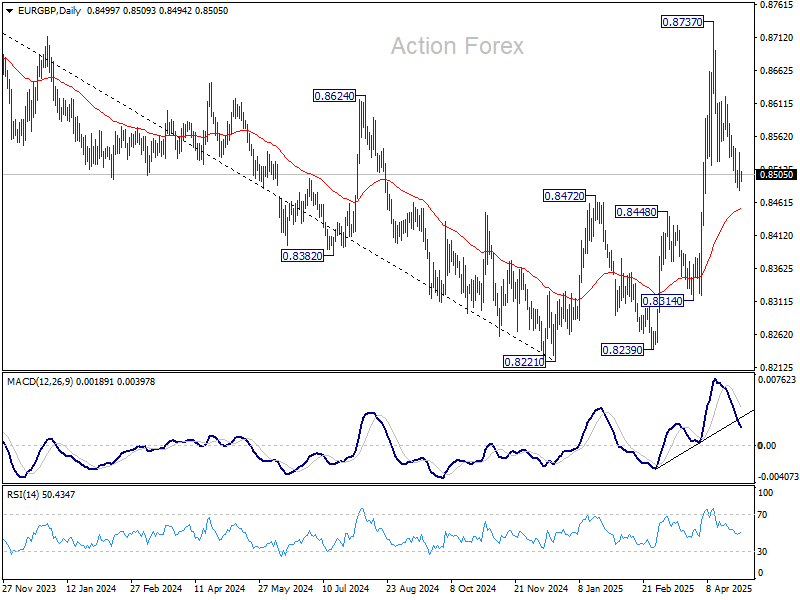
EUR/GBP Daily Outlook
Daily Pivots: (S1) 0.8474; (P) 0.8507; (R1) 0.8531; More...
EUR/GBP's decline from 0.8737 is still in progress and deeper fall could be seen to 55 D EMA (now at 0.8453). Sustained break there will argue that whole rebound from 0.8221 has completed and turn near term outlook bearish. On the upside, though, break of 0.8622 resistance will bring retest of 0.8737.
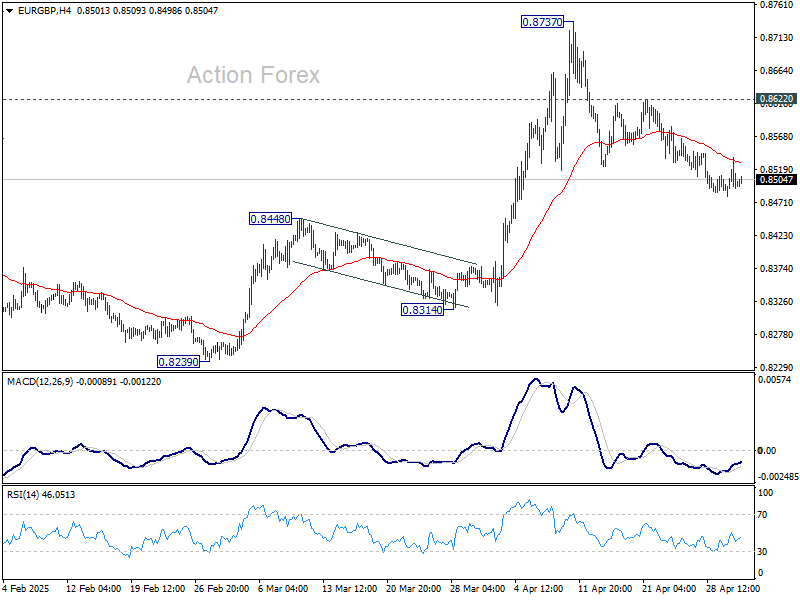
In the bigger picture, down trend from 0.9267 (2022 high) should have completed at 0.8221, just ahead of 0.9201 key support (2024 low). Rise from 0.8221 is likely reversing the whole fall. Further rise should be seen to 61.8% retracement of 0.9267 to 0.8221 at 0.8867 next. This will remain the favored case as long as 0.8472 resistance turned support holds.
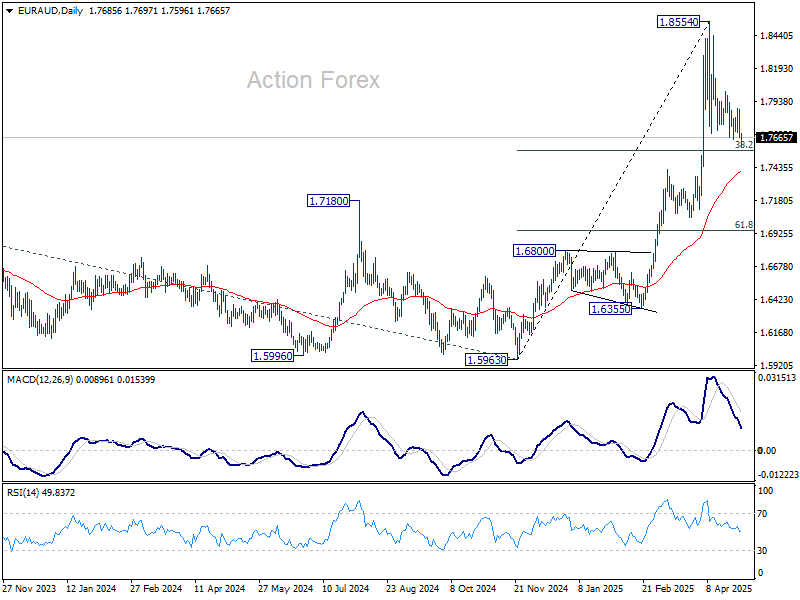
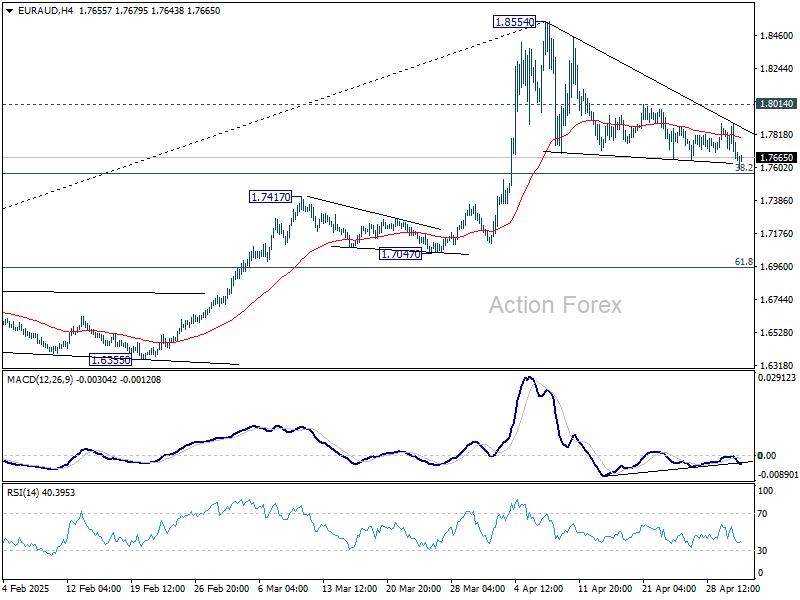
EUR/AUD Daily Outlook
Daily Pivots: (S1) 1.7616; (P) 1.7750; (R1) 1.7828; More...
Intraday bias in EUR/AUD remains neutral at this point. Corrective pattern from 1.8554 could extend, but downside should be contained by 38.2% retracement of 1.5963 to 1.8854 at 1.7750. On the upside, above 1.8014 minor resistance will bring retest of 1.8554 first. Firm break there will resume larger up trend. However, firm break of 1.7750 will bring deeper fall to 55 D EMA (now at 1.7399) and possibly below.
In the bigger picture, up trend from 1.4281 (2022 low) is in progress for 100% projection of 1.4281 to 1.7062 from 1.5963 at 1.8744. Firm break there will pave the way to 138.2% projection at 1.9806, which is close to 1.9799 (2020 high). Outlook will remain bullish as long as 1.7062 resistance turned support (2023 high) holds even in case of deep pullback.