Sample Category Title
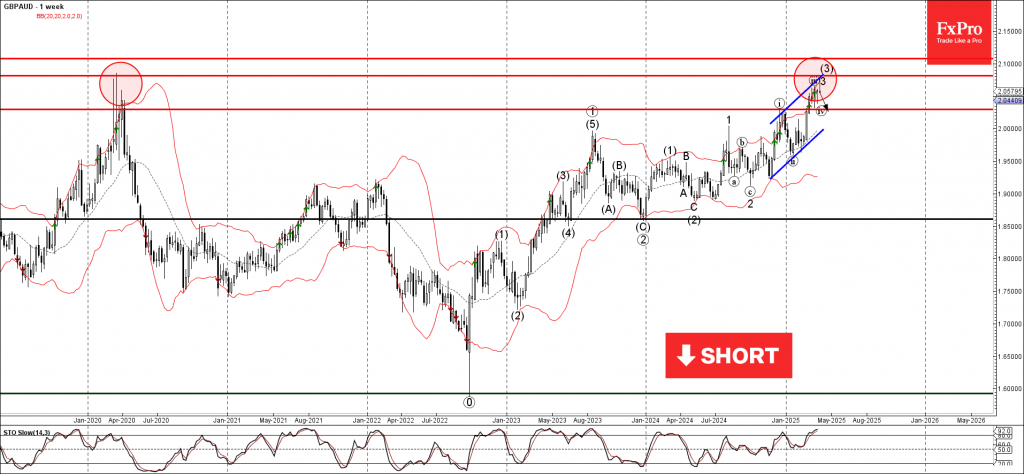
GBPAUD Wave Analysis
GBPAUD: ⬇️ Sell
- GBPAUD reversed from long-term resistance level 2.0820
- Likely to fall to support level 2.030
GBPAUD currency pair recently reversed from the resistance area located between the long-term resistance level 2.0820 (former multiyear high from 2020), resistance trendline of the weekly up channel from 2024 and the upper weekly Bollinger Band.
The downward reversal from this resistance area stopped the earlier short-term impulse wave 3 of the weekly upward impulse sequence (3) from the start of 2024.
Given the strength of the resistance level 2.0820 and the overbought weekly Stochastic, GBPAUD currency pair can be expected to fall to the next support level 2.030.
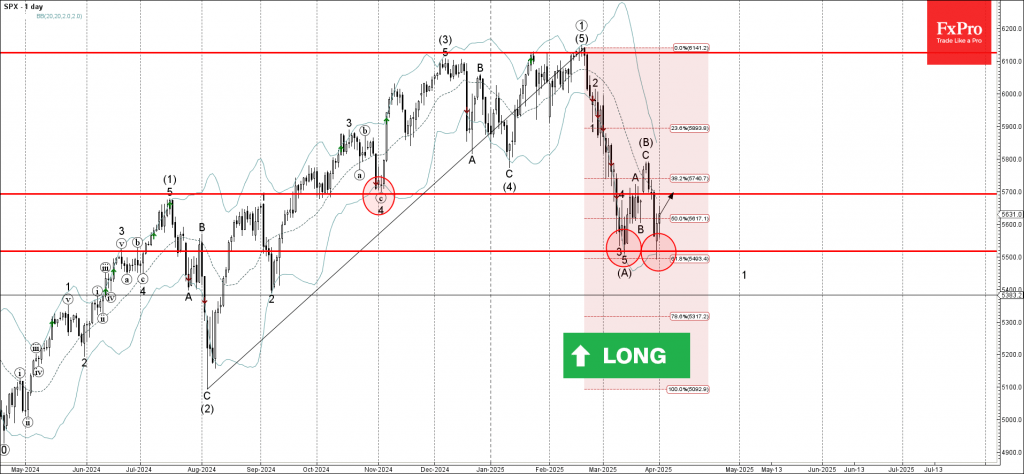
S&P 500 Wave Analysis
S&P 500: ⬆️ Buy
- S&P 500 reversed from support area
- Likely to rise to resistance level 5700.00
S&P 500 index recently reversed from the support area located between the support level 5500.00 (low of the previous wave (A)), lower daily Bollinger Band and the 61.8% Fibonacci correction of the uptrend from August.
The downward reversal from this support area stopped the earlier short-term impulse wave 1 of the downward impulse sequence (C) from the end of March.
Given the improving sentiment across the equity markets and the strength of the support level 5500.00, S&P 500 index can be expected to rise to the next resistance level 5700.00.
US100: Bearish Momentum Dominates Amid Tariff Fears
Fundamental Analysis
The Nasdaq 100 index has experienced a significant decline in the first quarter of 2025, dropping 10.5%, marking its worst quarterly performance since 2022. This downturn is primarily attributed to uncertainties stemming from President Donald Trump's trade tariffs, which have heightened fears of a global trade war. Large-cap tech stocks, such as Tesla and Nvidia, have suffered substantial losses, with declines of approximately 36% and 20%, respectively. Additionally, the anticipation of new tariffs has led investors to reduce their exposure to the technology sector, contributing to market volatility. In this context, the Nasdaq 100 is trading below its 200-day moving average, a technical analysis indicator that could signal a prolonged bearish trend.
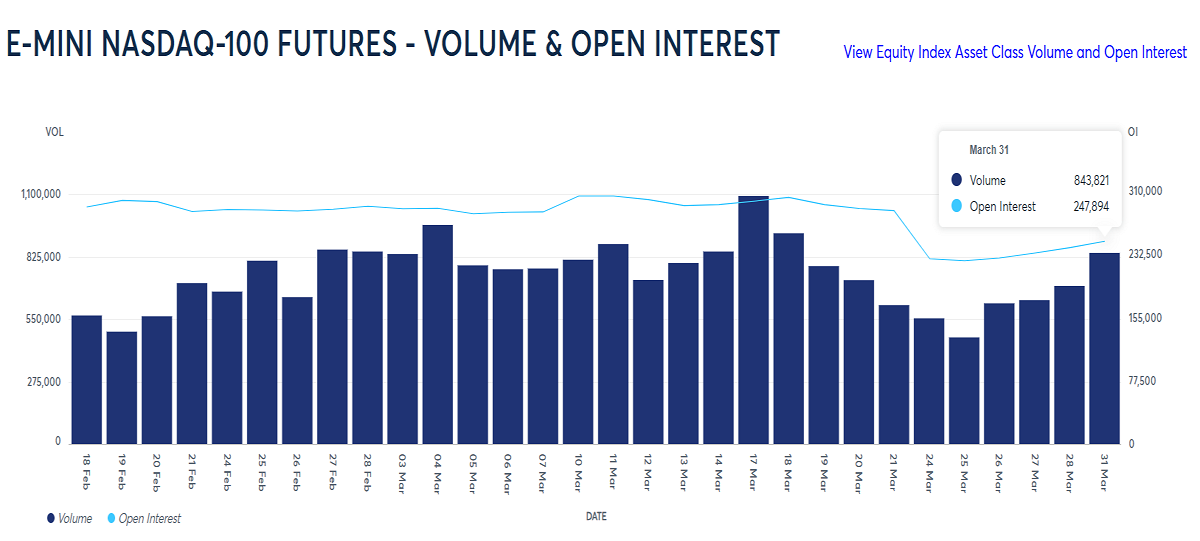
Volume and Open Interest in Nasdaq Futures: The June Nasdaq 100 futures contract has shown increasing volume and rising open interest during the price decline. This pattern suggests a strong bearish trend with potential for continuation in the short term. CME Group Trading
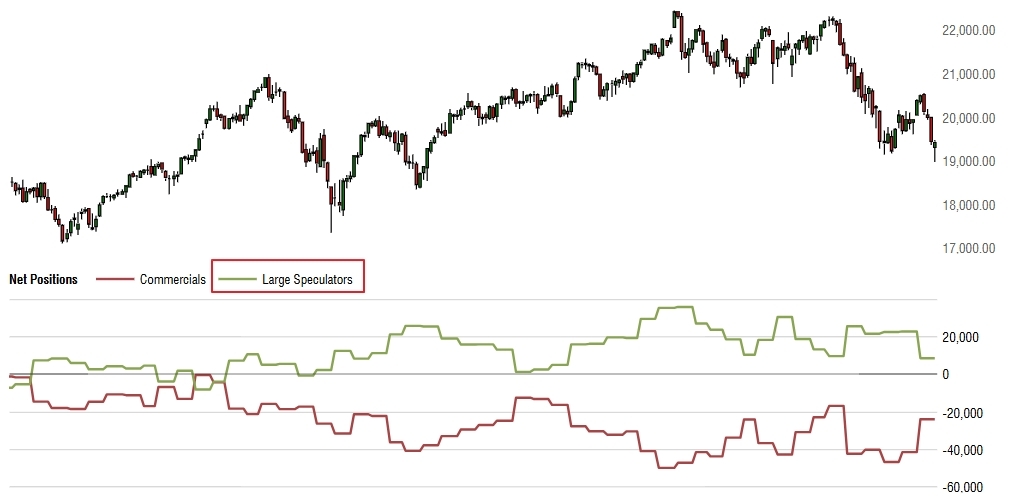
Latest COT Report Insights: The latest Commitments of Traders (COT) report indicates certain stability in the last week, after a substantial reduction in net long positions by institutional investors (large speculators) in March. This implies a lack of confidence in initiating buy positions within the current market environment. cotbase.com
Technical Analysis | US100, H4:
- Supply Zones (Sell): 19663.58 // 19805.77 // 19894.21
- Demand Zone (Buy): 19058.07
The break of the key H4 resistance at 20258.73 on March 26 turned out to be a bull trap or false breakout, followed by a sharp decline on March 27 and 28, decisively breaking the last key H4 support of the upward correction at 19414.89.
The weekly opening left an uncovered Point of Control (POC) at 19058.07, a local demand zone that initiated buying from Monday. As long as the price remains above this level, a broader corrective upward movement is possible, targeting 19415 or 19663, from where selling opportunities may be reconsidered.
If the price decisively breaks through the supply block between 19665 and 19894, a recovery and potential breakout of the 20022.44 resistance in the coming days could be considered. However, the fundamental market scenario does not support optimism for a bullish outlook; rather, it is more likely that the price will prematurely fall below 19058 without extending the correction, than to see a recovery above selling blocks in the current environment.
Technical Summary:
- Bearish Scenario: Sell positions below 19058 with take-profit targets at 18810, 18700, 18500, and 18312 in extension.
- Corrective Bullish Scenario: Buy positions above 19200 with take-profit targets at 19414 or 19663 in extension, from where selling may resume.
Exhaustion/Reversal Pattern (ERP): Before entering any trade in the key zones indicated, always wait for the formation and confirmation of an ERP on the M5 timeframe.
Uncovered POC: Point of Control (POC) refers to the level or zone where the highest concentration of volume occurred. If a downward movement followed from this point, it is considered a selling zone and forms a resistance area. Conversely, if an upward impulse occurred, it is considered a buying zone, usually located at lows, thus forming support areas.
ISM Manufacturing Index Shows Sector Stalled in March, While Price Growth Surged
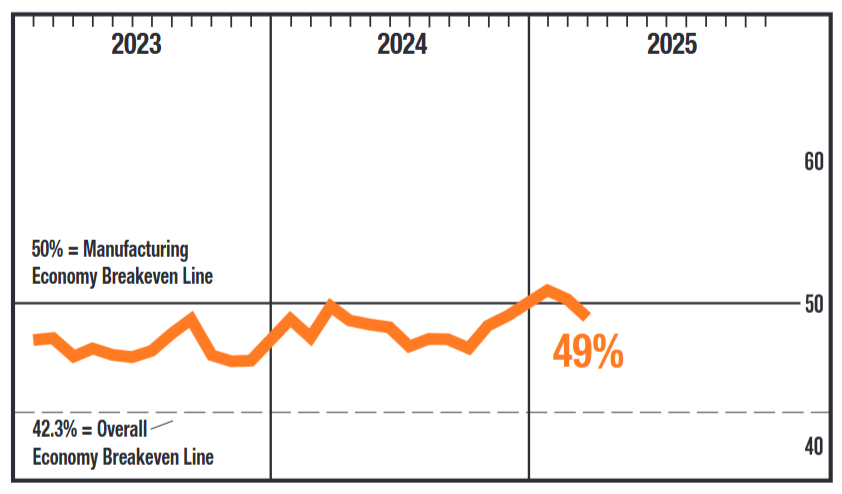
The ISM Manufacturing Index pulled back to 49.0 in March from 50.3 in January, and a smidge weaker than the 49.5 expected.
Nine of 18 industries reported growth for the month – down from ten in February. In another sign of slowing momentum, 46% of manufacturing GDP contracted in March, up from 24% in February and 43% in January.
Demand conditions deteriorated. The new orders index sank further into contraction (45.2, 48.6 in February), and new export order growth flipped into contraction (49.6 vs 51.4 in February). The backlog of orders shrank at a faster pace than in February (44.5 vs. 46.8).
The production index tumbled back into contraction, falling to 48.3 from 50.7. This is a notable development as it comes in a month where backlogs of orders shrank. Employment contracted at a faster pace than in February, falling to 44.7.
Price gains accelerated sharply again in March, as the index jumped to 69.4 (62.4 in February). The three-month change in the index (from 52.5 in Dec to 69.4 in March), is the steepest acceleration in price growth since March 2022. The prices index is at its highest level since June 2022.
Key Implications
Respondents are indicating that firms are stockpiling inventory ahead of potentially even greater tariffs. The worrisome factor is that this is coming at a time that demand is slowing down and could slip further as headwinds to the economy build. The support to demand from the inventory buildup could prove to be temporary. The jump in the prices paid index suggests cost pressures are picking up, leaving firms to decide how to manage the impact to their margins.
A look back at March gives some indication of how industry is adjusting to the new tariff regime, but what comes next is likely more important. Reciprocal tariffs are to be announced tomorrow and are expected to cover major U.S. trading partners. As we outlined in our quarterly forecast, we're in an assumptions-based forecasting world, where the scale of trade disruptions is a major variable in charting the course of the economy. So, the scope and timing of the tariffs coming tomorrow, and how countries respond, are going to be driving factors for the outlook. Stay tuned for updates.
Sunset Market Commentary
Markets
In ‘normal times’ the first (trading) day of a new month/quarter would make investors look out for high profile data to potentially set tone for upcoming trading trends. Also today, overall volatility stays elevated, but this for sure was/isn’t due to the data. All kinds of rumors and analysis on the US tariffs to be announced tomorrow in a White House Rose Garden event and strong wordings from EU Commission President von der Leyen on EU retaliation measures (cf infra) continue to haunt global markets. Core bond markets, alongside gold, continue to be main beneficiaries from safe haven flows. German yields are currently declining between 4.5 bps (2-y) and 7.5 bps (10-y). EMU March inflation data were close to/marginally softer than expected (headline 0.6% M/M and 2.2% Y/Y, core 2.4% from 2.6% vs 2.5% expected). It’s of course good news for the ECB that inflation eases as expected. Even so, in a long-term perspective, the March data probably won’t decide on the ECB monetary policy approach later this year. After yesterday’s ‘hesitation’ on the chances of an April cut, markets currently again discount about 80% of a 25 bps step in April. This in our view makes sense. Even as we are well aware that the trade conflict (amongst others) can take an unexpected turn, we are far less convinced that the ECB will be able to cut rates back to 2.0% (or even lower) as markets are currently again considering. The risk-off sentiment outweighs most other considerations, but technicals are also coming into play with the 2-year German yield revisiting the 2.0% support area and the 10-y near the 2.65 area (Mid-Jan Top, early March gap). US yields are easing between 0.6 bps (2-y) and 4.0 bps (30-y). The 2-y (3.87%) is holding within reach of the March correction lows (3.82 area). A break below would suggest the Fed taking action to support growth, which is far from evident given recent jump in survey inflation expectations. The decline in LT US yields is still mainly driven by a further decline in real yields (risk off and/or fears on faltering growth). After finishing this report, the US JOLTS job openings and US manufacturing ISM might given some indication on the state of the US economy going into the tariffs’ announcement. Even so, any reaction probably will tell at least as much on investor sentiment/market positioning than on the substance of the data. European equities (EuroStoxx50 +0.75%) are ‘capturing’ yesterday’s late-session WS rebound US indices are again losing ‘modest’ ground (S&P -0.4%). This very much looks like erratic trading in an highly uncertain context. On FX markets, the dollar slightly outperforms, with DXY trading near 104.3. However, the index still holds the rather tight sideways range in place since early March. The overall trend masks modest (daily) USD outperformance against the euro (EUR/USD 1.0795) but underperformance against the yen (USD/JPY 149.5). These cross rates also hold in a ST consolidation/wait-and-see modus. In in the outskirts of the EMU, a solid performance of the likes the Swiss Franc (EUR/CHF 0.953) and the Scandi currencies (EUR/SEK 10.82; EUR/NOK 11.31) is catching the eye.
News & Views
The EU is prepared to retaliate against potential US tariffs with measures targeting US services exports, including Big Tech companies. European Commission President Ursula von der Leyen emphasized the EU's readiness to negotiate from a position of strength and take firm countermeasures if necessary. Currently, the EU delayed extra duties of up to €26bn of US goods and didn’t respond to 25% tariffs on cars yet. Potential actions could include suspending intellectual property rights and excluding US companies from public procurement contracts. The bloc may also use the "anti-coercion" instrument for tougher measures. The EU aims to negotiate first to avoid escalating tariffs, which could harm both economies (fueling inflation, costing jobs and creating more bureaucracy via new custom procedures). The US has broader demands than tariff levels, including changes to EU tax rates and health standards, and the removal of digital taxes on US tech companies.
The Polish statistical office said that the government’s budget deficit widened from 5.3% of GDP in 2023 to 6.6% of GDP in 2024. In October, the Ministry of Finance estimated the gap at 5.7% of GDP. Finance minister Domanski said that accelerating the spending of funds to rebuild defense capabilities (according to the EU methodology), lower than expected consumption (higher savings) translating into lower VAT revenues and flood-related expenses are the main reasons for the higher deficit in 2024. Poland’s debt ratio rose from 49.5% of GDP in 2023 to 55.3% of GDP in 2024.
US ISM manufacturing falls to 49.0, prices surge
US ISM Manufacturing PMI fell back into contraction at 49.0 in March, missing expectations of 49.9 and down from February's 50.3.
The decline was led by a sharp drop in new orders, which slumped from 48.6 to 45.2 — their lowest level since May 2023 — and a pullback in production 50.7 to 48.3. Employment also remained under pressure, falling from 47.6 to 44.7, and continuing a trend of contraction seen in 28 of the past 35 months.
While overall activity softened, price pressures surged. The Prices Index jumped from 62.4 to 69.4, its highest reading since June 2022. Over the past six months, the index has climbed by more than 21 percentage points, signaling mounting cost pressures that could feed into broader inflation in the months ahead — especially in the context of tariff-related supply chain disruptions.
Despite the decline in PMI, ISM noted that the current level still aligns with a modest annualized GDP growth rate of 1.9%.
Euro Zone Inflation Drops to 4-Month Low, DAX Index Rises as Rate Cut Bets Intensify
- Euro Zone inflation dropped to a 4-month low of 2.2%, increasing bets on an ECB rate cut in April.
- Uncertainty surrounds the inflation outlook due to potential US tariffs and the EU's response.
- The DAX index faces a "precarious situation" technically, with potential for a correction ahead of tariff announcements. What is next for the DAX?
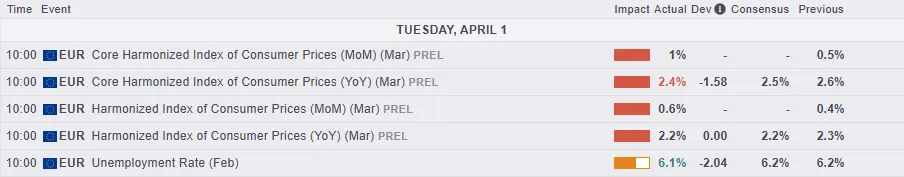
Inflation in the Euro Area dropped to 2.2% in March 2025, its lowest level since November 2024 and just below the expected 2.3%, according to early estimates.
Prices for services grew more slowly (3.4% compared to 3.7% in February), and energy costs fell (-0.7% compared to a 0.2% rise before). However, inflation stayed the same for non-energy goods (0.6%) and processed food, alcohol, and tobacco (2.6%), while unprocessed food prices jumped significantly (4.1% compared to 3.0%).
Core inflation, which excludes food and energy, also eased to 2.4%, slightly below the 2.5% forecast and its lowest since January 2022. Month-over-month, consumer prices increased by 0.6% in March, up from a 0.4% rise in February.
Inflation outlook moving forward
The short-term outlook for inflation is highly uncertain. US tariffs could lower eurozone inflation by reducing exports and slowing economic growth. These tariffs also increase the supply of goods in the eurozone as the US makes it harder to access their market. However, if the European Commission retaliates, it could push inflation higher since these measures act like a domestic tax that consumers will partly bear.
Last year in March, ECB President Lagarde hinted at potential rate cuts, saying, “we will know a little more in April and a lot more in June.” This year, by April, she’ll have much more clarity on US tariffs on European goods and the EU’s planned response, which will be discussed at the April ECB meeting. This will play a big role in deciding future interest rates.
One concern is that the job market is still very tight, with unemployment hitting a record low of 6.1% in February, according to Eurostat data released on Tuesday. For now, today’s lower-than-expected inflation supports the case for another rate cut to bring rates closer to neutral.
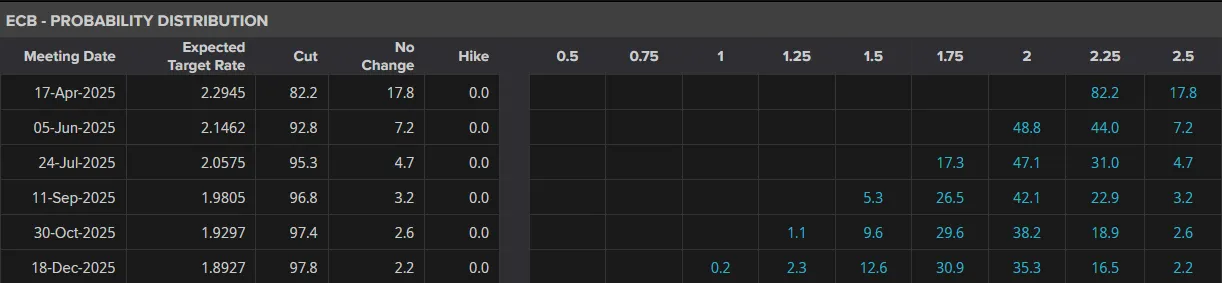
Markets are now pricing in around an 82% chance of a 25 bps rate cut at the ECB meeting on April 17.
ECB Interest Rate Expectations
Source: LSEG
Markets are now bracing for ‘liberation day’ tariffs from US President Donald Trump tomorrow.
On Monday, ECB President Christine Lagarde told France Inter radio that April 2, called “Liberation Day” by Trump, should be a time for everyone to work together to take “better control of our future” and move towards independence.
As for what to expect from the tariff announcement tomorrow, The Washington Post reported on Tuesday that White House staff have prepared a plan to introduce a 20% tariff on most goods imported into the U.S.
According to the report, President Donald Trump's team is considering using the massive revenue from these tariffs to provide tax refunds or dividends. Whether this will work is debatable given the history of tariffs and their impact on global markets.
Technical Analysis - DAX Index (DAX 40)
Looking at DAX from a technical standpoint, the index has enjoyed a stellar 2025 YTD.
However, recent technicals have suggested that a potential correction may be in the offing with a potential double top pattern forming at recent highs. A break of the neckline has yet to materialize however, and today's weaker inflation data has helped with that.
However, a daily candle close below the 22405 handle (neckline) could lead to an accelerated selloff in the DAX just as President Trump prepares his tariff announcements.
This leaves the DAX in a precarious situation at present, with immediate resistance resting at 22886, 23200 and of course the recent highs at 23454.
Immediate support rests at 22405, 21758 before the 200-day MA comes into focus at 21164.
DAX 40 Daily Chart, April 1, 2025
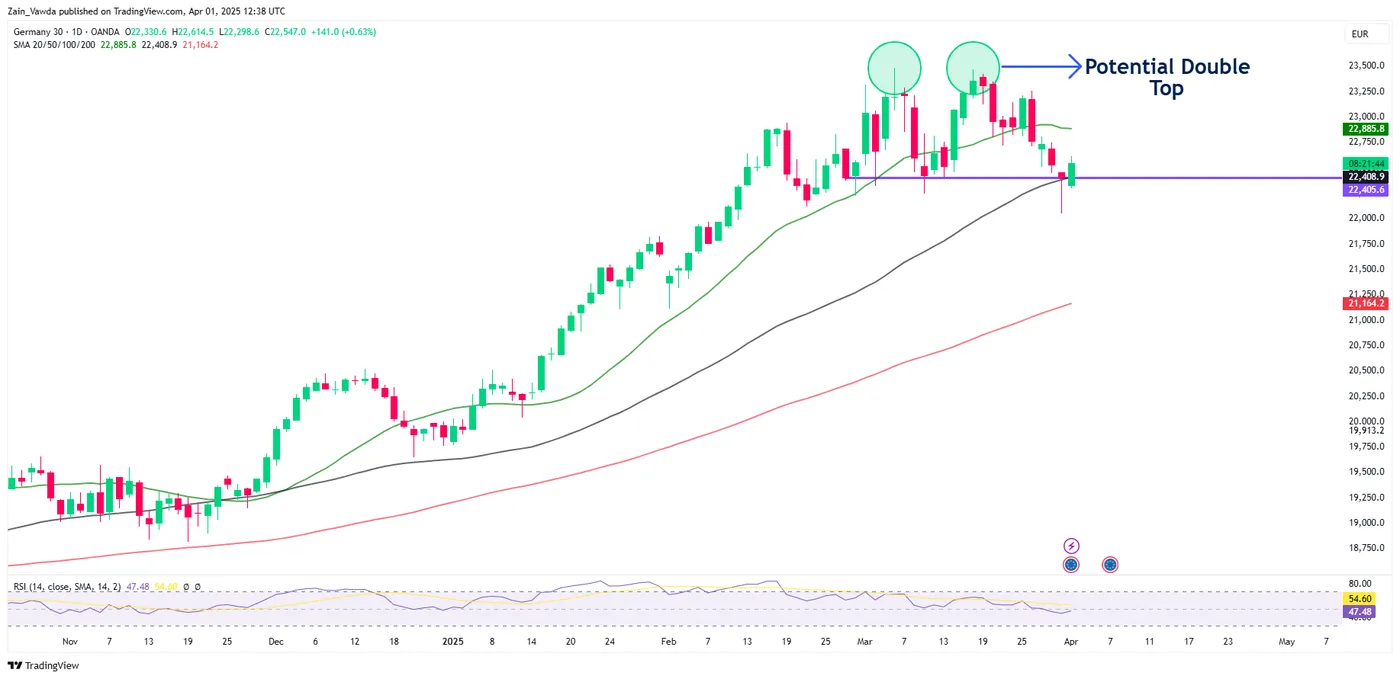
Source: TradingView.com
Support
- 22405
- 21758
- 21164
Resistance
- 22886
- 23200
- 23454
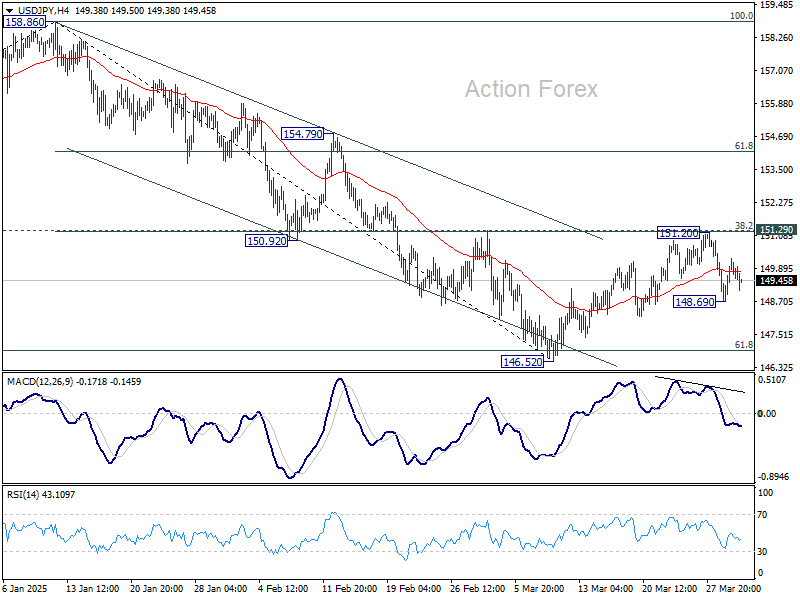
USD/JPY Mid-Day Outlook
Daily Pivots: (S1) 149.02; (P) 149.65; (R1) 150.59; More...
Intraday bias in USD/JPY remains neutral at this point. Outlook is unchanged that corrective rise from 146.52 has completed at 151.20. Risk will stay on the downside as long as 151.29 resistance holds. Below 148.69 will bring retest of 146.52 low first. Firm break there will resume whole decline from 158.86 towards 139.57 support next.
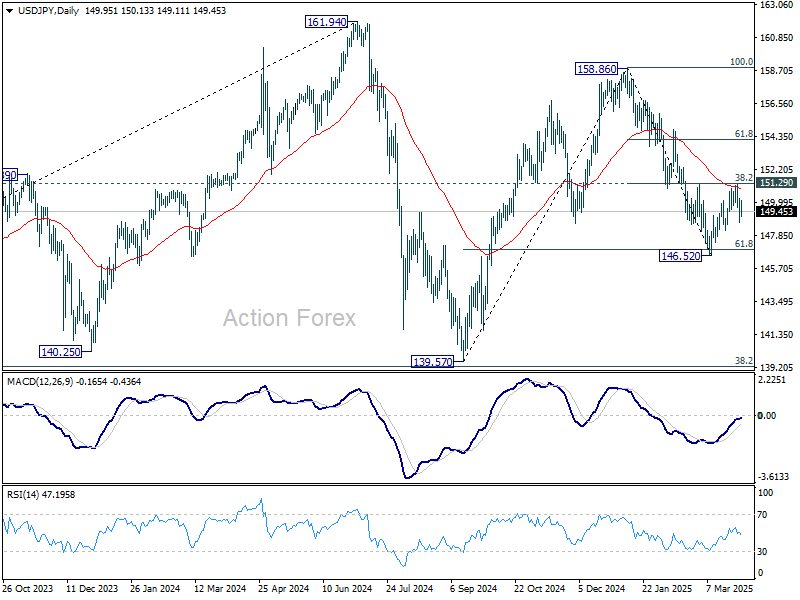
In the bigger picture, price actions from 161.94 are seen as a corrective pattern to rise from 102.58 (2021 low), with fall from 158.86 as the third leg. Strong support should be seen from 38.2% retracement of 102.58 to 161.94 at 139.26 to bring rebound. However, sustained break of 139.26 would open up deeper medium term decline to 61.8% retracement at 125.25.
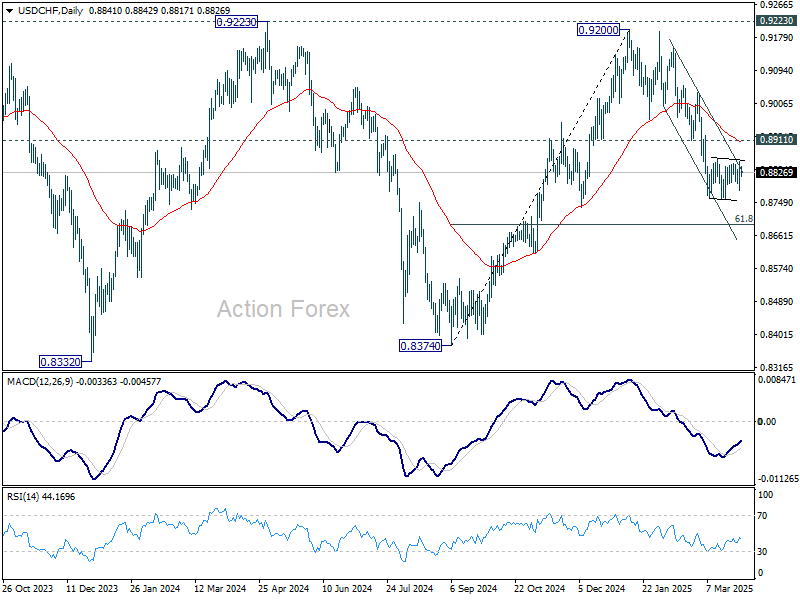
USD/CHF Mid-Day Outlook
Daily Pivots: (S1) 0.8798; (P) 0.8827; (R1) 0.8873; More…
Intraday bias in USD/CHF remains neutral as consolidation form 0.8757 is still extending. In case of stronger recovery, upside should be limited by 0.8911 support turned resistance. On the downside, break of 0.8757 will resume the fall from 0.9200 to 61.8% retracement of 0.8374 to 0.9200 at 0.8690. Sustained break there will pave the way back to 0.8374 support.
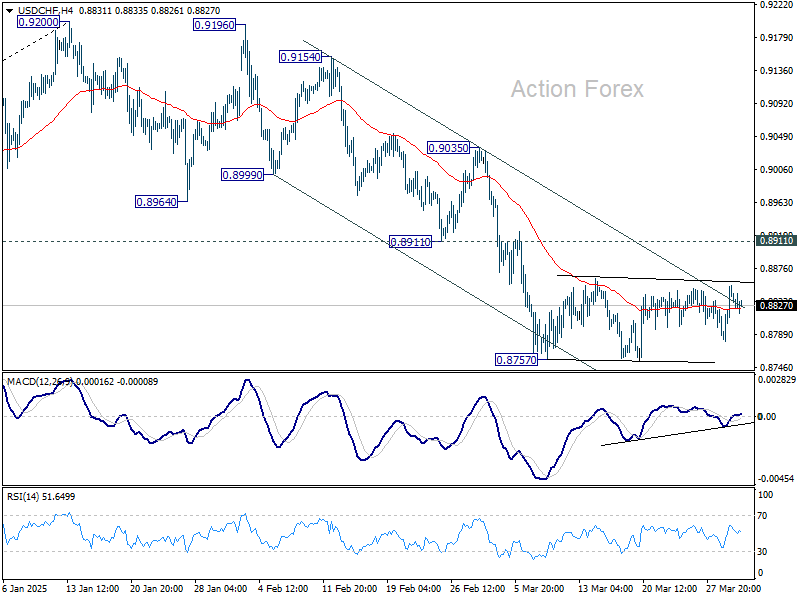
In the bigger picture, rejection by 0.9223 key resistance keep medium term outlook bearish. That is, larger fall from 1.0342 (2017 high) is not completed yet. Firm break of 0.8332 (2023 low) will confirm down trend resumption.