Sample Category Title
GBP/USD Eyes Fresh Gains While USD/CAD Dips
GBP/USD started a fresh increase above the 1.2900 zone. USD/CAD declined and now consolidates below the 1.4350 level.
Important Takeaways for GBP/USD and USD/CAD Analysis Today
- The British Pound is eyeing more gains above the 1.2970 resistance.
- There is a key bearish trend line forming with resistance at 1.2935 on the hourly chart of GBP/USD at FXOpen.
- USD/CAD started a fresh decline after it failed to clear the 1.4415 resistance.
- There was a break below a major bullish trend line with support at 1.4310 on the hourly chart at FXOpen.
GBP/USD Technical Analysis
On the hourly chart of GBP/USD at FXOpen, the pair formed a base above the 1.2870 level. The British Pound started a steady increase above the 1.2900 resistance zone against the US Dollar, as discussed in the previous analysis.
The pair surpassed the 50% Fib retracement level of the downward move from the 1.2972 swing high to the 1.2879 low. The pair is now consolidating near the 1.2925 zone and the 1.2420 level and the 50-hour simple moving average.
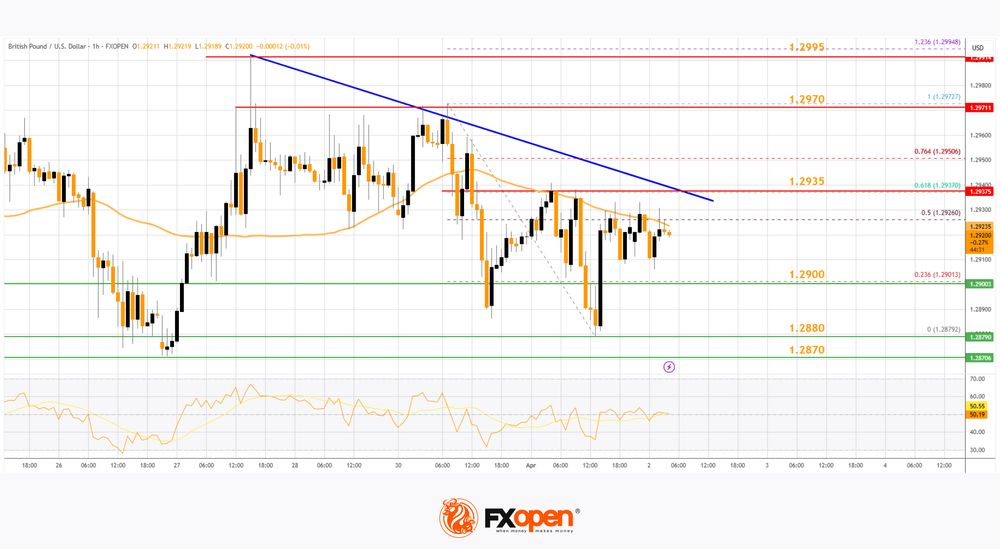
If there is another decline, the pair could find support near the 1.2900 level. The first major support sits near the 1.2880 zone. The next major support is 1.2870.
If there is a break below 1.2870, the pair could extend the decline. The next key support is near the 1.2820 level. Any more losses might call for a test of the 1.2800 support.
Conversely, the bulls might aim for more gains. The RSI moved above the 50 level on the GBP/USD chart and the pair is now approaching a major hurdle at 1.2935 and the 61.8% Fib retracement level of the downward move from the 1.2972 swing high to the 1.2879 low.
There is also a key bearish trend line forming with resistance at 1.2935. An upside break above the 1.2935 zone could send the pair toward 1.2970. Any more gains might open the doors for a test of 1.2995.
USD/CAD Technical Analysis
On the hourly chart of USD/CAD at FXOpen, the pair climbed toward the 1.4420 resistance zone before the bears appeared. The US Dollar formed a swing high near 1.4415 and recently declined below the 1.4350 support against the Canadian Dollar.
There was also a close below the 50-hour simple moving average and 1.4310. There was a break below a major bullish trend line with support at 1.4310.
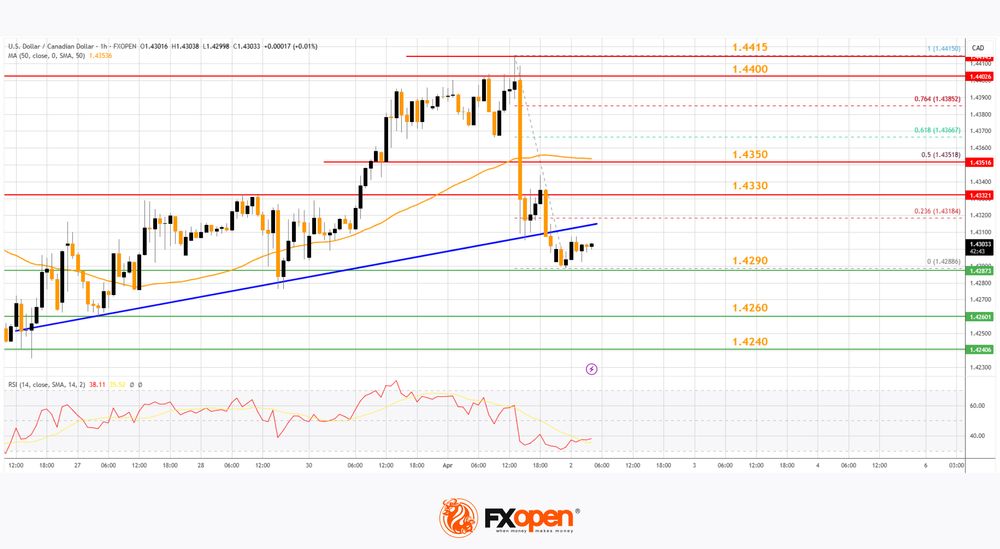
The bulls are now active near the 1.4300 level. The pair is now consolidating losses below the 23.6% Fib retracement level of the downward move from the 1.4415 swing high to the 1.4288 low. If there is a fresh increase, the pair could face resistance near the 1.4330 level.
The next key resistance on the USD/CAD chart is near the 1.4350 level and the 50% Fib retracement level of the downward move from the 1.4415 swing high to the 1.4288 low.
If there is an upside break above 1.4350, the pair could rise toward the 1.4400 resistance. The next major resistance is near the 1.4415 zone, above which it could rise steadily toward the 1.4450 resistance zone.
Immediate support is near the 1.4290 level. The first major support is near 1.4260. A close below the 1.4260 level might trigger a strong decline. In the stated case, USD/CAD might test 1.4240. Any more losses may possibly open the doors for a drop toward the 1.4400 support.
Trade over 50 forex markets 24 hours a day with FXOpen. Take advantage of low commissions, deep liquidity, and spreads from 0.0 pips. Open your FXOpen account now or learn more about trading forex with FXOpen.
This article represents the opinion of the Companies operating under the FXOpen brand only. It is not to be construed as an offer, solicitation, or recommendation with respect to products and services provided by the Companies operating under the FXOpen brand, nor is it to be considered financial advice.
Today’s (Thin) Eco Calendar Obviously Loses Relevance in Anticipation of Tariff Announcement
Markets
Markets remained hesitant throughout European dealings yesterday even as stock markets staged a(n initially) modest comeback. Core bonds continued to excel with April EMU CPI figures strengthening the case for a final 25 bps ECB rate cut (to 2.25%) on April 17 before installing a long pause. Headline and core inflation rose by 0.6% M/M and 1% M/M respectively to 2.2% Y/Y (from 2.3%) and 2.4% (from 2.6%). Numbers were in line or even slightly below consensus. The German yield curve bull flattened with daily changes ranging between -2.6 bps (2-yr) and -6.1 bps (30-yr). The German 10-yr yield tested 2.65% technical support for a second consecutive session. Early US data releases triggered an attempt to add to the risk-off climate, but that move was blocked. The US manufacturing ISM returned to contractionary levels in place since October 2022 after a brief spell of two months above the 50-threshold (49 from 50.3 vs 49.5 expected). Details have the stagflation mark all over them with the contraction in new orders (45.2 from 48.6) and jobs shedding (44.7 from 47.6) accelerating and price pressures mounting (prices paid: 69.4 from 62.4). Not the best start for turning the US back into a global manufacturing powerhouse. US JOLTS job openings fell slightly more than expected (7.57mn from 7.76mn), but hold relatively steady between 7mn and 8mn for already a year now. The US yield curve bull flattened as well with yields ending the day 0.2 bps (2-yr) to 4.7 bps (30-yr) lower. European and US equity markets rebounded slightly over (EU) or slightly under (US) 1%. EUR/USD remains stuck around the 1.08-handle.
Today’s (thin) eco calendar (US ADP employment change) obviously loses relevance in anticipation of the White House’s tariff announcement (event planned between 9-10 pm CET with tariffs said to go into effect immediately). A wait-and-see approach is expected. When it comes to the effective announcement, we think that the worse outcome (highest levels, broad application) might be the best from a market/risk point of view in the mid-to long-term. It reduces the likelihood of a new waiting game (uncertainty) in a step-up tariff approach and an high (tariff) bar can switch the market narrative into (hope) on an easing of protectionist measures in case of successful negotiations (on whatever subject) between nations involved. The immediate market response could still be an adverse one of course with (long-term) bonds at risk of selling off because of the highest impact on short-term inflation. Despite the correction of the past two weeks, we stick to our long term (bearish) curve steepeners. On FX markets, a (US) stagflation narrative so far tended to work in the USD’s disadvantage.
News & Views
South-Korean inflation unexpectedly reaccelerated in March. Headline inflation rose by 0.2% M/M and 2.1% Y/Y while a slowdown to 1.9% was expected. Core inflation (ex-food and energy also rose slightly to 1.9% from 1.8%. Food prices (0.6% M/M and 2.4% Y/Y) were an important driver behind the acceleration. In a monthly perspective prices of education rose by 1.1%. Restaurants/hotels and miscellaneous good and services added 0.4% M/M. Transportation costs declined (0.4% M/M). Service prices rose 2.3% Y/Y. Goods prices added 1.7%. The Bank of Korea further reduced its policy rate by 25 bps to 2.75% in February. Next meetings are scheduled for April 17 and May 29. The weak won is at least partially responsible for the easing of inflation to slow down. Today’s data reinforce the case for the Bank of Korea to take a wait-and-see modus at the April meeting. Later, the BoK can reassess whether there is room/need to further support the economy.
The Mexican government downwardly revised its growth forecast for this year to a range of 1.5%-2.3% down from a prior forecast of 2%-3%. The government indicates that the decline is due to economic uncertainty, weaker residential investment and supply shocks that have hit the economy. Business caution driven by uncertainty over US trade policy is also a contributing factor. The assessment of the government is still far more optimistic than private sector estimates and projections from the central bank. The latter sees 2025 growth at 0.6%. The government sees inflation at 3.5% at the end of the year before returning to the central bank target of 3.0% (+/- 1.0%) next year. The Mexican peso in April last year touched the strongest level against the dollar since 2015 (near USD/MXN 16.26), but currently trades near MXN/USD 20.35.
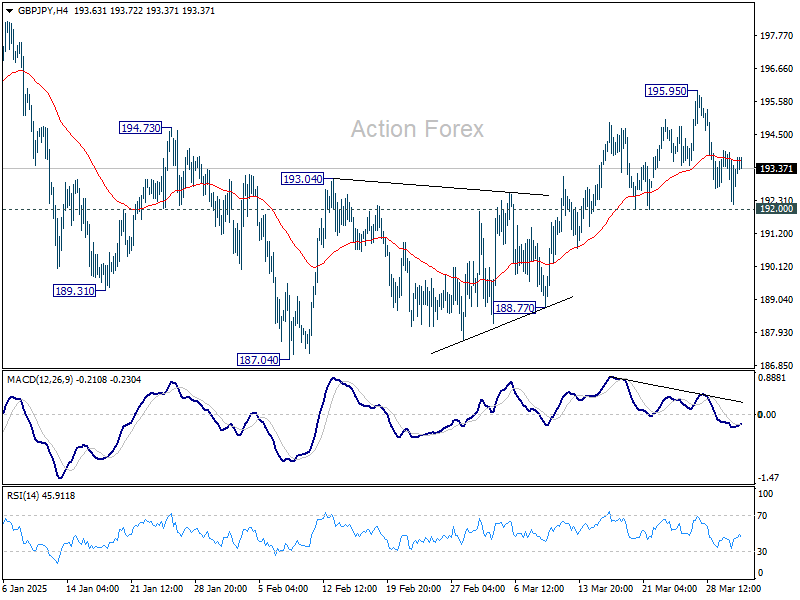
GBP/JPY Daily Outlook
Daily Pivots: (S1) 192.40; (P) 193.17; (R1) 194.13; More...
Intraday bias in GBP/JPY stays neutral as range trading continues. On the upside, break of 195.95 will extend the rally from 187.04 once again, to 198.94 resistance. However, firm break of 192.00 support will turn bias back to the downside for deeper fall. Overall, corrective pattern from 180.00 is still extending.
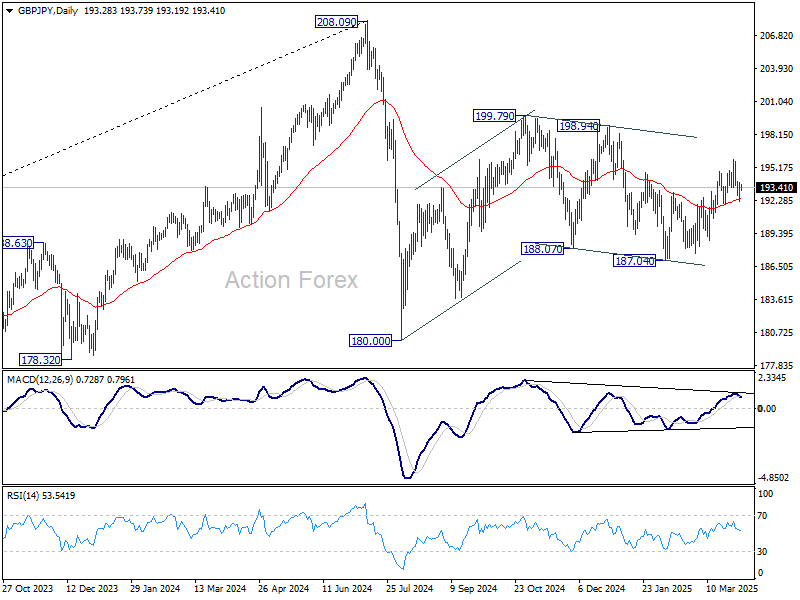
In the bigger picture, price actions from 208.09 are seen as a correction to rally from 123.94 (2020 low). Strong support should be seen from 38.2% retracement of 123.94 to 208.09 at 175.94 to contain downside. However, sustained break of 152.11 will bring deeper fall even still as a correction.
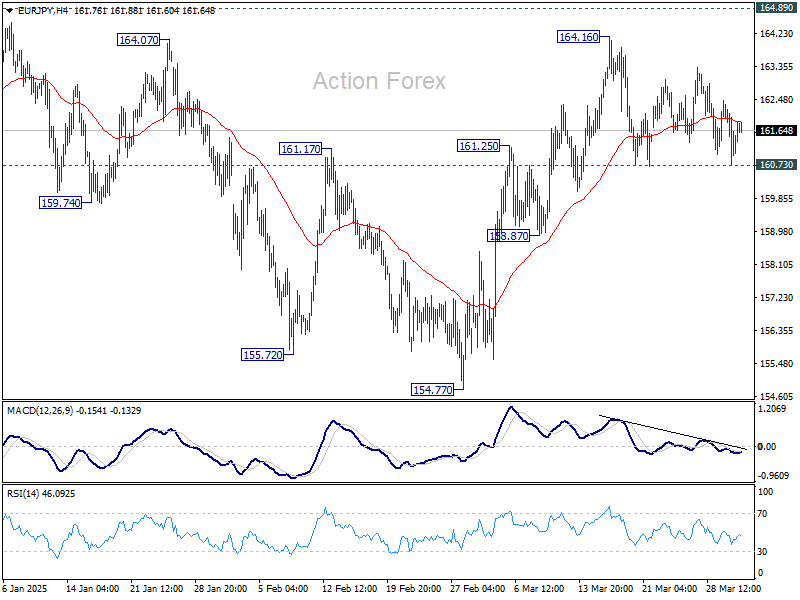
EUR/JPY Daily Outlook
Daily Pivots: (S1) 160.72; (P) 161.55; (R1) 162.33; More...
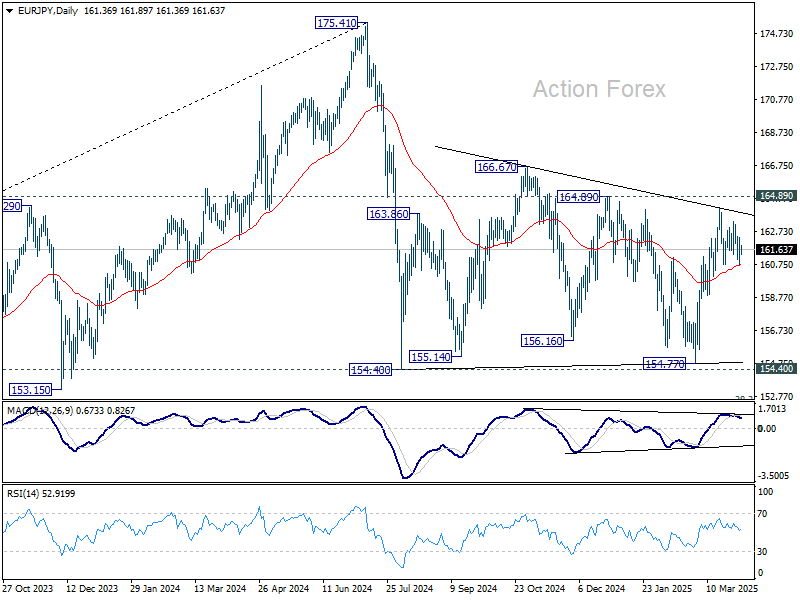
Intraday bias in EUR/JPY remains neutral for the moment. Further rise is in favor as long as 160.73 support holds. Above 164.16 will resume the rally from 154.77 to 164.89 resistance, and then 166.67. However, break of 160.73 will turn bias back to the downside for 158.87 support and below. Overall, sideway consolidation pattern from 154.40 is still extending.
In the bigger picture, price actions from 175.41 are seen as correction to rally from 114.42 (2020 low). Strong support should be seen from 38.2% retracement of 114.42 to 175.41 at 152.11 to contain downside. However, sustained break of 152.11 will bring deeper fall even still as a correction.
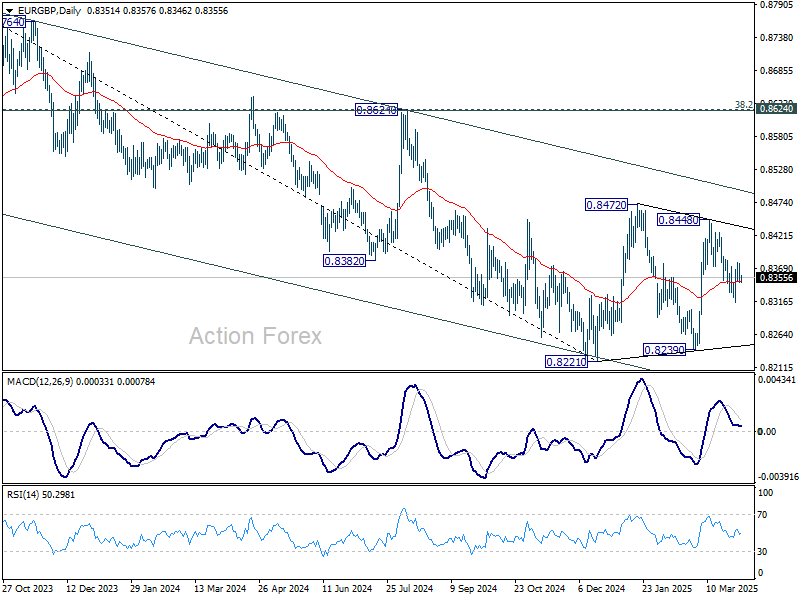
EUR/GBP Daily Outlook
Daily Pivots: (S1) 0.8341; (P) 0.8360; (R1) 0.8370; More...
Intraday bias in EUR/GBP remains neutral for the moment. With the near term falling channel intact, deeper fall is mildly in favor. Break of 0.8314 will resume the decline from 0.8448 towards 0.8239 support. Nevertheless, firm break of 0.8379 will argue that fall from 0.8448 is merely a correction and has completed. Retest of 0.8448 should be seen next.
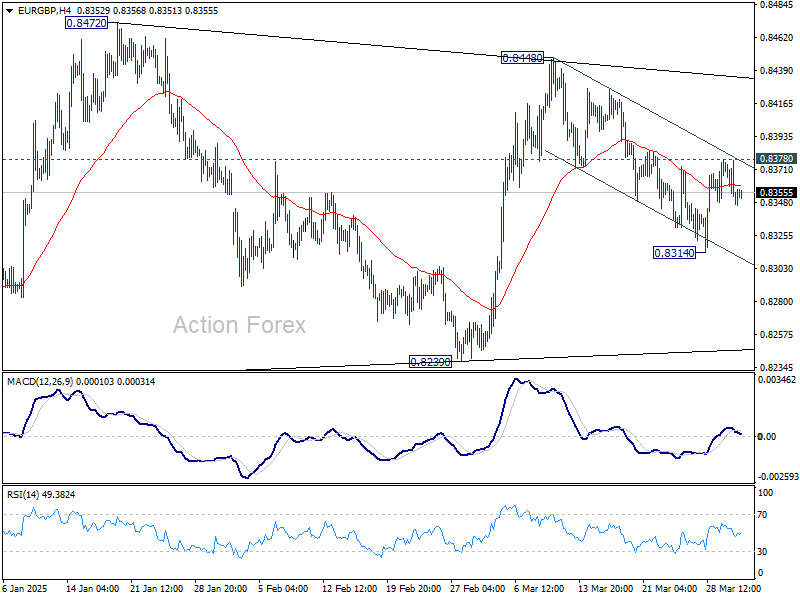
In the bigger picture, EUR/GBP is still bounded inside medium term falling channel. While rebound from 0.8221 might extend higher, it could still develop into a corrective pattern. Overall outlook will be neutral at best and down trend from 0.9267 (2022 high) could extend, at least until decisive break of channel resistance (now at 0.8495).
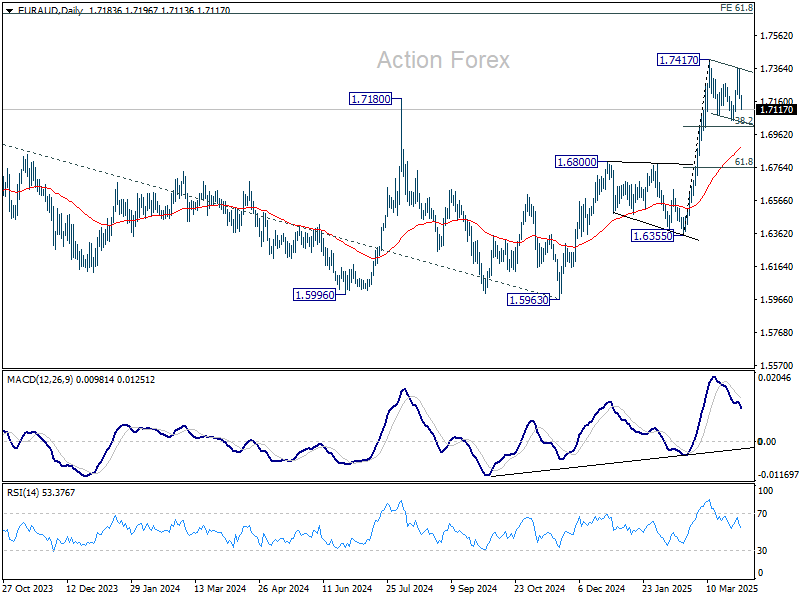
EUR/AUD Daily Outlook
Daily Pivots: (S1) 1.7129; (P) 1.7247; (R1) 1.7310; More...
Current steep decline suggests that corrective pattern from 1.7417 is extending with another falling leg. Intraday bias is turned neutral first. Downside should be contained by 38.2% retracement of 1.6355 to 1.7417 at 1.7011 to bring rebound. On the upside, break of 1.7364 will suggest that larger up trend is ready to resume. However, firm break of 1.7011 will bring deeper correction to 55 D EMA (now at 1.6888).
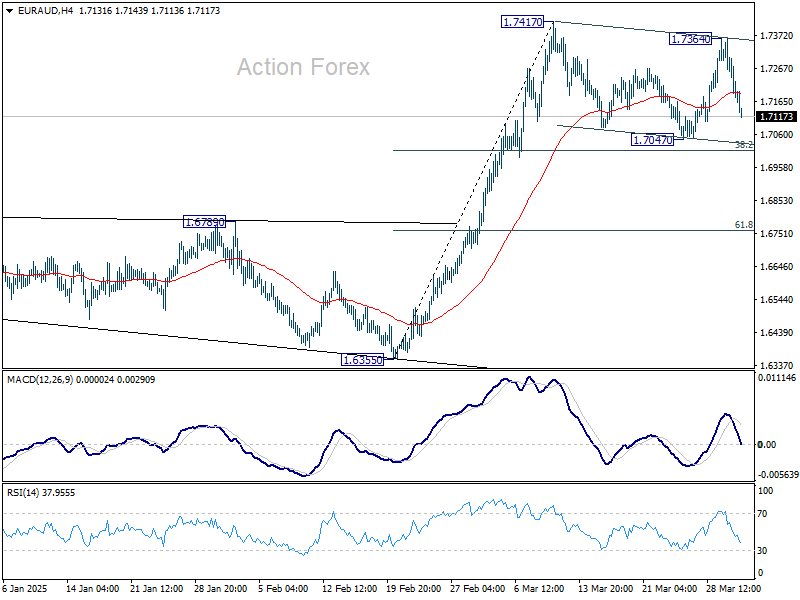
In the bigger picture, up trend from 1.4281 (2022 low) is resuming and should target 61.8% projection of 1.4281 to 1.7062 from 1.5963 at 1.7682, which is also close to 61.8% retracement of 1.9799 (2020 high) to 1.4281 at 1.7691. For now, this will remain the favored case as long as 1.6800 resistance turned support holds, even in case of deep pullback.
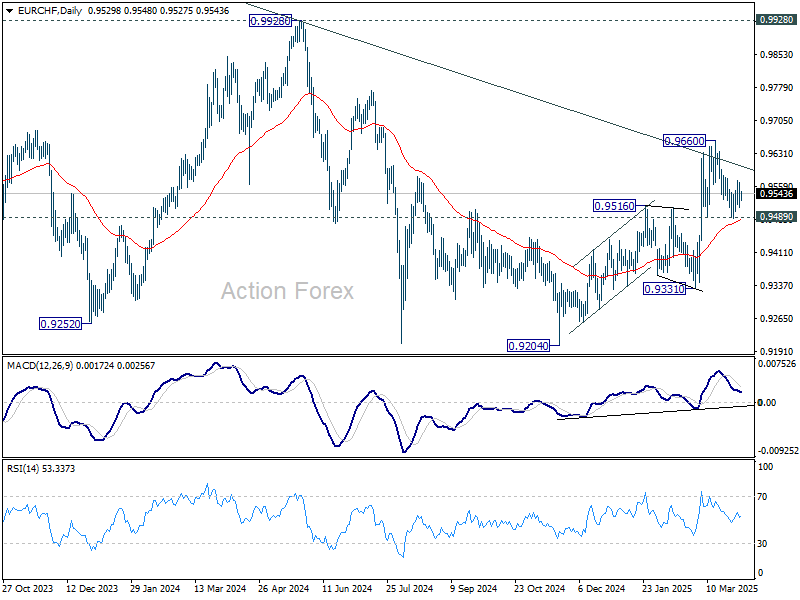
EUR/CHF Daily Outlook
Daily Pivots: (S1) 0.9507; (P) 0.9543; (R1) 0.9572; More....
Range trading continues in EUR/CHF and intraday bias stays neutral for the moment. For now, strong support is still expected from 0.9486 to complete the correction from 0.9660. On the upside, above 0.9581 minor resistance will bring retest of 0.9660 high. Firm break there will resume whole rise from 0.9204. However, sustained break of 0.9489 will dampen this view, and bring deeper fall back to 0.9331 support next.
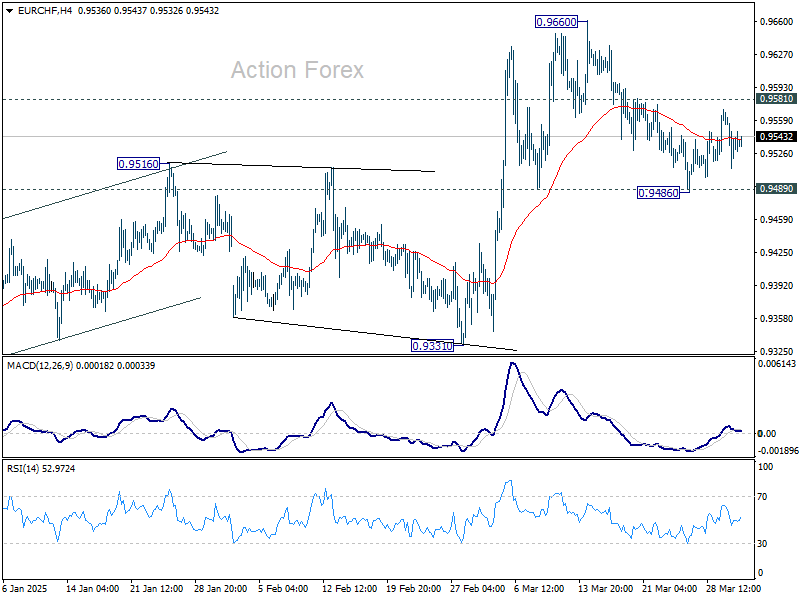
In the bigger picture, prior strong break of 55 W EMA (now at 0.9491) is a medium term bullish sign. Sustained break trading above long-term falling channel resistance (at around 0.9610) would suggest that the downtrend from 1.2004 (2018 high) has bottomed at 0.9204. Stronger rally should then be seen to 0.9928 key resistance at least.
Happy World Tariff Day
The much-expected US tariffs will be announced in a few hours and they will take immediate effect, according to the latest news.
Yesterday’s ISM data confirmed that the US manufacturing activity slowed, new orders tanked, employment softened while the prices-paid showed a steep jump – steeper than expected by analysts. The unideal data didn’t trigger a further selloff in US equities, however. On the contrary, the S&P500 ended a jiggly session 0.38% higher, as the yields retreated – meaning that investors put more weight on the rising recession bets than they did on the rising price pressures. And the latter improved the chances of seeing the Federal Reserve (Fed) give support more thoroughly than otherwise. The Fed is still expected to deliver its next rate cut in June – and not before – but things could change rapidly depending on how much Trump policies will hit the US economy. For now, the Atlanta Fed’s GDP Now index keeps plunging: the forecast tanked to -3.7% at the latest update.
Good news for investors is that an economic slowdown is not necessarily synonym of market selloff, as the Fed would step in by lowering rates and buying bonds to ensure financial stability. Inflation – on the other hand – is expected to be one-off and hopefully heal itself with economic slowdown. The problem is that the supply-side shocks tend to be inflationary – as we saw during the pandemic times. And the tariffs could disrupt the global supply chains and bring inflation back before giving the Fed time to reach its 2% target.
For now, investors show an increased appetite for bonds – and that despite the expectation of a further rise in global debt levels. As such, the US 10-year paper is amassing haven flows – the 10-year yield fell to as low as 4.13% yesterday from around 4.80% peak reached by mid-January. Similarly, the 10-year European government bond yields eased by almost 30bp since their mid-March peak. In equities, the European indices rebounded and the Stoxx 600 recovered by more than 1%. But the futures point at little appetite before the tariff announcement. The Nikkei remains under a decent pressure as the USDJPY consolidates below the 150 mark this morning.
It’s probably not the finale
Today’s tariff announcement could give a fresh direction to global markets, but it would be naive to think that today will mark the end of the tariff shenanigans. More likely, it marks the start of another phase of uncertainty and turmoil. The real risk isn’t just the tariffs themselves but the constant threat of escalation, reversals, and retaliation.
In the FX, the US dollar is slightly better bid, the euro and sterling are pressured on tariff uncertainty. Gold continues to be the safest play in town when it comes to the tariff uncertainty. Retaliation from US trade partners could bring the US dollar under a renewed selling pressure.
Liberation Day Has Come
In focus today
In the US, Donald Trump is widely expected to enact new broad-based tariffs with an expansion to measures against Canada and Mexico, while auto tariffs will wait until Thursday. The first reciprocal tariffs are also due to be announced today, with the latest news focusing on an announcement of alleged 20% tariffs on most goods imported to the US. Read more from Research US: Trump's 'Liberation Day' - What to expect?, 27 March. On the data front, ADP's March private sector employment report will provide markets with the first sense of what to expect from Friday's nonfarm payrolls.
In Denmark, statistics about Nationalbanken's currency interventions in March will be released. Given that the EUR/DKK remains close to the central rate, we expect Nationalbanken did not intervene in March. If this holds true, it will mark the 26th consecutive month without interventions from Nationalbanken.
In Poland, the Polish central bank announces its decision on the leading interest rate. We expect an unchanged policy rate at 5.75%, in line with consensus.
Economic and market news
What happened yesterday
In the US, ISM manufacturing activity index declined to 49.0 in March (cons. 49.5) from 50.3 in February. The index showed a sharp weakening in order-inventory balances, which is typically a negative signal for production going forward. Consequently, the employment index declined as well, while price pressures rose sharply (69.4 from 62.4). In the JOLTs report, voluntary layoffs declined, which is typically a sign of consumers' feeling less confident about their employment prospects. At the same time, involuntary layoffs increased, although in historical context their level is still modest.
In the euro area, HICP inflation declined to 2.2% y/y in March as expected from 2.3% y/y in February. Inflation in the first quarter of the year has thus averaged 2.3% y/y, which was what the ECB staff projections expected at the March meeting. The decline in March was due to energy and services inflation. In 2025 Q2, we expect inflation to average 2.2% y/y in line with the ECB staff projections and inflation markets pricing. The expected inflation developments support further easing from the ECB in our opinion.
In Denmark, the release of flash private sector earnings for Q1 indicated that nominal earnings rose by 4.4% y/y in Q1, down from 4.6% y/y in 2024 Q4. This nominal wage growth was in line with expectations and demonstrates a continuation of the trend of real wage growth, although at a slower pace than observed over the past year and a half.
In Sweden, the bargaining parties finally reached an agreement, with a cost benchmark of 6.4 percent over a 24-month period (3.4% year 1, 3.0% year 2). The agreement was well in line with our forecast (6.2% over 24-month period) and well in line with the Riksbank's forecast for wage increases. For monetary policy, this wage agreement should be neutral compared to expectations.
PMI for the manufacturing sector rose marginally to 53.6 in March from 53.5 last month. All subcomponents except for deliveries contributed on the upside (i.e. new orders, production, inventories, and employment). The reading was as expected, and in line with the readings over the past five months.
Equities: Equities rose yesterday, while bonds fell - what's not to like?
Well, firstly, the movements in equities did not accurately reflect the messages from key figures, particularly the ISM manufacturing print, in our view. An ultimate equity bull might argue that this is just a Goldilocks scenario, but that is far from the case, despite realised inflation data in Europe being even more benign than consensus expectations and very close to the 2% target.
The fact remains that key figures disappointed yesterday, and leading inflation data came in high. Additionally, we observed signs of frontloading and loss of confidence effects in manufacturing data, mostly related to areas where tariffs are already imposed, particularly Canada and Mexico. Meanwhile, Chinese data, on the flipside, was the positive surprise yesterday. In other words, equity investors were hoping for a less severe outcome of "Liberation Day" today rather than focusing on much else. More interestingly, emerging markets and Europe outperformed the US, both in macroeconomic and financial market terms. This further fuels the argument that US tariffs are affecting the US most significantly, and the notion of US exceptionalism is best paused with Trump or, at "worst", ending.
In the US yesterday: Dow -0.03%, S&P 500 +0.4%, Nasdaq +0.9%, and Russell 2000 +0.02%.
Asian markets are in a waiting position this morning, treading water ahead of the tariff announcement later today in the US.
European and US futures are slightly lower this morning.
FI&FX:
Donald Trump's 'Liberation Day' is here, and markets are awaiting clarity on the tariff announcements scheduled for 3PM ET / 9PM CEST / 10PM EEST. US equities closed Tuesday in green with SPX +0.4% and Nasdaq +0.9%. Bonds performed as well amid soft US data, and the US 10y yield was off 10bps from Monday's high. EUR/USD continues to gyrate around 1.08 while the JPY gained marginally vs the USD, though still just below 150. SEK and NOK firmed vs the EUR, where EUR/NOK at 11.29 is not far from last summer's lows. EUR/SEK is back at 11.80. EUR/DKK rose to the highest level since early February yesterday to around 7.4620. The zloty awaits the rate decision from NBP where unchanged at 5.75% is widely expected.
EUR/USD Daily Outlook
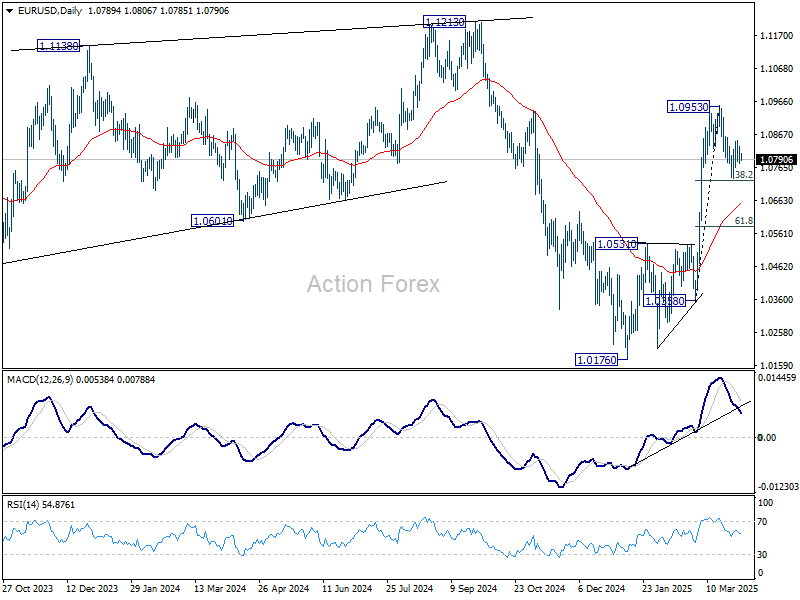
Daily Pivots: (S1) 1.0770; (P) 1.0800; (R1) 1.0822; More...
Intraday bias in EUR/USD remains neutral for the moment. On the upside, break of 1.0857 resistance will indicate that correction from 1.0963 has completed already. Retest of 1.0953 should be seen first. Firm break there will resume the rally from 1.0176 towards 1.1274 key resistance. However, firm break of 38.2% retracement of 1.0358 to 1.0953 at 1.0726 will bring deeper correction to 55 D EMA (now at 1.0650).
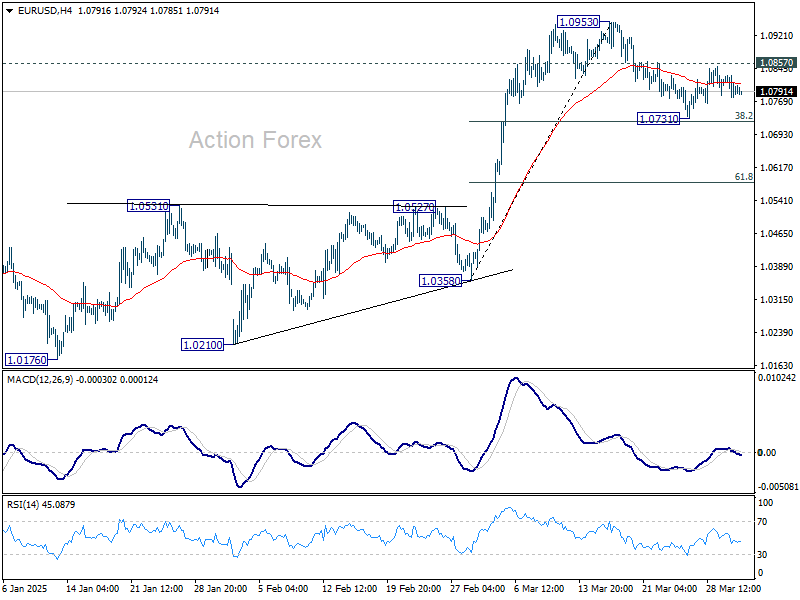
In the bigger picture, prior strong break of 55 W EMA (now at 1.0692) suggests that fall from 1.1274 (2024 high) has completed as a three wave correction to 1.0176. Rise from 0.9534 is still intact, and might be ready to resume. Decisive break of 1.1274 will target 100% projection of 0.9534 to 1.1274 from 1.0176 at 1.1916. Also, that will send EUR/USD through a multi-decade channel resistance will carries larger bullish implication. This will now be the favored case as long as 1.0531 resistance turned support holds.