Sample Category Title
NZ ANZ business confidence dips to 57.5, rising inflation expectations stir doubts over RBNZ cuts
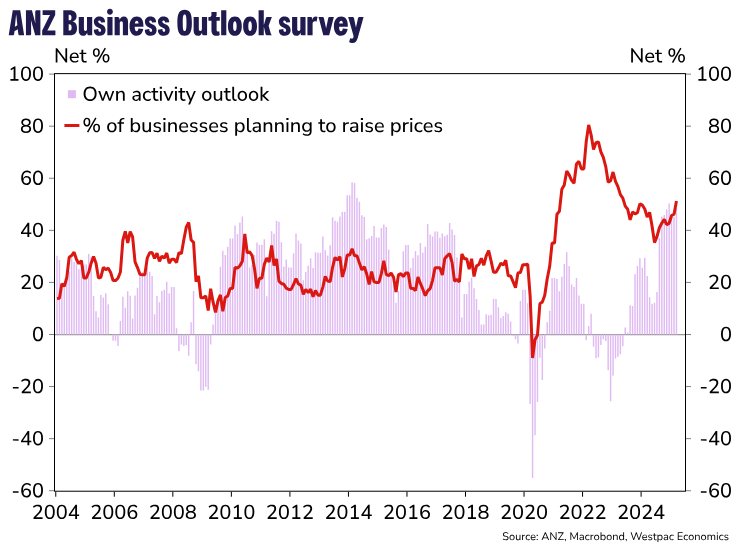
New Zealand’s ANZ Business Confidence dipped slightly from 58.4 to 57.5 in March. Own Activity Outlook improved from 45.1 to 48.6.
However, the data also brought a clear warning on inflationary pressures. Cost expectations surged from 71.3 to 74.1, the highest level in a year. Pricing intentions climbed from 46.2 to 51.3, marking the strongest since May 2023.
Perhaps more importantly, one-year inflation expectations also ticked up from 2.53% to 2.63%, inching further above the RBNZ’s 2% midpoint target.
ANZ flagged the rising inflation signals as “a little disconcerting,” cautioning that these developments could influence how enthusiastic RBNZ will be about delivering further rate cuts.
A rate cut at the April meeting appears locked in, and a second in May is viewed as likely. However, ANZ noted that the odds of a third cut in July are now “more of a coin toss.”
Japan’s industrial production beats with 2.5% mom growth in Feb
Japan's industrial production rose 2.5% mom in February, beating market expectations of 1.9% mom gain. The strong growth was driven by key tech-related sectors, with chipmaking machinery output jumping 8.2% and electronic parts and devices surging 10.1%.
A survey by Ministry of Economy, Trade and Industry projects continued, albeit modest, gains in output of 0.6% mom in March and 0.1% mom in April.
While the headline data is encouraging, the METI acknowledged that the outlook could quickly shift. Though no direct production impact from the proposed US tariffs has been reported yet, METI emphasized the need to monitor the situation more closely going forward.
On the consumer side, retail sales grew just 1.4% yoy, missing expectations of a 2.4% rise.
EUR/USD Regains Momentum—Will Buyers Push It Higher?
Key Highlights
- EUR/USD corrected gains and tested the 1.0735 support zone.
- It broke a key bearish trend line with resistance at 1.0805 on the 4-hour chart.
- GBP/USD started a consolidation phase above the 1.2880 support.
- Gold prices rallied further above the $3,080 level.
EUR/USD Technical Analysis
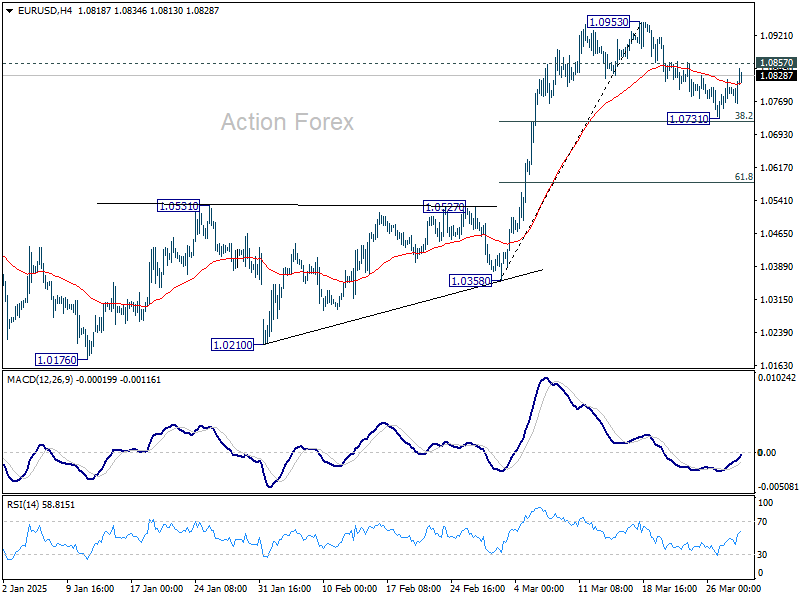
The Euro failed to continue higher above the 1.0950 resistance against the US Dollar. EUR/USD corrected gains and tested 1.0735 before the bulls appeared.
Looking at the 4-hour chart, the pair traded as low as 1.0732 and settled below the 100 simple moving average (red, 4-hour). However, it remained stable above the 200 simple moving average (green, 4-hour).
The pair is now forming a base and might attempt a fresh increase. It cleared a key bearish trend line with resistance at 1.0805 on the same chart.
On the upside, the pair is facing resistance near the 1.0850 level and the 100 simple moving average (red, 4-hour). The next major resistance is near the 1.0870 level. The main resistance is now forming near the 1.0900 zone.
A close above the 1.0900 level could set the tone for another increase. In the stated case, the pair could even clear the 1.0920 resistance.
On the downside, immediate support sits near the 1.0765 level. The next key support sits near the 1.0735 level. Any more losses could send the pair toward the 1.0680 level.
Looking at GBP/USD, the pair corrected gains, tested 1.2880, and might soon attempt a fresh increase in the near term.
Upcoming Economic Events:
- German Consumer Price Index for March 2025 (YoY) (Prelim) – Forecast +2.2%, versus +2.3% previous.
- Chicago Purchasing Managers Index for March 2025 – Forecast 45.4, versus 45.5 previous.
First Impressions: NZ Business Confidence
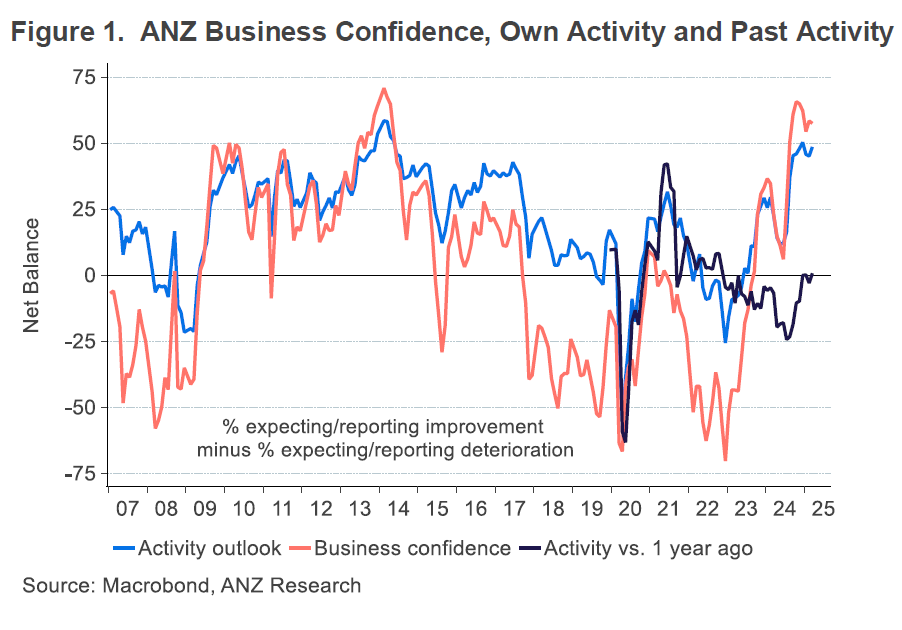
Business confidence remains high, but cost pressures are becoming more of a feature.
Key results, March 2025
- Business confidence: 57.5 (Prev: 58.4)
- Expectations for own trading activity: 48.6 (Prev: 45.1)
- Activity vs same month one year ago: 0.8 (Prev: -2.9)
- Inflation expectations: 2.63% (Prev: 2.53%)
- Pricing intentions: 51.3 (Prev: 46.2)
Business sentiment has remained upbeat in the early part of this year. The March ANZ business outlook survey saw marginal movements in the two headline measures – general confidence down slightly, firms’ own-activity expectations up – but with both remaining close to ten-year highs. Compared to a year earlier, a net 1% of firms reported that they were ahead, compared to a net 3% in February who felt they had gone backwards.
Notably, the inflation gauges of the survey are showing some signs of stirring. Firms’ reported costs have remained elevated since Covid, and they rose again in the March survey. Concerns about the impact of the weaker New Zealand dollar on the cost of imported inputs may be a factor here. Perhaps more importantly, firms believe that they will be able to pass on these cost increases: pricing intentions have been drifting higher for several months, and they took a notable step higher in March.
Overall, the survey results are well aligned with our recently-refreshed economic forecasts for New Zealand. We expect the pickup in GDP since the last quarter of 2024 to continue, albeit not reaching above-trend growth rates until the second half of this year. Annual inflation is expected to pick up temporarily as a result of the weaker NZD, peaking at 2.6% at the end of this year, but otherwise remaining within the target range. In that light, the RBNZ is still likely to deliver the OCR cuts that it signalled for the April and May policy reviews, but beyond that point we don’t think there will be a compelling case for further cuts.
Markets Weekly Outlook – ‘Liberation Day’ Tariffs and Potential Impact
- Trump's "Liberation Day" tariffs are causing market uncertainty and stagflation fears.
- Gold prices rise to fresh all time highs, more to come?
- The US Dollar's performance hinges on the severity of upcoming tariff announcements.
- Next week's focus: US tariffs, jobs data, and global central bank decisions.
Week in review: Stagflation fears rise as markets await Trump ‘liberation day’ tariffs
Wall Street stocks fell sharply on Friday, with big losses in Amazon, Microsoft, and other tech giants. This happened after U.S. data raised concerns about slow economic growth and rising inflation, as the Trump administration increased tariffs.
The impact of Trumps tariffs on US stocks
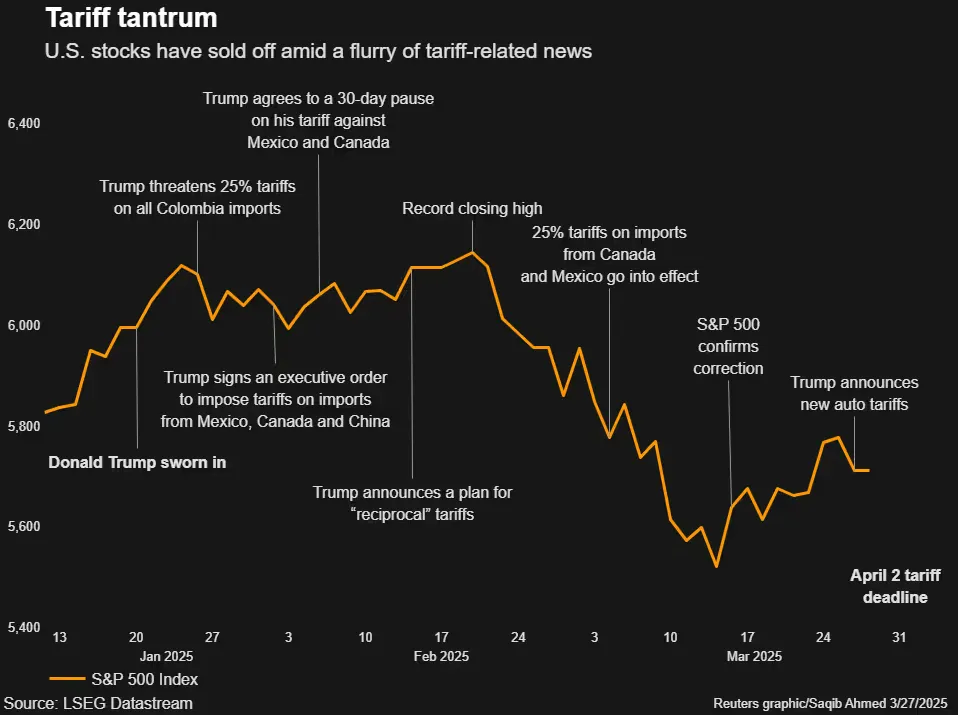
Source: LSEG
In February, U.S. consumer spending grew, but less than expected, while a key measure of prices saw its biggest jump in over a year.
A University of Michigan survey revealed that consumers' inflation expectations for the next year hit their highest level in almost 2.5 years in March. They also believe inflation will stay high beyond next year.
This has added to fears that President Trump's recent wave of tariff announcements since January will raise the cost of imported goods, push inflation higher, and stop the Federal Reserve from lowering interest rates.
With Friday's losses, the S&P 500 is down about 9% from its record high close on February 19. The Nasdaq is down around 14% from its record high close on December 16.
On the FX front, the DXY failed to kick on following a positive start to the week and is on course to finish the week in the red. This saw a bounce for most US Dollar denominated currency pairs such as EUR/USD and GBP/USD. The question now will be whether ‘liberation day’ will sink or save the US Dollar.
Gold once again has been the major beneficiary from the uncertainty this week. Stagflation fears coupled with tariff uncertainty and geopolitical risk propelled the precious metal to fresh highs. This on the back of rising ETF demand and central bank buying begs the question, how far can the precious metal rise?
Oil prices fell on Friday over concerns that U.S. tariff wars might trigger a global recession. However, prices still rose for the second week in a row as the U.S. increased pressure on OPEC members Venezuela and Iran.
As things stand Brent is on course to finish the week around 1.13% up with technicals hinting at further gains in the week ahead. Of course this could be massively affected by tariff developments next week and one that I will be keeping an eye on.
On the crypto front, selling pressure has returned as market participants continue to de-risk as uncertainties rise. For a full breakdown on the current crypto landscape, please read GameStop & Bitcoin (BTC/USD): corporate adoption grows, following strategy's lead
The week ahead: Tariffs, tariffs and more tariffs
The upcoming week will focus on U.S. President Donald Trump's plans for new tariffs. Alongside this, markets will also watch U.S. jobs data, an Australian central bank meeting, and a key eurozone inflation report.
Asia Pacific Markets
The main focus this week in the Asia Pacific region will be tariff developments even though we have a slew of data releases.
Next week, in China the focus will be on new tariffs. President Trump’s “Liberation Day” announcement and the U.S. investigation into China’s imports under the Phase One Trade Agreement are key events. The investigation deadline is April 1, with results expected then or shortly after. While China isn’t the main target of new tariffs, the investigation could lead to further actions.
Trump’s TikTok ban moratorium ends on April 5, making next week important for this issue. He has hinted at reducing China tariffs to secure a TikTok deal, something which the Chinese so far do not seem likely to entertain..
On the data side, China’s official PMI (Monday) is expected to rise slightly to 50.4 from 50.2, while the Caixin PMI (Wednesday) may dip to 50.6 from 50.8. If correct, this could indicate tougher times for Chinese exporters.
In Japan, industrial production is expected to bounce back, likely due to increased auto production as manufacturers ramped up before new tariffs. However, the Tankan survey for large manufacturers is expected to drop due to tariff concerns, while the non-manufacturing survey may improve thanks to strong wage growth.
High food prices, especially for rice, are weighing on consumer spending. Retail sales and household spending for February are expected to show a decline.
The Reserve Bank of Australia is expected to keep interest rates unchanged on April 1. Even though February's inflation was weaker than expected, overall inflation for the first quarter likely rose slightly. High inflation and tariff risks are expected to stop the RBA from making consecutive rate cuts and thus a hold seems the likely outcome.
Europe + UK + US
In developed markets, the US, Europe and UK tariffs will dominate the headlines. As we have seen in recent weeks, tariffs have even overshadowed data releases and this is something which could continue next week.
The upcoming week will be busy. The 25% tariffs on foreign steel and aluminum now include autos, and on April 2nd, "Liberation Day," more tariffs will be announced on countries accused of "cheating" America. This could mean combined tariffs, like 50% on European autos (25% EU + 25% auto tariff).
These tariffs may raise prices for US consumers, reduce spending power, and hurt corporate profits, fueling fears of stagflation, which could harm jobs and asset prices. Fed Chair Powell speaks Friday, but he’s likely to stay neutral, focusing on future economic data to guide decisions.
I expect ISM business surveys to show negative reactions due to tariff concerns and market drops. The jobs report will be key, as we will get insights and gauge if hiring slowed further amid uncertainty and government layoffs.
In the Euro Area, the main focus will be Eurozone inflation for March which is expected to stay above 2%, with core inflation above 2.5%. Lower energy prices might slightly ease headline inflation, but upcoming inflation reports will draw more attention due to potential tariffs.
The UK catches a breather after a busy week which included the UK budget. A budget which could be described as ‘kicking the can down the road’ with spending set to increase in the short-term.
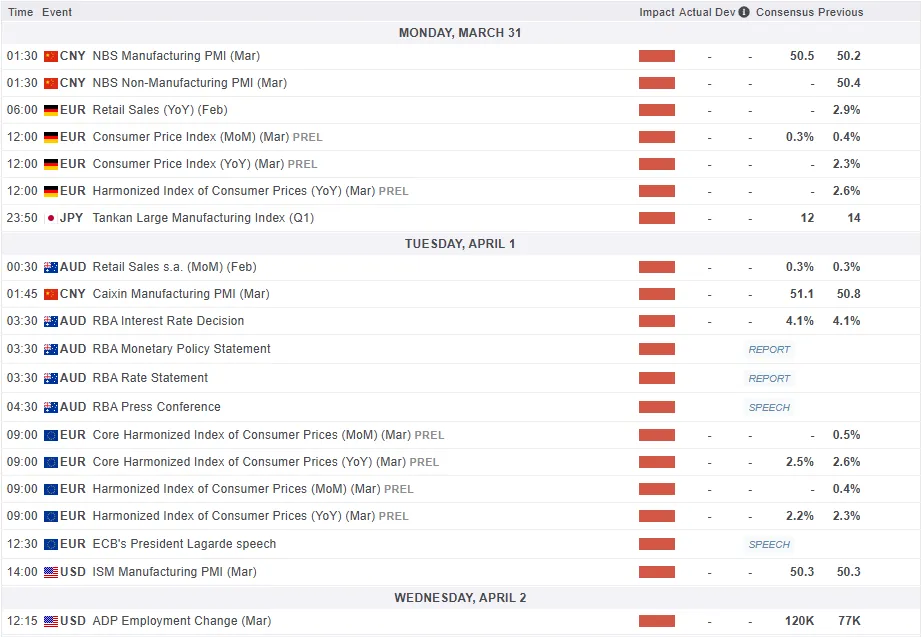
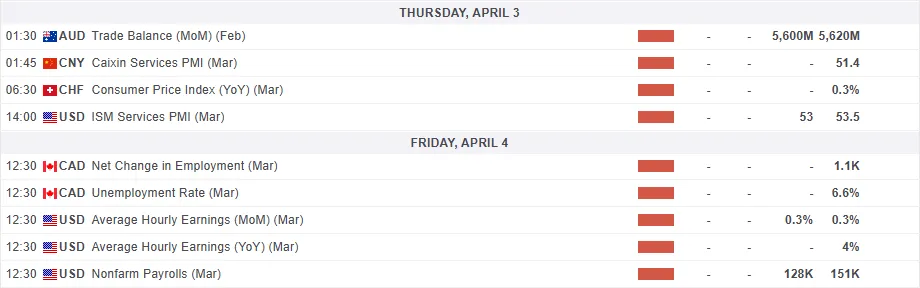
For all market-moving economic releases and events, see the MarketPulse Economic Calendar. (click to enlarge)
Chart of the Week - US Dollar Index (DXY)
This week's focus remains on the US Dollar Index as it looks to developments next week for guidance.
The DXY has pushed above the key resistance level at 104.00 with a weekly candle close and gains early in the week. However, a poor finish to the week on Thursday and Friday saw the index lose around 0.6%, leaving it in the red for the week and hovering at the 104.00 support handle.
The 14-period RSI did not even get to retest the neutral 50 level, declining from around the 47 mark which is a sign of strong bearish momentum still in play.
The next developments for the DXY will hinge on how tariffs shake up next week and how market participants perceive the developments.
If tariffs are less severe than anticipated, the DXY could rally and finally make its way toward the 200-day MA just shy of the 105.00 handle and beyond.
Aggressive tariffs and reciprocal tariffs could ratchet up tensions and weigh on the US Dollar and potentially send the index toward fresh lows below the 103.00 handle.
US Dollar Index (DXY) Daily Chart - March 28, 2025
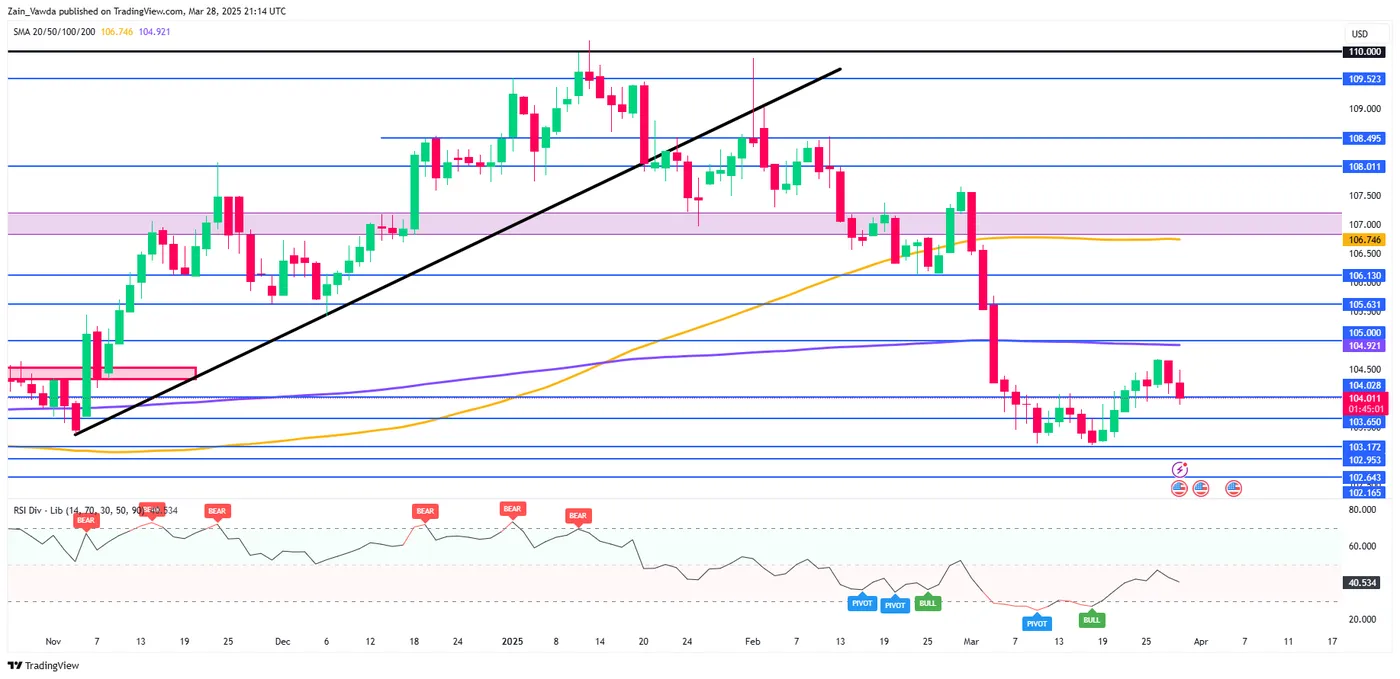
Source; TradingView
Key Levels to Consider:
Support
- 103.65
- 103.00
- 102.64
Resistance
- 104.50
- 105.00
- 105.63
Gold Wave Analysis
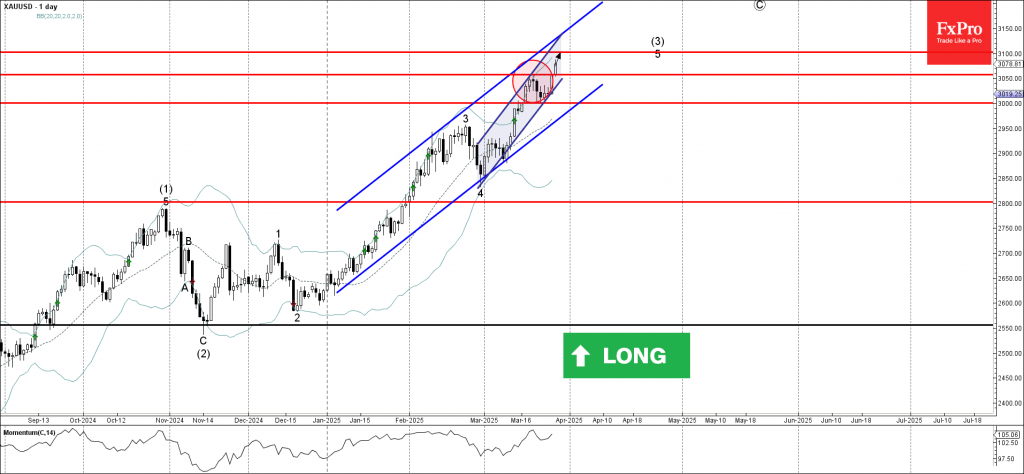
Gold: ⬆️ Buy
- Gold broke resistance level 3050.00
- Likely to rise to resistance level 3100.00
Gold rising steadily after breaking above the key resistance level 3050.00 (which reversed the price earlier this month).
The breakout of the resistance level 3050.00 accelerated the active impulse wave 5 of the higher impulse wave (3) from November.
Given the clear daily uptrend, Gold can be expected to rise to the next resistance level 3100.00 (target for the completion of the active impulse wave (3)).
Ethereum Wave Analysis
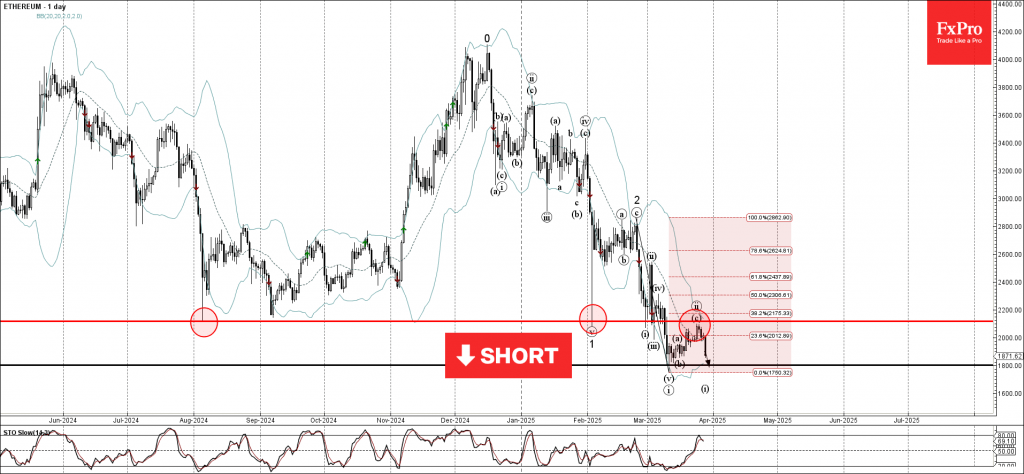
Ethereum: ⬇️ Sell
- Ethereum reversed from the resistance level 2120.00
- Likely to fall to support level 1800.00
Ethereum cryptocurrency recently reversed down from the resistance level 2120.00 (former multi-month support from August and February) standing near the 38.2% Fibonacci correction of the downward impulse from February.
The downward reversal from the resistance level 2120.00 stopped the previous ABC correction ii.
Given the strong daily downtrend, Ethereum cryptocurrency can be expected to fall to the next support level 1800.00 (which stopped the previous impulse wave i).
EUR/USD Weekly Outlook
EUR/USD gyrated lower last week but recovered ahead of 38.2% retracement of 1.0358 to 1.0953 at 1.0726 as expected. Initial bias stays neutral this week first. On the upside, break of 1.0857 minor resistance will suggest that correction from 1.0953 has completed already. Retest of 1.0953 should be seen first. Firm break there will resume the rally from 1.0176 towards 1.1274 key resistance.
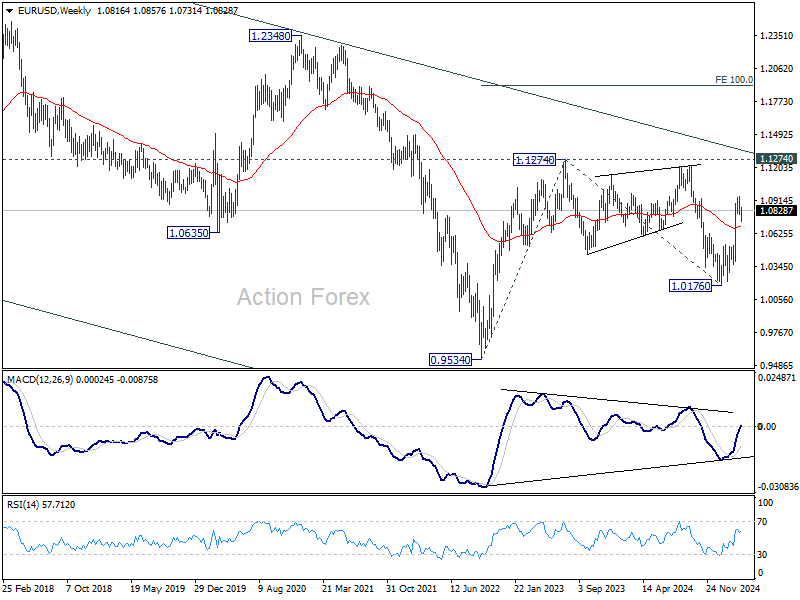
In the bigger picture, prior strong break of 55 W EMA (now at 1.0692) suggests that fall from 1.1274 (2024 high) has completed as a three wave correction to 1.0176. Rise from 0.9534 is still intact, and might be ready to resume. Decisive break of 1.1274 will target 100% projection of 0.9534 to 1.1274 from 1.0176 at 1.1916. Also, that will send EUR/USD through a multi-decade channel resistance will carries larger bullish implication. This will now be the favored case as long as 1.0531 resistance turned support holds.
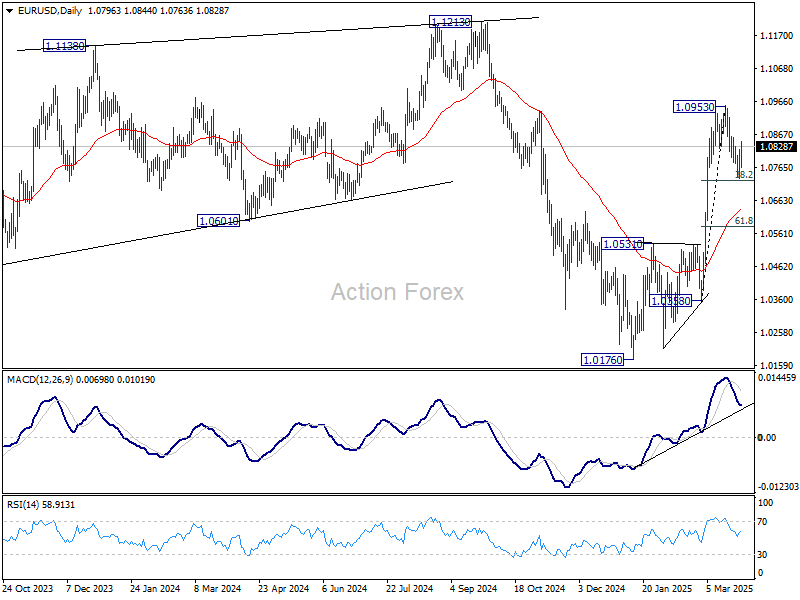
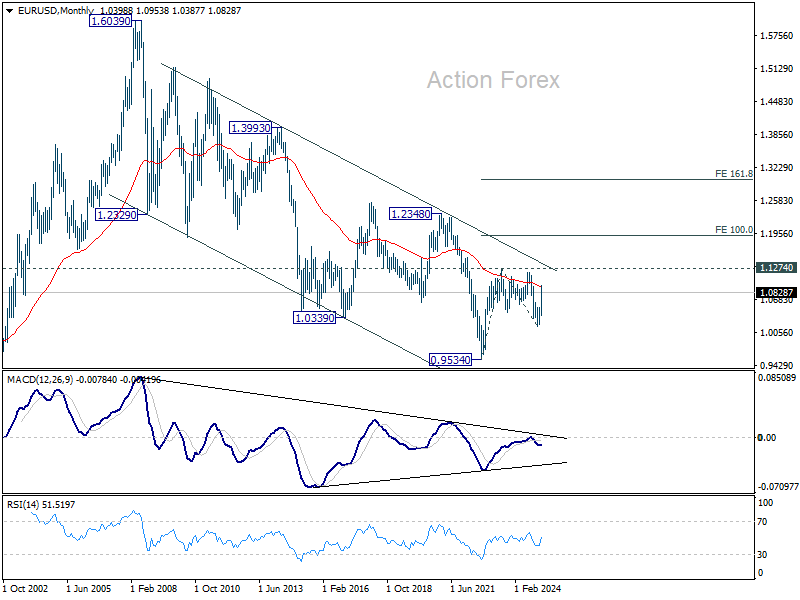
In the long term picture, the case of long term bullish reversal is building up. Sustained break of falling channel resistance (now at around 1.1377) will argue that the down trend from 1.6039 (2008 high) has completed at 0.9534. A medium term up trend should then follow even as a corrective move. Nevertheless, rejection by the channel resistance will keep outlook bearish.
USD/JPY Weekly Outlook
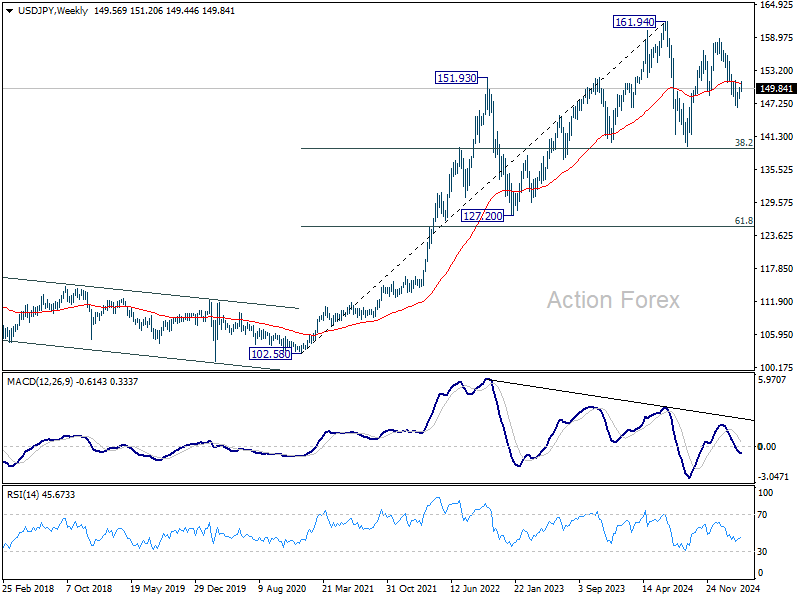
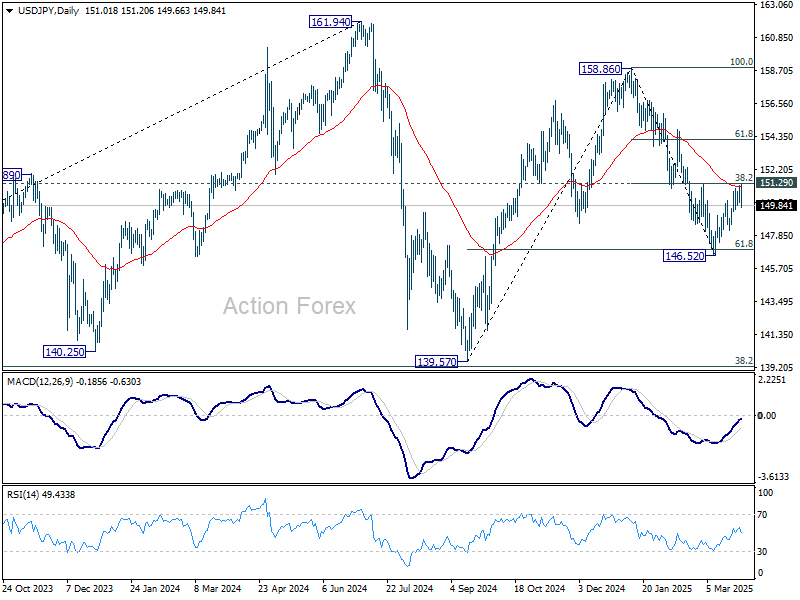
USD/JPY recovered further to 151.20 last week but retreated sharply ahead of 151.29 cluster resistance (38.2% retracement of 158.86 to 146.52 at 151.23). Initial bias remains neutral first and outlook stay bearish. On the downside, below 149.53 minor support will argue that the corrective recovery has completed and bring retest of 146.52 low. Firm break there will resume whole fall from 158.86. However, firm break of 151.23/9 will turn bias back to the upside for 154.79 resistance instead.
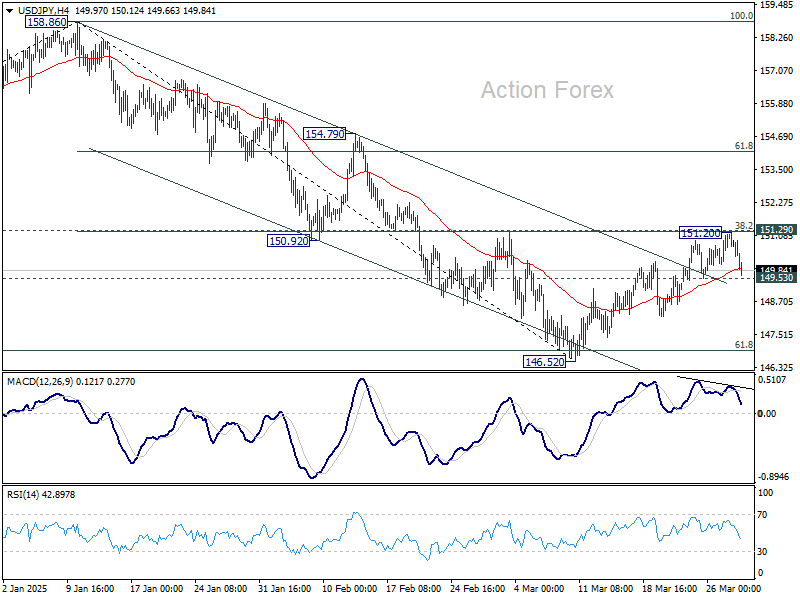
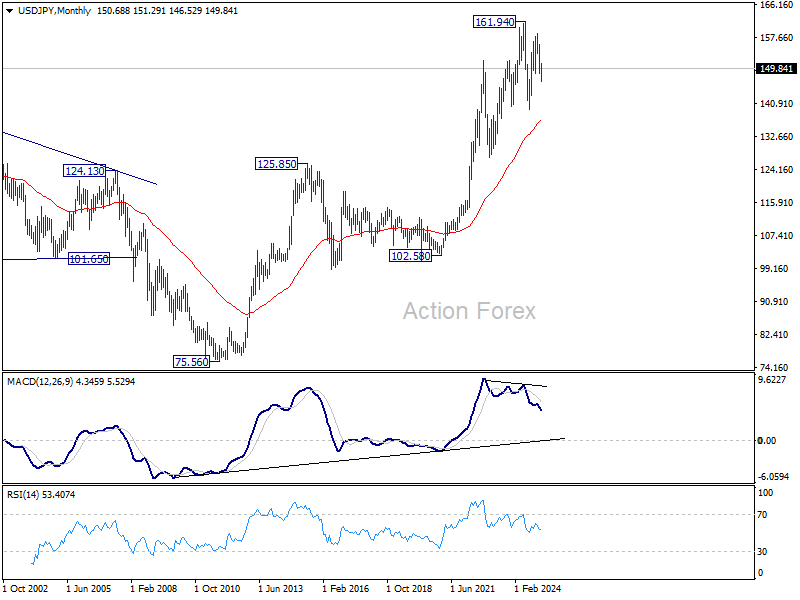
In the bigger picture, price actions from 161.94 are seen as a corrective pattern to rise from 102.58 (2021 low), with fall from 158.86 as the third leg. Strong support should be seen from 38.2% retracement of 102.58 to 161.94 at 139.26 to bring rebound. However, sustained break of 139.26 would open up deeper medium term decline to 61.8% retracement at 125.25.
In the long term picture, it's still early to conclude that up trend from 75.56 (2011 low) has completed. A medium term corrective phase should have commenced, with risk of deep correction towards 55 M EMA (now at 136.94).