Sample Category Title
GBP/USD Daily Outlook
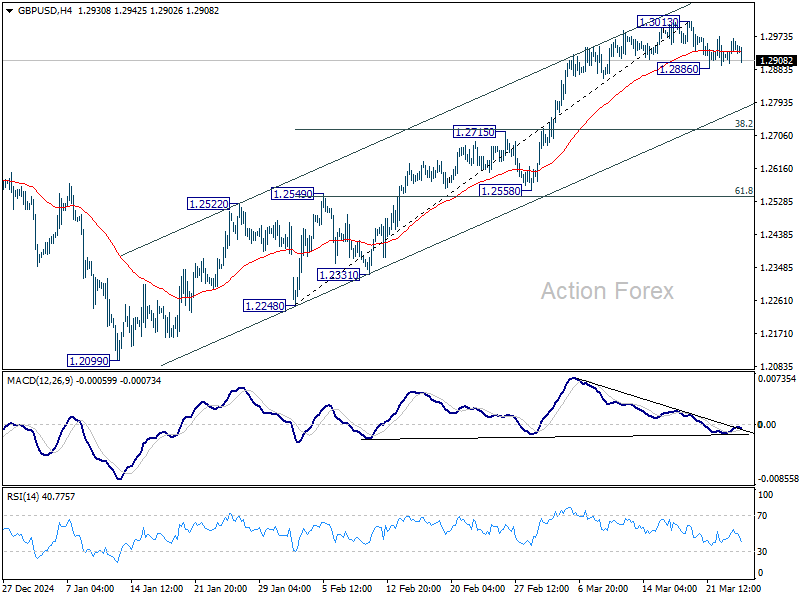
Daily Pivots: (S1) 1.2909; (P) 1.2938; (R1) 1.2974; More...
Intraday bias in GBP/USD remains neutral first. On the downside, break of 1.2886 will resume the correction from 1.3013 and turn bias to the downside. But downside should be contained by 38.2% retracement of 1.2248 to 1.3013 at 1.2721 to bring rebound. On the upside, break of 1.3013 will resume the rally from 1.2099.
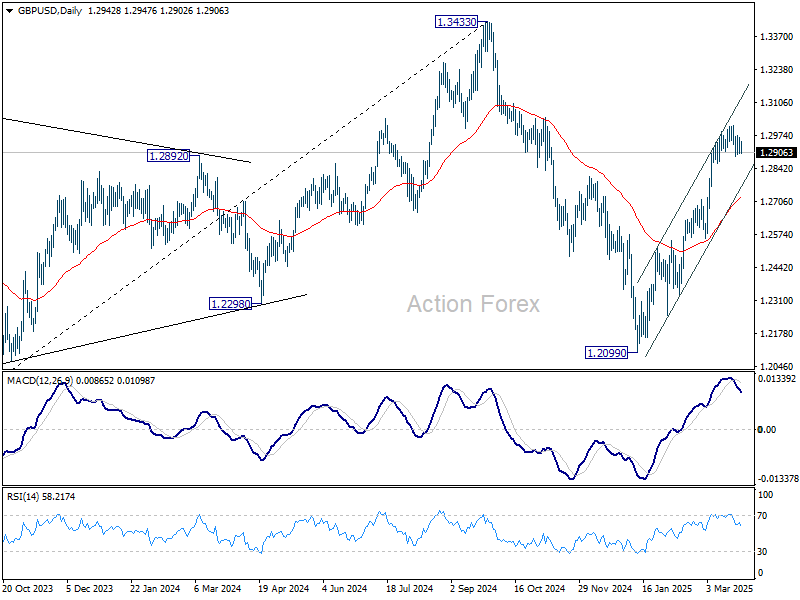
In the bigger picture, up trend from 1.3051 (2022 low) is not completed. Resumption is expected after corrective pattern from 1.3433 completes. Next target will be 1.4248 key resistance. This will now remain the favored case as long as 1.2099 support holds.
USD/CHF Daily Outlook
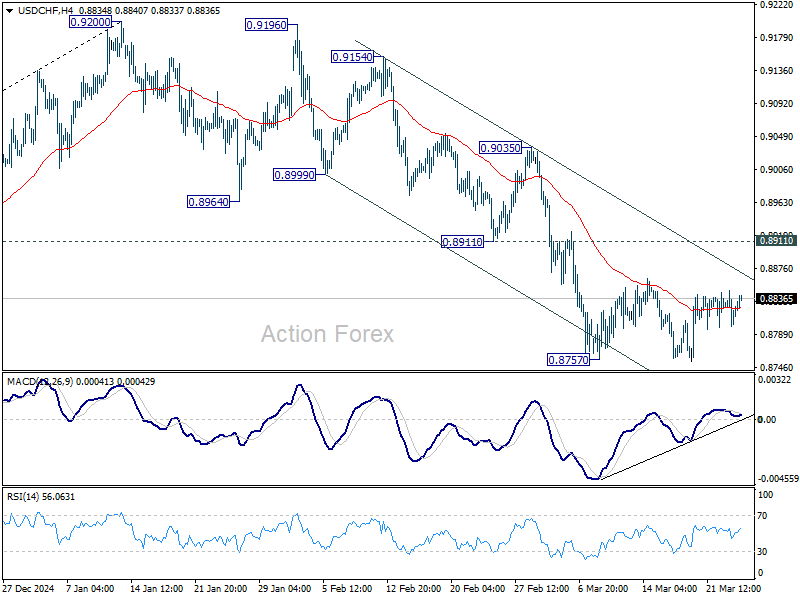
Daily Pivots: (S1) 0.8801; (P) 0.8825; (R1) 0.8850; More…
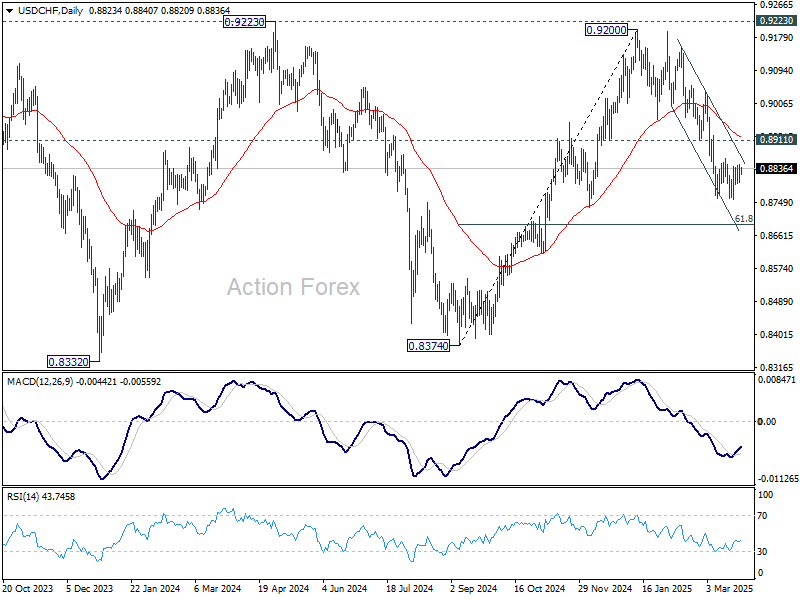
Intraday bias in USD/CHF remains neutral. Consolidation from 0.8757 is still in progress. In case of stronger recovery, upside should be limited by 0.8911 support turned resistance. On the downside, break of 0.8757 will resume the fall from 0.9200 to 61.8% retracement of 0.8374 to 0.9200 at 0.8690. Sustained break there will pave the way back to 0.8374 support.
In the bigger picture, rejection by 0.9223 key resistance keep medium term outlook bearish. That is, larger fall from 1.0342 (2017 high) is not completed yet. Firm break of 0.8332 (2023 low) will confirm down trend resumption.
AUD/USD Daily Report
Daily Pivots: (S1) 0.6278; (P) 0.6302; (R1) 0.6327; More...
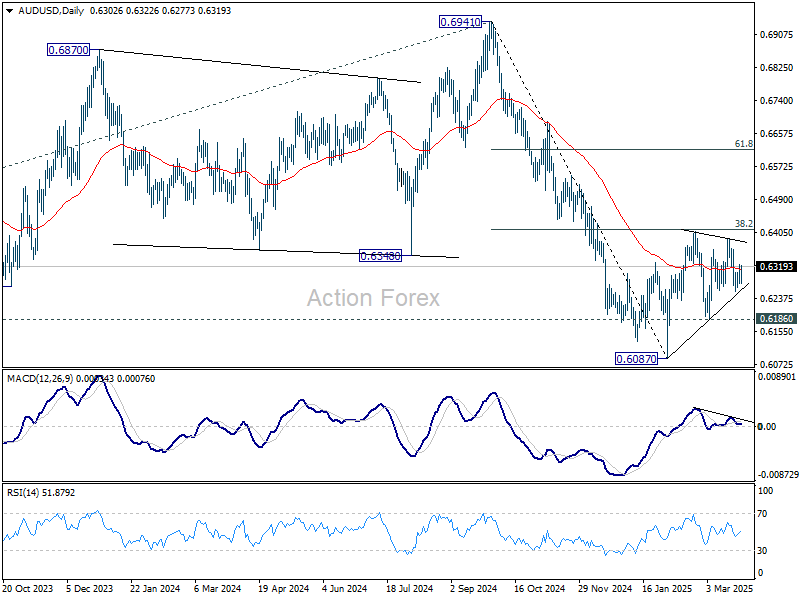
Intraday bias in AUD/USD remains neutral for the moment. On the downside, firm break of near term trend line support (now at 0.6262) will argue that corrective pattern from 0.6087 has already completed. Intraday bias will be back on the downside for 0.6186 support. Further break there will solidify this bearish case and target 0.6087 low. For now, in case of another rise, upside should be limited by 38.2% retracement of 0.6941 to 0.6087 at 0.6413.
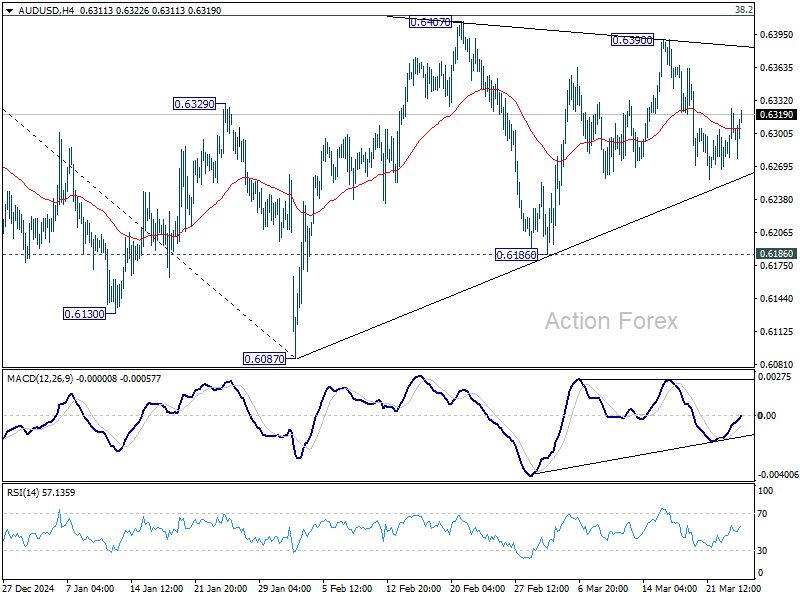
In the bigger picture, fall from 0.6941 (2024 high) is seen as part of the down trend from 0.8006 (2021 high). Next medium term target is 61.8% projection of 0.8006 to 0.6169 from 0.6941 at 0.5806. In any case, outlook will stay bearish as long as 55 W EMA (now at 0.6467) holds.
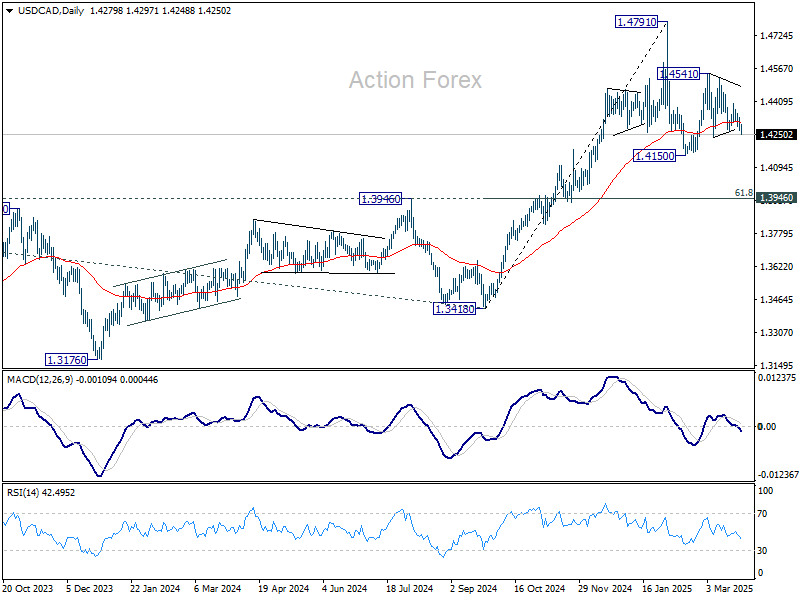
USD/CAD Daily Outlook
Daily Pivots: (S1) 1.4254; (P) 1.4294; (R1) 1.4316; More...
Intraday bias in USD/CAD is mildly on the downside with current fall. Break of 1.4238 support will argue that corrective pattern from 1.4791 has already started the third leg. Deeper decline should be seen to 1.4150 support next. On the upside, above 1.4400 resistance will turn intraday bias neutral again first.
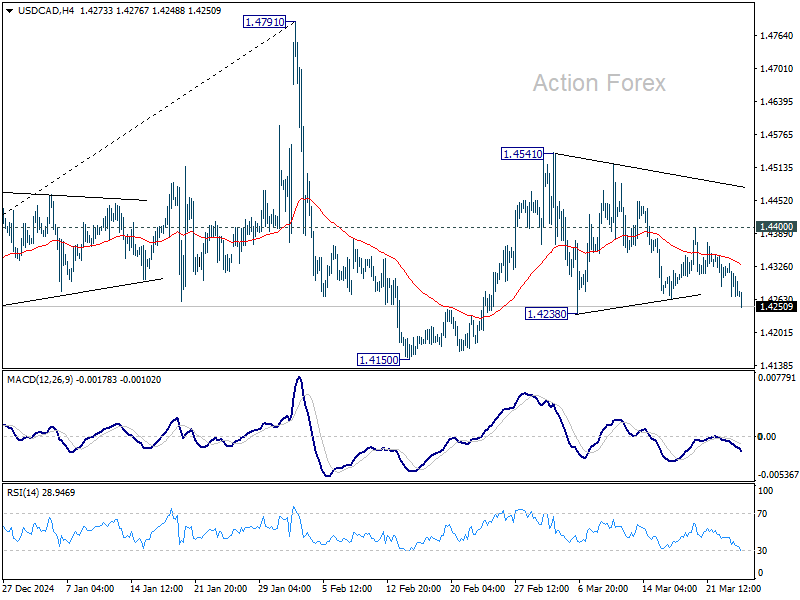
In the bigger picture, long term up trend is tentatively seen as resuming with prior breach of 1.4667/89 key resistance zone (2020/2015 highs). Next target is 100% projection of 1.2401 to 1.3976 from 1.3418 at 1.4993. This will remain the favored case as long as 1.3976 resistance turned support holds (2022 high), even in case of deep pullback.
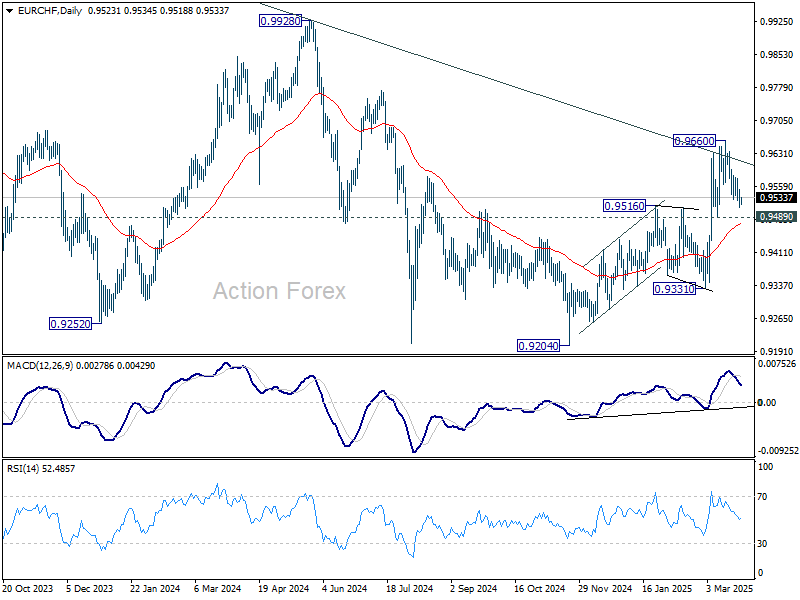
EUR/CHF Daily Outlook
Daily Pivots: (S1) 0.9508; (P) 0.9531; (R1) 0.9549; More....
Intraday bias in EUR/CHF remains neutral for the moment. While pull back from 0.9660 might extend lower, further rally is expected as long as 0.9489 support holds. On the upside, above 0.9581 minor resistance will bring retest of 0.9660 first. Further break there will resume whole rise from 0.9204.
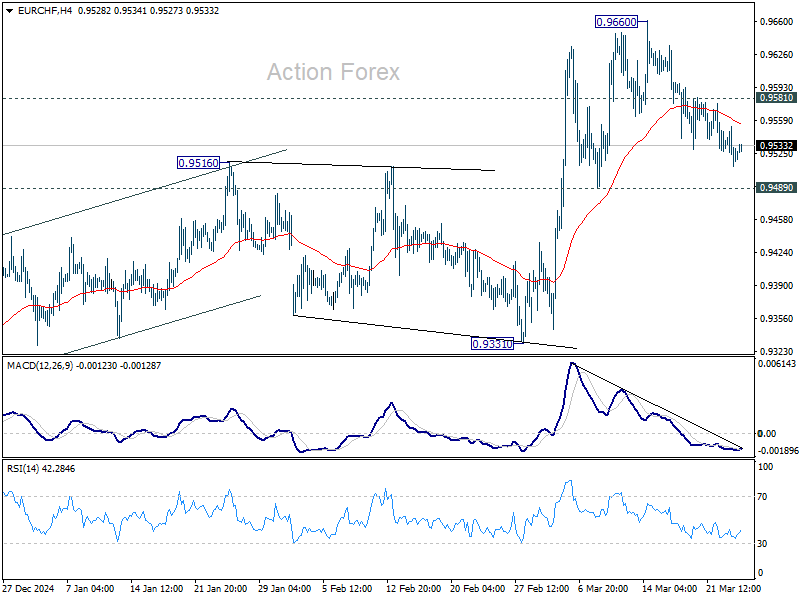
In the bigger picture, prior strong break of 55 W EMA (now at 0.9487) is a medium term bullish sign. Sustained break trading above long-term falling channel resistance (at around 0.9618) would suggest that the downtrend from 1.2004 (2018 high) has bottomed at 0.9204. Stronger rally should then be seen to 0.9928 key resistance at least.
GBP/JPY Daily Outlook
Daily Pivots: (S1) 193.46; (P) 194.24; (R1) 194.84; More...
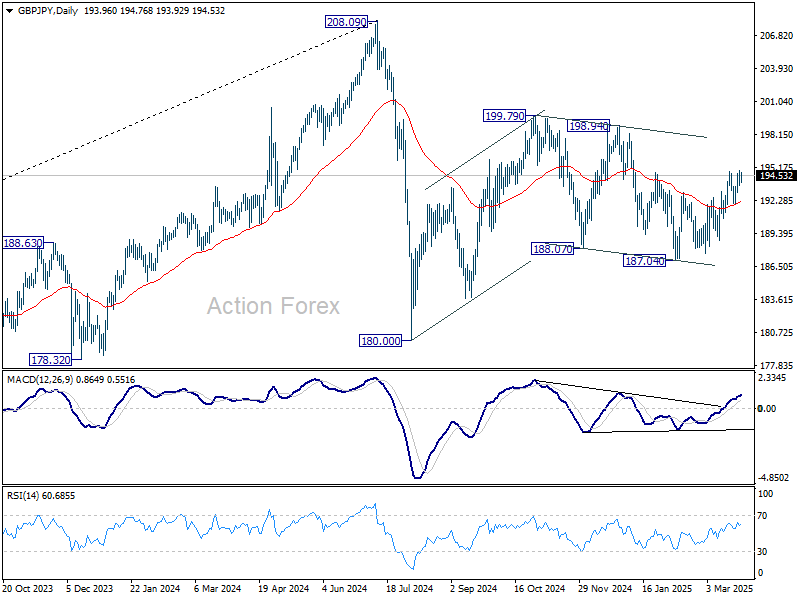
Range trading continues below 194.89 in GBP/JPY and intraday bias stays neutral. On the upside, above 194.89 will resume the rebound from 187.04 towards 198.94 resistance. On the downside, break of 190.71 will bring deeper fall back to 187.04 support. Overall, corrective pattern from 180.00 is still be extending.
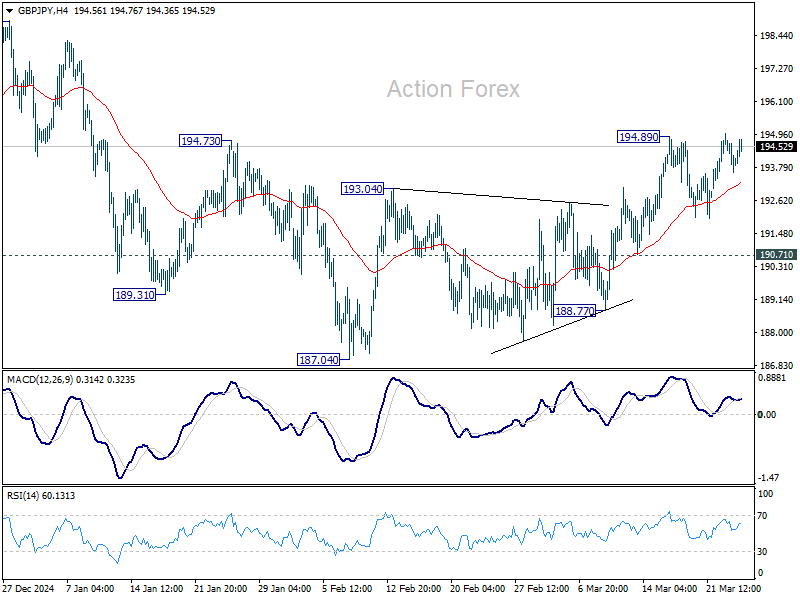
In the bigger picture, price actions from 208.09 are seen as a correction to rally from 123.94 (2020 low). Strong support should be seen from 38.2% retracement of 123.94 to 208.09 at 175.94 to contain downside. However, sustained break of 152.11 will bring deeper fall even still as a correction.
EUR/JPY Daily Outlook
Daily Pivots: (S1) 161.26; (P) 162.15; (R1) 162.67; More...
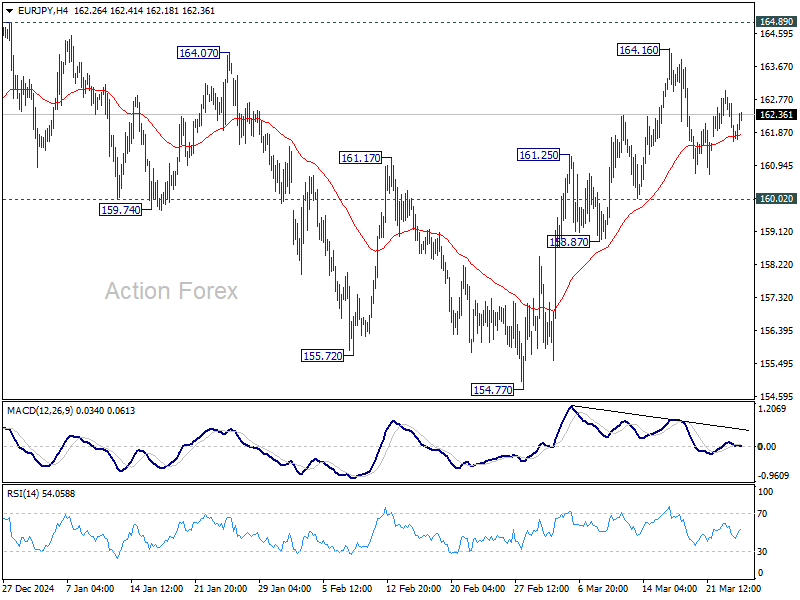
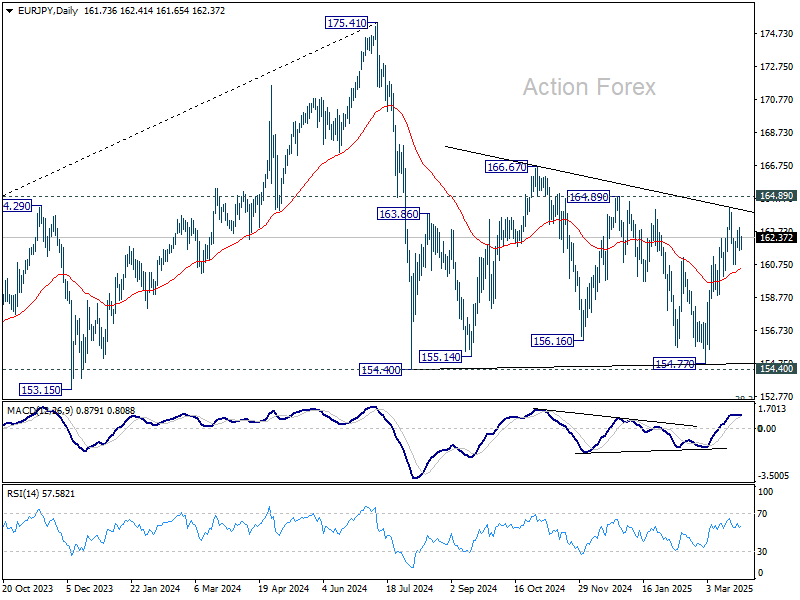
EUR/JPY's consolidation from 164.16 is still extending and intraday bias remains neutral. Further rally remains in favor as long as 160.02 support holds. Above 164.16 will target 164.89 and then 166.67. On the downside, however, break of 160.02 will argue that rise from 154.77 has completed and turn bias to the downside. Overall, sideway consolidation pattern from 154.40 is still extending.
In the bigger picture, price actions from 175.41 are seen as correction to rally from 114.42 (2020 low). Strong support should be seen from 38.2% retracement of 114.42 to 175.41 at 152.11 to contain downside. However, sustained break of 152.11 will bring deeper fall even still as a correction.
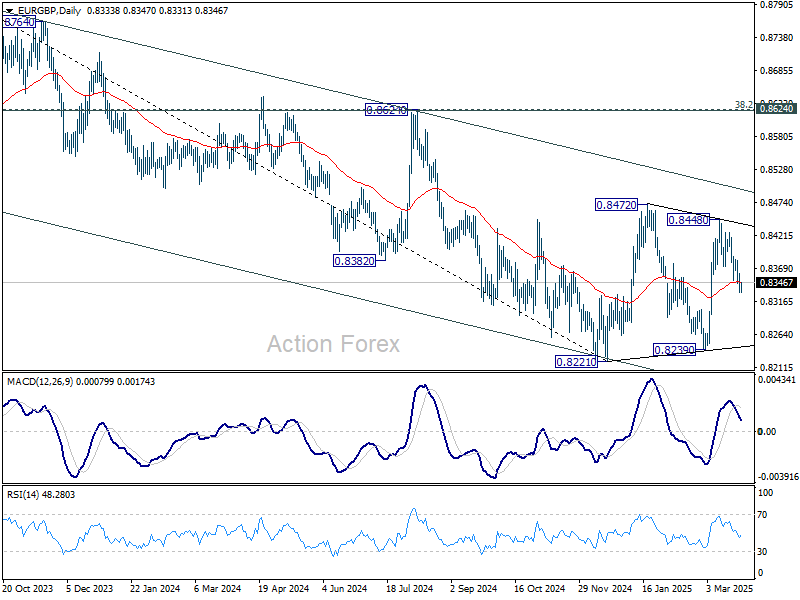
EUR/GBP Daily Outlook
Daily Pivots: (S1) 0.8327; (P) 0.8345; (R1) 0.8355; More...
EUR/GBP's fall from 0.8448 continued and the break of 55 D EMA (now at 0.8347) suggest that rise from 0.8239 has completed already. Intraday bias is back on the downside for 0.8239 support next. On the upside, above 0.8384 minor resistance will turn bias back to the upside for 0.8448. Overall, consolidation pattern from 0.8221 is still in progress and could extend further.
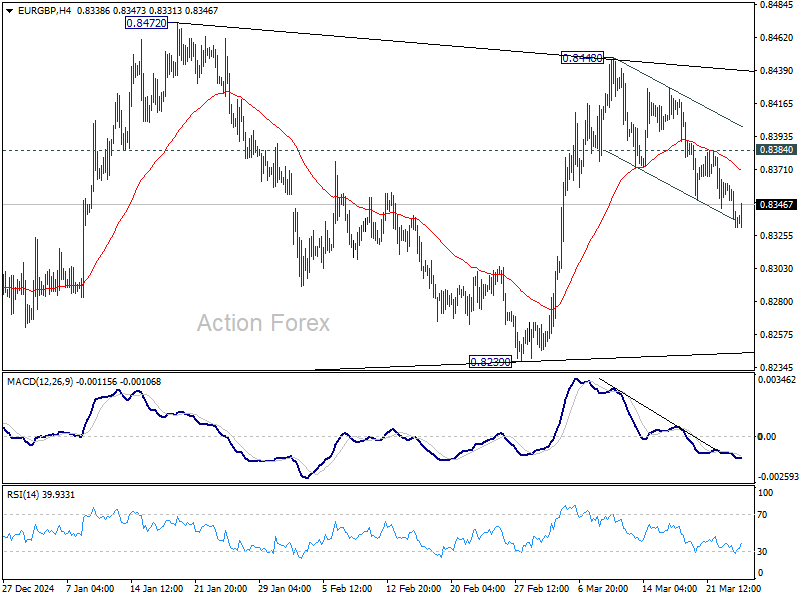
In the bigger picture, EUR/GBP is still bounded inside medium term falling channel. While rebound from 0.8221 might extend higher, it could still develop into a corrective pattern. Overall outlook will be neutral at best and down trend from 0.9267 (2022 high) could extend, at least until decisive break of channel resistance (now at 0.8495).
UK Inflation Slows, All Eyes on Budget
The latest data from the Conference Board came to back the mounting concerns among Americans regarding the future of the economy and inflation that a set of Michigan numbers have already warned about. The consumer confidence in this particular set of data plunged to a four-year low and inflation expectations jumped on tariff uncertainty. The Federal Reserve (Fed) Chair Jerome Powell has recently pointed at the strength of the US data, but the growth forecast are turning sour at a scary speed and waning sentiment will likely impact hard data – growth, employment and inflation – in the foreseeable future. On the other side of the Atlantic Ocean, the German data tells the exact opposite: business optimism in Germany hit the highest levels since last summer as the massive government spending that the German government agreed to unlock brings hope across manufacturers. As such, the convergence in sentiment between the two continents continues to develop, be confirmed by data and back the rotation trade.
The Stoxx 600 index rebounded yesterday after a three-session correction while US equities traded with no clear direction after a strong Monday rebound. The S&P50 closed flat. The doji candle formation typically hints at uncertainty and hesitation about where the US valuations should be headed next. In fact, investors are looking at April 2nd – the Liberation Day - hoping that the tariff announcements will bring more clarity. But April 2nd could be another day of imposing and pulling back tariffs in the continuation of a hectic and unpredictable trade policy that the White House follows since Trump tool office in January.
Valuation-wise, the rebound in European stocks sure narrowed the valuation gap with the US counterparts but the Stoxx 600 prints a PE ratio of around 17 today versus the S&P500 that still prints a PE ratio of near 29. The question is whether we could see a further convergence between the two. The answer is – it depends. One of the major boosters of sentiment since the start of the year was the decision from the European governments to unlock massive spending on infrastructure and security. The latter weighed heavier than the tariff fears and boosted growth expectations. The European spending narrative is still in play but is now widely priced in. Therefore the European investors will be facing the tough reality of the tariff game in the coming weeks and the latter could slow the rally that we saw in the European equities and the euro over the past three months. What Europe needs (what Europe really, really needs) is to turn infrastructure and security spending into growth, while the US growth slows. In summary, the rotation trade is probably not over but could be shaken by a new tariff wave in the short run.
Budget day
In the UK, the tariff fears are amplified by the fact that the UK won’t benefit from the ample budget spending that the continental European peers will. On the contrary, the spending hopes for the UK have been crumbling as borrowing costs keep rising and decrease Rachel Reeves’s fiscal headroom. The impact of tax rises, on the other hand, hit appetite and growth. And the Bank of England (BoE) is not in a hurry to provide relief with rate cuts pointing at global and trade uncertainties. Released this morning, the latest hinted that inflation in the UK came in softer-than-expected, providing a minor relief before today’s Budget Announcement.
But we already know that Rachel Reeves will announce a smaller ‘spending envelope’ later today; she is expected to announce a £10bn cut in day-to-day government spending. The smaller the envelop, the bigger the impact on sterling.
Partial truce?
News of a partial truce between Ukraine and Russia in the Black Sea saw limited reaction from oil traders. In theory, a truce or a partial truce should ease sanctions on Russian oil exports and have an easing effect on oil prices. But oil prices are relatively steady and US crude continues to test the $70pb resistance, hinting that the market is not buying the news for now. Yet the rising hope of a potential truce increases the downside risks and should temper appetite, along with the supply/demand gap pointing at cheaper oil in the medium term.
Elsewhere, copper futures on Comex advanced to an ATH yesterday as US buyers rush to buy copper before tariffs hit. But because copper is a barometer of global growth and the latter is being pressured by an escalating trade war, it’s just a matter of time before we see correction in copper prices.
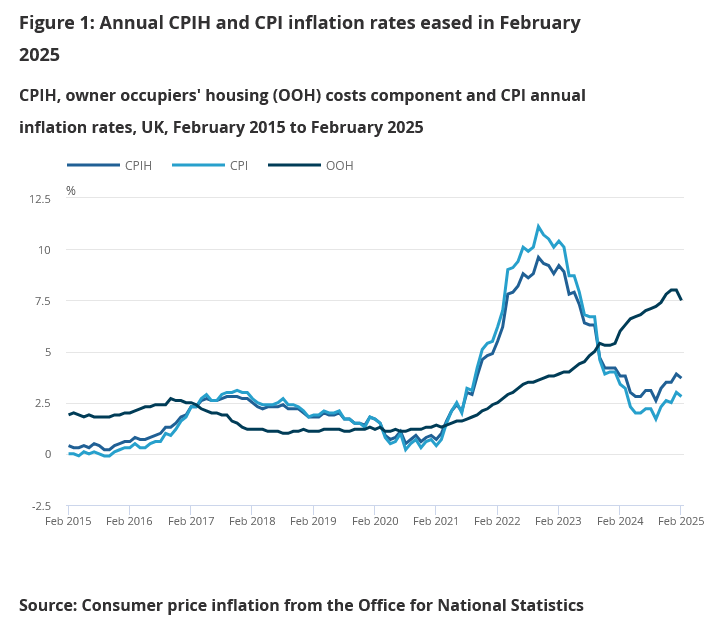
UK CPI slows to 2.8% in Feb, core down to 3.5%
UK CPI slowed from 3.0% yoy to 2.8% yoy in February, below expectation of 2.9% yoy. CPI Core (excluding energy, food, alcohol and tobacco) fell from 3.7% yoy to 3.5% yoy, below expectation of 3.6% yoy.
CPI goods annual rate slowed from 1.0% to 0.8%, while the CPI services annual rate was unchanged at 5.0%.
On a monthly basis, CPI rose by 0.4% mom.