Sample Category Title
EUR/USD Holds Firm as US Dollar Ends the Week With Losses
EUR/USD is trading near 1.0806 on Friday, maintaining its position despite failing to extend its gains further. Investors are focused on the upcoming US employment data for February, which will be released later today.
Key factors influencing EUR/USD
The US dollar briefly found support after President Donald Trump temporarily excluded some Canadian and Mexican goods from the 25% tariffs imposed earlier this week. This move raised hopes for further trade concessions, easing concerns slightly.
However, despite this development, the USD is on track to close the first week of March with a loss of over 3%. The escalating trade war has increased fears of negative economic consequences for the US, particularly given the heavy reliance of US companies on free trade.
Meanwhile, the euro gained support from expectations of increased government spending in Germany and other European nations, particularly in defence investments.
The European Central Bank (ECB) cut its interest rate as expected, reducing it to 2.65% per annum. This move was widely anticipated and did not create market surprises.
Technical analysis of EUR/USD
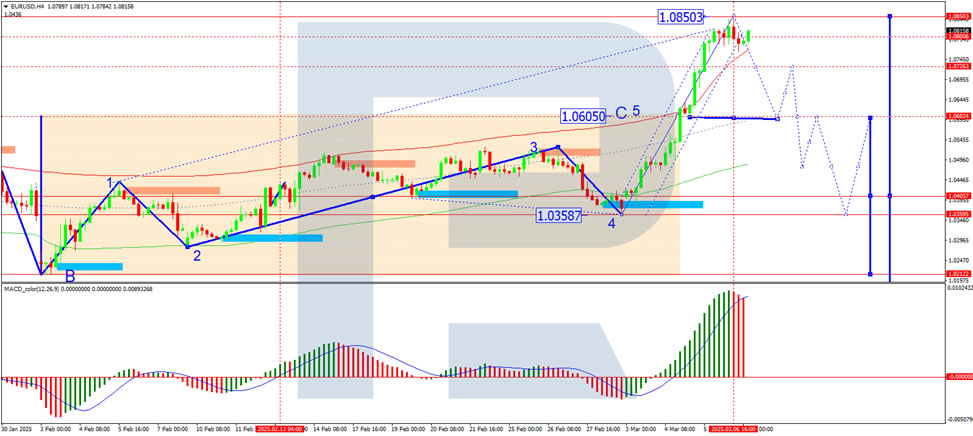
On the H4 chart, EUR/USD completed a growth wave to 1.0850 and is now forming a consolidation range around 1.0800. A downward breakout from this range is expected, potentially leading to a decline towards 1.0600. After reaching this level, a correction towards 1.0700 could follow. The MACD indicator supports this scenario, with its signal line above zero but turning downward, indicating potential weakness.
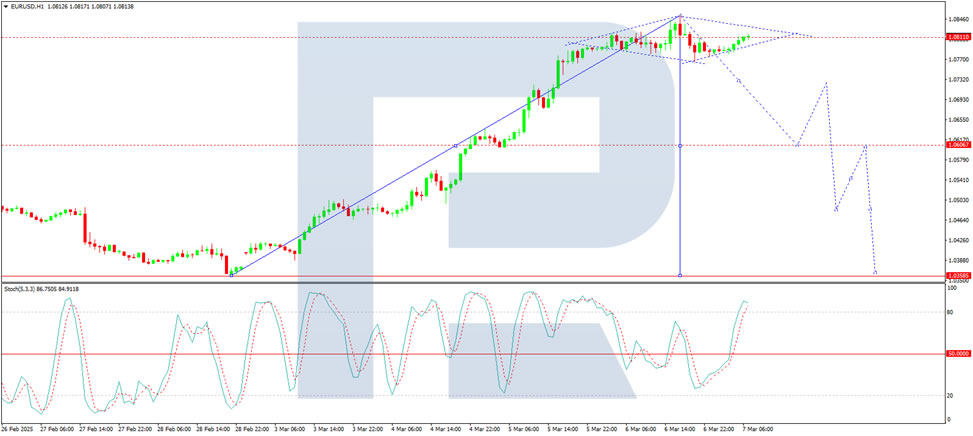
On the H1 chart, EUR/USD is consolidating around 1.0800. A move down to 1.0730 is expected, followed by a possible retest of 1.0800 from below before another decline towards 1.0600. If this trend continues, the next target could be 1.0400. The Stochastic oscillator confirms this outlook, with its signal line above 80 and preparing to decline towards 20, indicating a potential bearish shift.
Conclusion
EUR/USD remains elevated but faces increasing downside risks, particularly if US job data strengthens the dollar. While trade tensions and ECB policy support the euro, technical indicators suggest a potential decline towards 1.0600, with further downside possible. The US employment report will be a critical driver for the next major move in the pair.
EUR/USD Keeps Rolling After ECB Rate Cut
- Euro rally continues
- ECB lowers rates by 25 bps to 2.5%
- ECB’s Lagarde warns of growing risks and uncertainty
- US nonfarm payrolls expected to rise slightly to 160 thousand
The euro has posted strong gains on Friday after taking a pause a day earlier. EUR/USD is trading at 1.0858 in the European session, up 0.69% on the day. It’s been a remarkable week for the euro, which has soared 4.7% against the US dollar.
ECB cuts but Lagarde warns of uncertainty
The ECB lowered rates by 25 basis points on Thursday in a widely-expected decision. This brings the deposit rate to 2.5%, its lowest level since Dec. 2022. The central bank has been aggressive in its easing cycle, slashing rates by 185 basis points in just nine months.
The rate reduction was no surprise and is being described as the “last easy cut”. Inflation is running at a 2.4% clip, above the ECB’s 2% target but low enough to deliver rate hikes in order to boost the flagging economy. What’s next for the ECB is a tricky question, especially with economic and political developments moving at a dizzying pace.
First, the new Trump administration hasn’t wasted any time in imposing (and in some cases, suspending) tariffs, which has chilled investor sentiment and sent equity markets tumbling. The US hasn’t applied tariffs to the European Union although it has threatened to do so. The EU would surely retaliate and a trade war between the two giant economies will damage growth and raise inflation in the eurozone.
Second, Trump is showing growing impatience with Ukraine and has suspended military aid. Germany has responded by easing its fiscal spending rules and has proposed a massive spending scheme for defense and infrastructure. This has sent German bond yields and the euro soaring.
ECB President Lagarde said after the ECB meeting that the situation was changing “dramatically” by the day and the ECB would need to be “extremely vigilant” and “agile”. She reiterated that future rate decisions would be based on the data.
The US wraps up the week with the February employment report. Nonfarm payrolls sank to 143 thousand in January from 256 thousand a month earlier. The market estimate for February stands at 160 thousand. A surprise in either direction from nonfarm payrolls would likely have a significant impact on the direction of the US dollar.
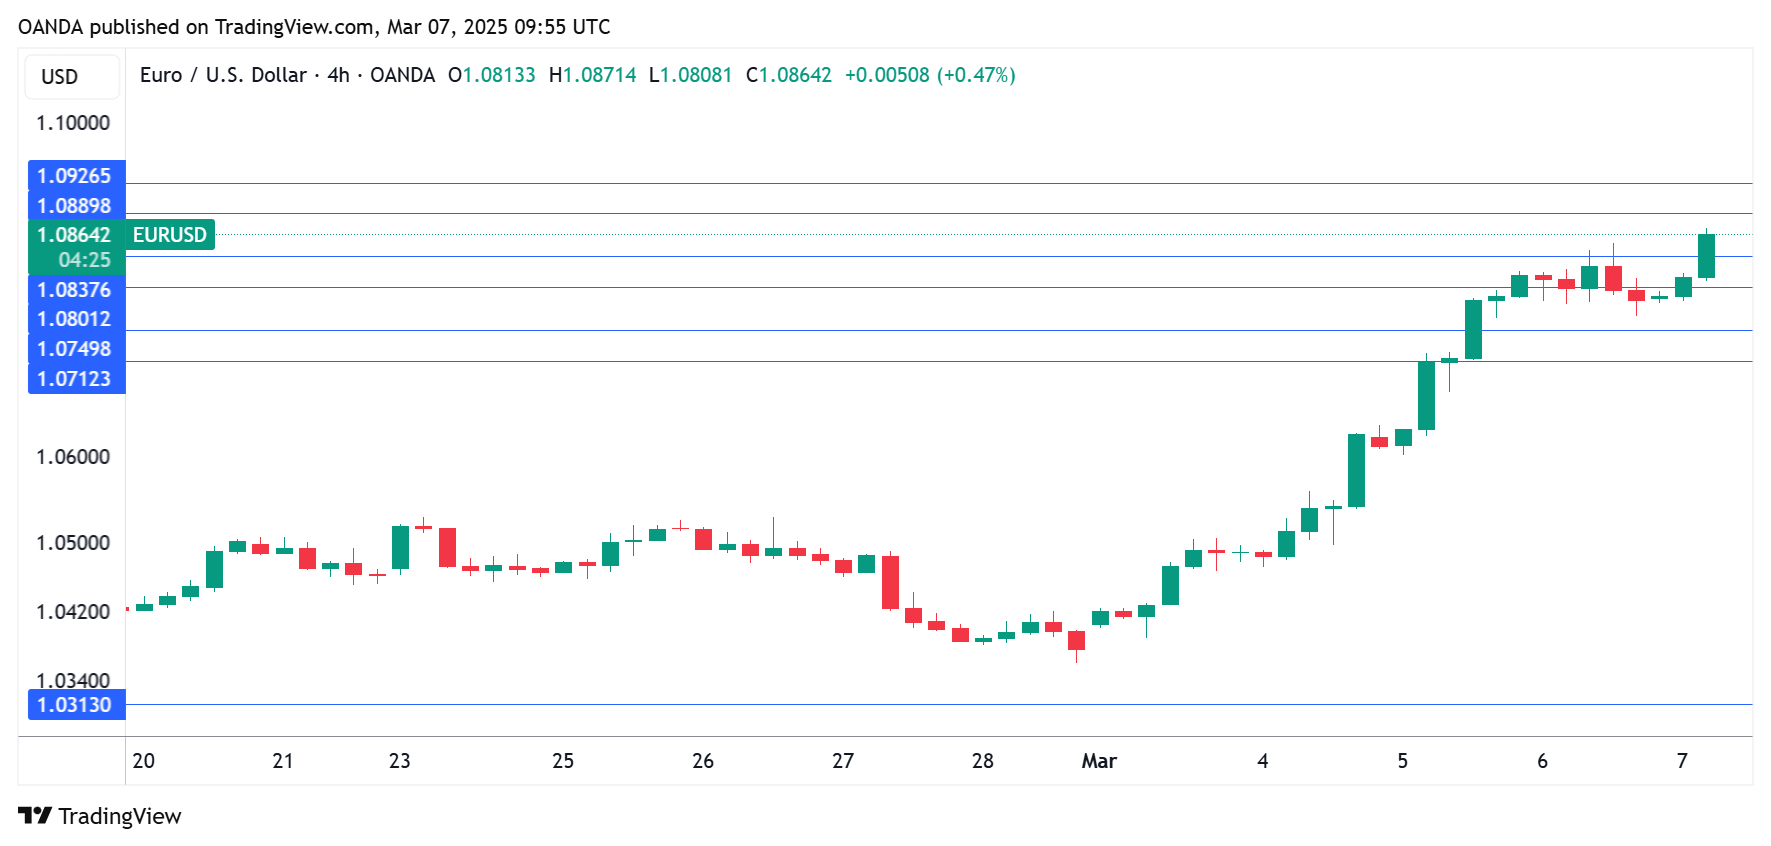
EUR/USD Technical
- EUR/USD has pushed above resistance at 1.0801 and 1.0837 and is putting pressure on resistance at 1.0889. Above, there is resistance at 1.0925
- 1.0749 and 1.0713 are the next support lines
Hang Seng Index Reaches Three-Year High
A month ago, while analysing the uptrend in the Hang Seng index (Hong Kong 50 on FXOpen), we noted that:
→ Positive sentiment was driven by the success of the DeepSeek startup, boosting Chinese tech stocks and mobile operators.
→ Price movements formed a bullish structure based on Fibonacci proportions.
→ Analysts predicted the uptrend could persist until the second half of March.
Today, the Hang Seng index (Hong Kong 50 on FXOpen) surged above the 24,500 level for the first time since February 2022. According to Reuters, investor enthusiasm for artificial intelligence continues to fuel the rally.
Technical Analysis of the Hang Seng Chart
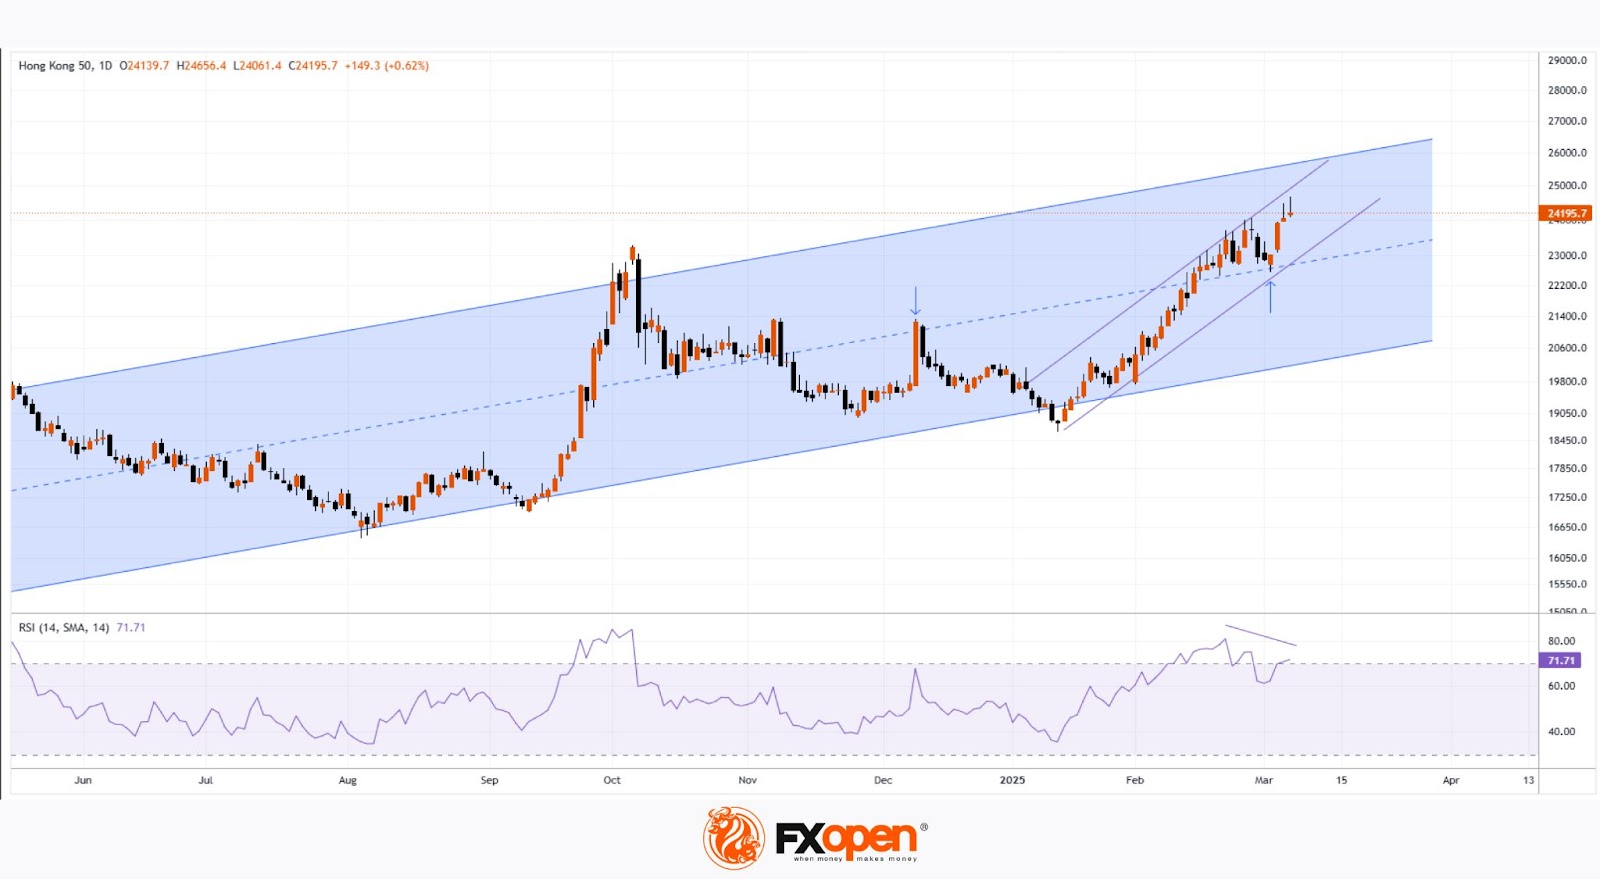
New price data support the construction of a large-scale upward channel (marked in blue).
From a bullish perspective:
→ The median line of the blue channel has shifted from resistance to support (as indicated by arrows).
→ The price remains within the intermediate purple ascending channel.
From a bearish perspective:
→ The last two candlesticks show long upper wicks—an indication that sellers are active, possibly locking in profits.
→ The RSI indicator is forming a bearish divergence.
Given these factors, the price appears vulnerable to a pullback. However, the future trajectory will largely depend on fundamental factors, particularly the ongoing tariff tensions between China and the United States.
Trade global index CFDs with zero commission and tight spreads. Open your FXOpen account now or learn more about trading index CFDs with FXOpen.
This article represents the opinion of the Companies operating under the FXOpen brand only. It is not to be construed as an offer, solicitation, or recommendation with respect to products and services provided by the Companies operating under the FXOpen brand, nor is it to be considered financial advice.
Cliff Notes: Stormy Seas Ahead
Key insights from the week that was.
In Australia, GDP printed broadly as expected in Q4 2024, rising 0.6%qtr to be up 1.3% over the year. On a per capita basis, GDP rose for the first time in two years, albeit by just 0.1%, ending the longest run of consecutive declines on record. While both public and private demand rose in the quarter, new public demand continues to do most of the heavy lifting, reaching a new record share of the economy.
Overall, the recovery in private demand is starting to unfold gradually, with household consumption lifting 0.4% in the quarter to be up just 0.7% over the year. Improved growth in real disposable income is an important driver of this trend, principally thanks to decelerating inflation. As foreshadowed by the Westpac Consumer Panel, the boost to incomes from the ‘Stage 3’ tax cuts looks to have largely been put aside to rebuild savings buffers. This could lay a foundation for stronger consumer demand later in 2025. But if the precautionary mindset persists, downside risks for consumption are likely to grow. The latest data on retail sales subsequently pointed to a modest gain in January; today’s household spending indicator was close to expectations at 0.4% though the previous month was marked down from 0.4% to 0.2%.
A surprise in the national accounts worthy of close scrutiny is the rise in unit labour costs reported for Q4, the consequence of a step-up in wage growth and declining productivity. Crucial to the significance of this outcome is the sectoral composition. Interestingly, today’s labour account revealed that labour productivity deteriorated across both market and non-market sectors. In this week’s essay, Chief Economist Luci Ellis considers the downside risks for inflation and growth with reference to Australia’s economic experience during the late 2010’s.
Before moving offshore, a final note on housing. February’s CoreLogic data reported a 0.3% lift in house prices across Australia, a post rate-cut bounce consistent with historical patterns. Both the breadth and persistence of this turnaround over coming months will be of great interest, especially given the stretched starting point for affordability. Supply remains a crucial factor for the longer-term outlook; encouragingly, the firming uptrend in dwelling approvals is coinciding with tentative evidence of easing supply constraints for construction, reducing risks for the pipeline. For more detail on our views around the housing market, see our latest Housing Pulse on Westpac IQ.
Offshore, the focus was again on the US as President Trump’s tariffs on Canada and Mexico were imposed and then deferred (again). Eventually it was made clear that goods covered by the USMCA would be exempted for now, materially reducing the immediate effect of the tariffs, especially for key US manufacturers such as the auto industry and farmers who import fertiliser. Still President Trump was clear that this is a short-term deal, and that these tariffs along with the industry specific measures would come into full effect April 2.
The uncertainty being created by US trade policy is becoming evident with US consumer confidence hit in the most recent readings and personal consumption disappointing in January – down 0.2% on a nominal basis and 0.5% for real sales volumes despite a stronger-than-expected rise in personal income of 0.9%. Financial markets are also becoming increasingly concerned over the potential ill effects of tariffs on the US economy, the US dollar sharply lower over the week from almost 108 last Friday to 104 today on a DXY basis. An aside, Australian exporters look to be getting ahead of the building tariff risk, our trade surplus jumping higher to $5.6bn in January as exports to the US soared, albeit at the expense of shipments elsewhere.
US business surveys are yet to show a definitive effect however, the ISM services index edging higher in February from 52.8 to 53.5 while the ISM manufacturing PMI reported a modest decline from 50.9 to 50.3. The prices paid component for manufacturing shows tariffs are front of mind however, the index surging 7.5 points to 62.4, the highest level since mid-2022. The manufacturing employment index is worth keeping an eye on, having fallen to a contractionary 47.6 in February; though for aggregate employment, services is the dominant sector and remains in robust shape, its employment index at 53.9.
Across the Atlantic, downside risks were also front of mind for the ECB who cut its key rates by 25bps, bringing the deposit rate to 2.50%. GDP growth was revised down by 0.2ppt for 2025 and 2026 to 0.9% and 1.2%, a revision attributed to weakness in exports and firms holding back on investment decisions in the face of uncertainty. We expect three more cuts in coming months bringing policy to a neutral stance, with the ECB likely to remain cautious of downside risks to activity thereafter.
While Canada and Mexico received a short-term reprieve from the US on tariffs this week, China did not. Nonetheless, Chinese Premier Li Qiang's address to China's 2025 National People's Congress struck a very confident tone. Manufacturing investment and technological development remain priorities, but the need to bolster the housing sector, employment and consumer confidence is also front of mind. Fiscal support will be increased in 2025, and authorities are ready to provide additional support if downside risks crystalise. All told, authorities expect to repeat 2024 and grow the economy by another 5.0% in 2025 in fair or stormy weather.
US Payrolls are on Tap
Markets
Main action on the German/European yield curve remained centered at the long end of the curve in the wake of Germany fiscal “whatever it takes”. German yields added up to 4.1 bps (10-yr) in a daily perspective. Towards the end of the trading session, the German Bund future tried to fight somewhat back after this week’s violent sell-off. Despite any potential hiccups, we thing laws of gravity still count for Bunds over the medium term, eyeing a return for the German 10-yr yield to the 2023 top just north of 3%. The front end of European yield curves was broadly unchanged despite the ECB meeting. The European central bank extended its cutting cycle by lowering key rates by another 25 bps (deposit rate now 2.5%). New inflation forecasts were almost unchanged with GDP prognosis facing a small downward revision. It was too early to assess the potential impact of this week’s German/European spending pledge, but they entail upside risks to both growth and inflation. The ECB believes its monetary policy is now meaningfully less restrictive, not ruling in or out anything for the April policy meeting. Data will decide on the outcome, but these are scarce with only one additional PMI survey (likely to show more optimism) and one additional CPI release. EMU money markets discount a 75% probability for another cut, but our preferred scenario is a pause. The single currency managed to hold on to this week’s gains, taking out 1.0804 resistance next (62% retracement on Sep24-Feb25 decline) and opening a path to full retracement (target 1.1214). Today we have more attention to the USD-side of the equation. First, the US administration seems to be sensitive to the market moves triggered by its explosive policy mix. Tariff wars and DOGE cost cuts put a US recession risk premium on US assets, with US stock markets significantly underperforming European equities, US Treasuries outperforming German Bunds and the dollar suffering. The US administration yesterday announced a significant turnaround on tariffs against Mexico and Canada, exempting all goods covered by the USMCA trade deal until April 2. There was also a first pushback against DOGE-efforts (the scalpel rather than the hatchet). It so far failed to lift US spirits, but should be taking into account going into the weekend and following recent moves. Second, US payrolls are on tap. Consensus expects solid job growth (160k). We still believe in asymmetric risks with markets especially responding to weaker numbers which could support front end US Treasuries and weigh more on USD. Finally, US Fed Chair Powell speaks on the US economic outlook after European close. The timing is striking, just ahead of the blackout period for the March 19 FOMC meeting and might be used to steer market expectations. The March policy rate status quo can be taken for granted, but Powell could give more weight to downside economic risks, suggesting that the pause might be shorter than envisioned back in January.
News & Views
The president of the Eurogroup – the bloc’s finance ministers – Donohoe said there’s a clear path for the euro to improve its position as a global currency. This is currently a dollar privilege. The USD makes up about 57% of global reserves compared to 20% for the euro. However, that USD share is down from 61%, with some analysts expecting that to go down further in the coming years, driven by amongst others increasing US isolationism. Donohoe said the euro should must take advantage of this huge opportunity. The “heightened level of urgency” to expand EU capital markets and adopt a digital euro would help strengthening the common currency as well as the upcoming massive defense investments, including in Germany. This would deepen and bring more liquidity to the European bond market, seen as prerequisites for any currency aiming for a global role. The US Treasury market’s scale amounts to $28tn compared to the €1.8tn market for German bonds.
Yesterday’s special EU defense summit produced two separate statements. In the first, 26 of the 27 leaders pledged “enduring” support for Ukraine and called for both Kyiv and Europe to be involved in any negotiations about ending the war. It also mentioned EU states to “contribute to security guarantees based on their respective competences and capabilities” in a post-war Ukraine. Hungary did not sign this statement but did agree with another in which EU member states endorsed the new funding initiatives proposed by the Commission. These include changing the bloc’s deficit rules to exempt defense spending from it and an instrument that would provide €150bn in European loans to capitals. “Europe must become more sovereign, more responsible for its own defense and better equipped to act and deal autonomously with immediate and future challenges and threats with a 360° approach.” The details will now have to be hammered out over the coming weeks with the March 20-21 Summit a candidate for concrete measures to be announced.
GBP/JPY Daily Outlook
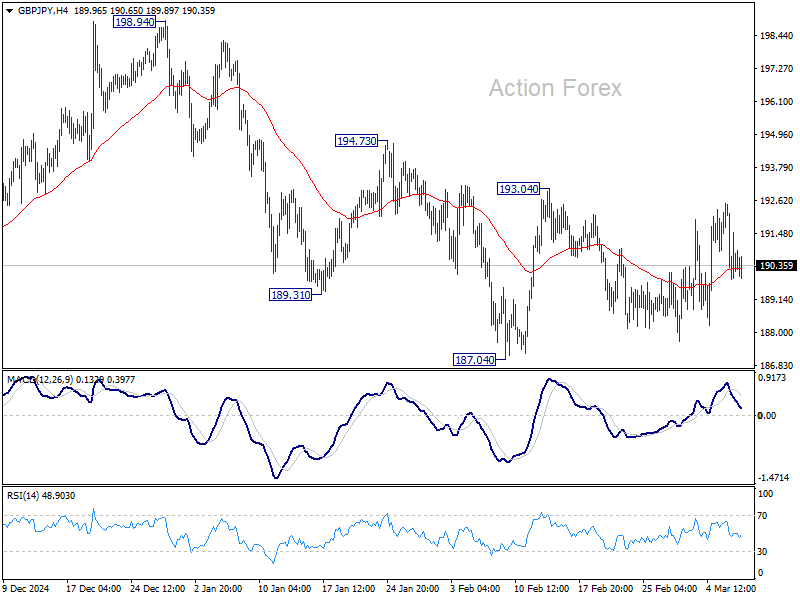
Daily Pivots: (S1) 189.50; (P) 191.03; (R1) 192.16; More...
Intraday bias in GBP/JPY remains neutral for now, as range trading continues. On the upside, firm break of 193.04 will resume the rebound from 187.04 to 194.73 resistance, and then 198.94. On the downside, firm break of 187.04 will extend the fall from 199.79 towards 180.00 support. Overall, corrective pattern from 180.00 might still be extending.
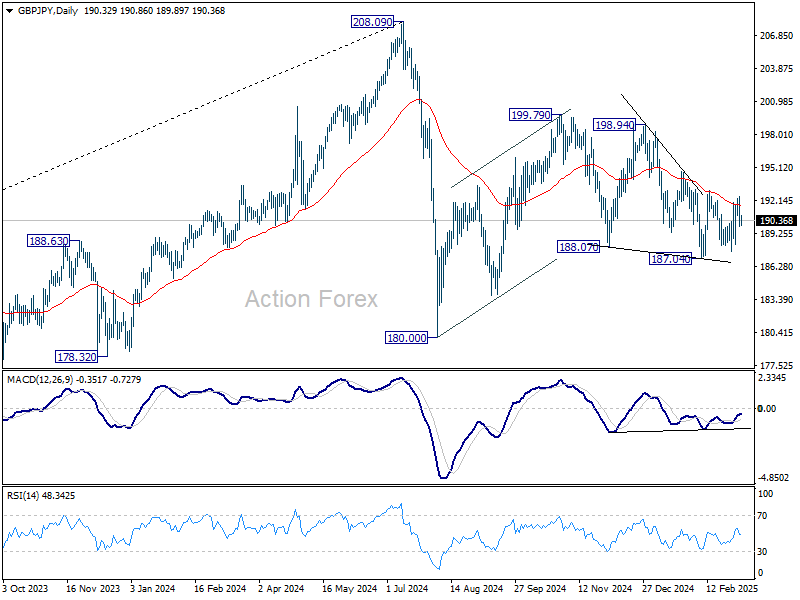
In the bigger picture, price actions from 208.09 are seen as a correction to rally from 123.94 (2020 low). Strong support should be seen from 38.2% retracement of 123.94 to 208.09 at 175.94 to contain downside. However, sustained break of 152.11 will bring deeper fall even still as a correction.
EUR/JPY Daily Outlook
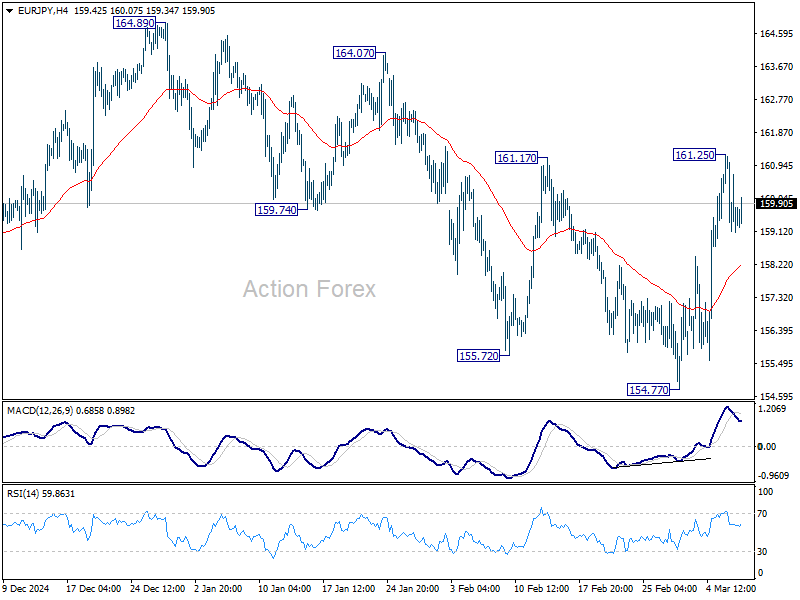
Daily Pivots: (S1) 158.73; (P) 160.01; (R1) 160.88; More...
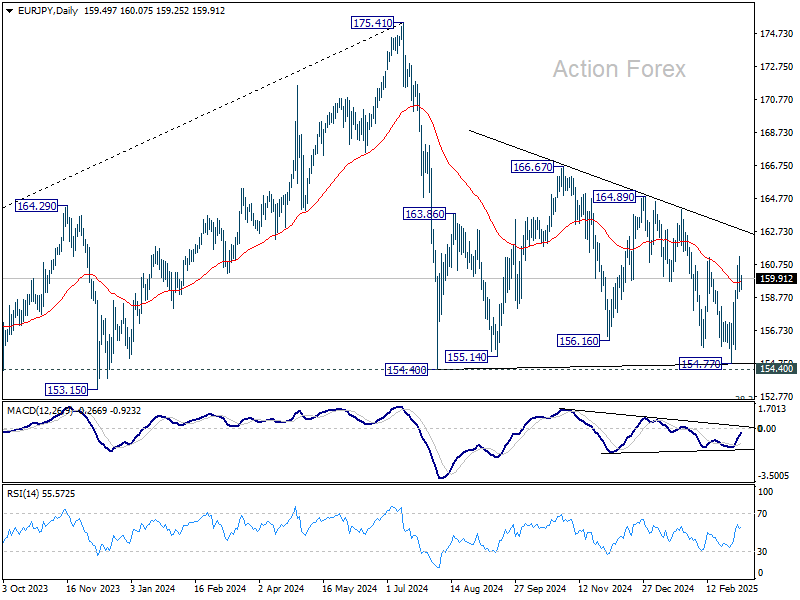
EUR/JPY retreated after hitting 161.25 and intraday bias is turned neutral again. Rise from 154.77 is seen as another rising leg in the corrective pattern from 154.40. Strong break of 161.17 resistance will affirm this case and target 164.89 resistance next.
In the bigger picture, price actions from 175.41 are seen as correction to rally from 114.42 (2020 low). Strong support should be seen from 38.2% retracement of 114.42 to 175.41 at 152.11 to contain downside. However, sustained break of 152.11 will bring deeper fall even still as a correction. Next target will be 100% projection of 175.41 to 154.40 from 166.67 at 145.66.
EUR/GBP Daily Outlook
Daily Pivots: (S1) 0.8351; (P) 0.8381; (R1) 0.8402; More...
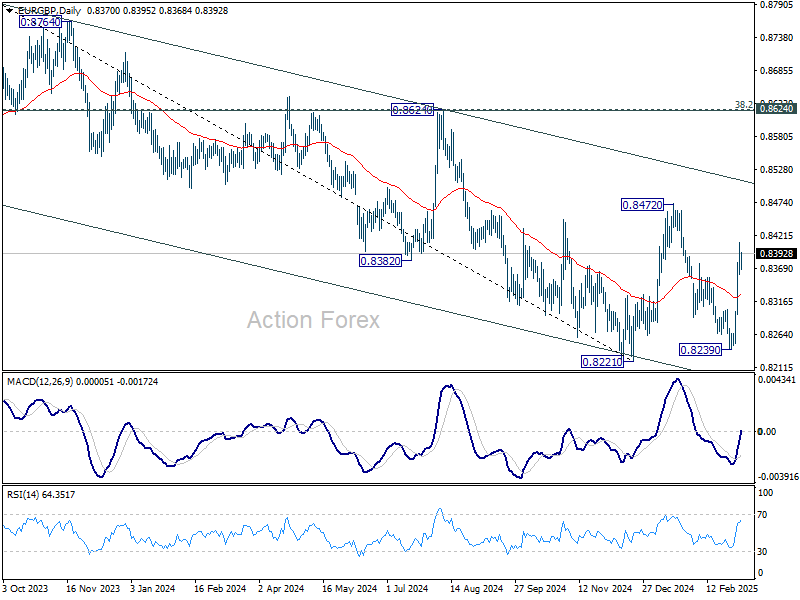
EUR/GBP lost momentum after hitting 0.8410 and intraday bias is turned neutral first. Downside of retreat should be contained above 55 4H EMA (now at 0.8314). Rise from 0.8239 is seen as the third leg of the pattern from 0.8221. Above 0.8410 will target 0.8472 resistance next.
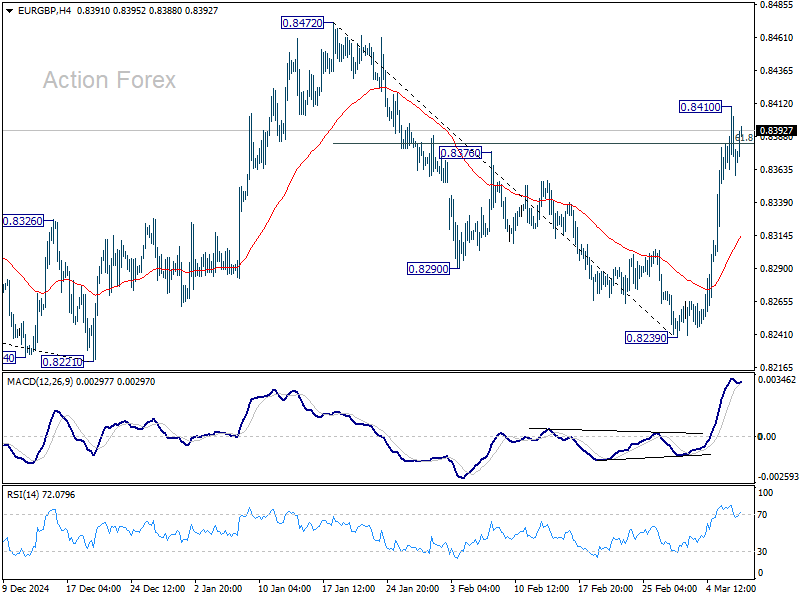
In the bigger picture, EUR/GBP is still bounded inside medium term falling channel. While rebound from 0.8221 might extend higher, it could still develop into a corrective pattern. Overall outlook will be neutral at best and down trend from 0.9267 (2022 high) could extend, at least until decisive break of channel resistance (now at 0.8511).
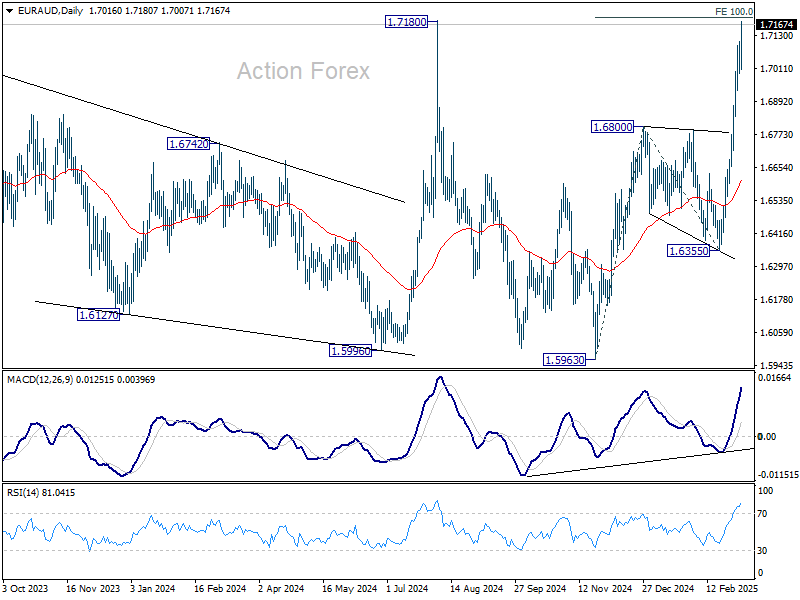
EUR/AUD Daily Outlook
Daily Pivots: (S1) 1.6944; (P) 1.7019; (R1) 1.7106; More...
There is no sign of topping in EUR/AUD yet and intraday bias stays on the upside. Sustained break of 100% projection of 1.5963 to 1.6800 from 1.6355 at 1.7192 will confirm larger up trend resumption, and target 161.8% projection at 1.7709 next. On the downside, below 1.6990 minor support will turn intraday bias neutral first.
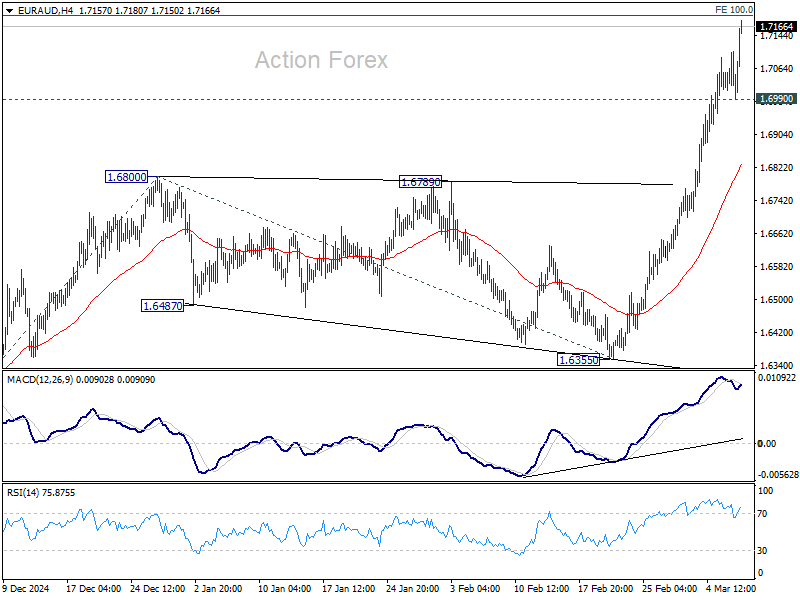
In the bigger picture, up trend from 1.4281 (2022 low) is still in progress. Firm break of 1.7180 (2024 high) will confirm resumption. Next target is 61.8% retracement of 1.9799 (2020 high) to 1.4281 at 1.7897. For now, outlook will stay bullish as long as 1.6355 support holds, even in case of deep pullback.
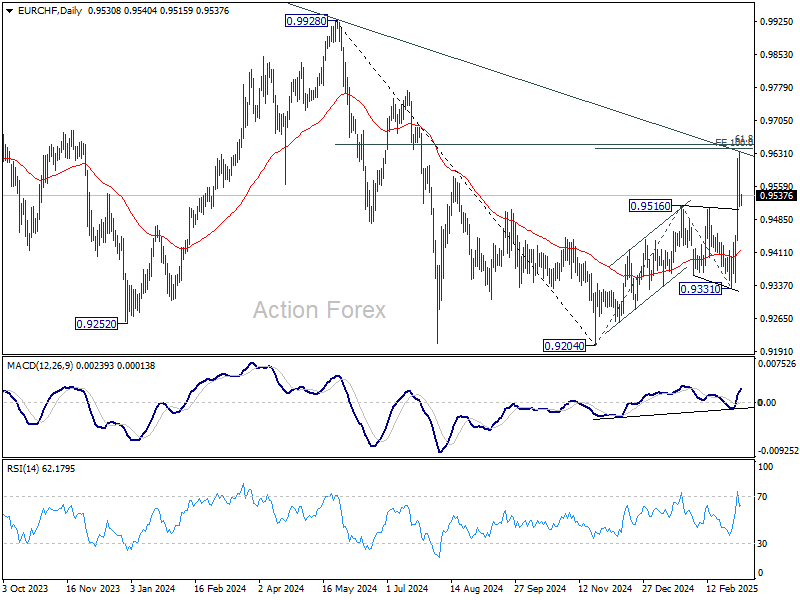
EUR/CHF Daily Outlook
Daily Pivots: (S1) 0.9484; (P) 0.9560; (R1) 0.9605; More....
EUR/CHF retreated ahead of 100% projection of 0.8204 to 0.9516 from 0.9331 at 0.9643 and intraday bias is turned neural for some consolidations. Further rally is expected as long as 0.9516 resistance turned support holds. ON the upside, firm break of 0.9634 will target 0.9928 key structural resistance. However, sustained trading below 0.9516 will mix up the outlook and turn focus back to 0.9331 support.
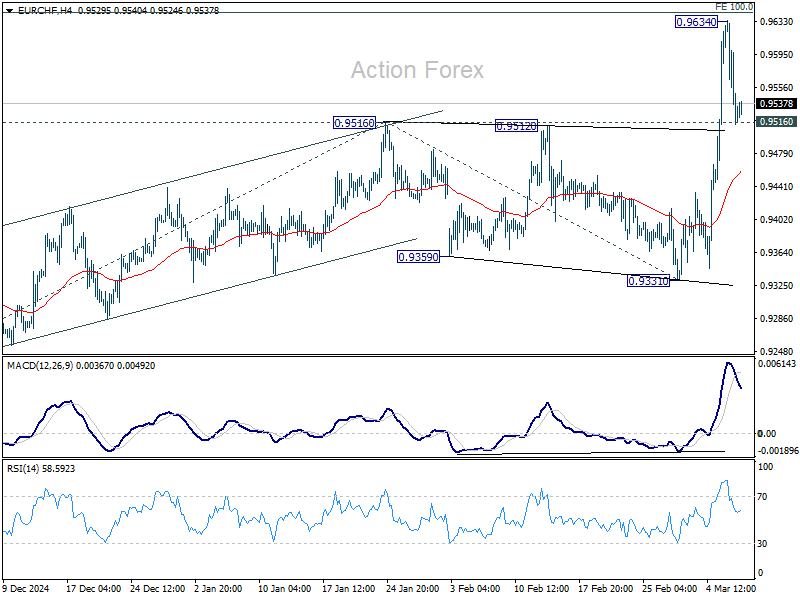
In the bigger picture, the strong break of 55 W EMA (now at 0.9484) is a medium term bullish sign. Sustained break trading above long-term falling channel resistance (at around 0.9620) would suggest that the downtrend from 1.2004 (2018 high) has finally bottomed at 0.9204. Further break of 0.9928 will solidify this bullish case, and bring stronger medium term rise even still as a corrective move.